1. Background
People working in health service are believed to be much more susceptible to mental diseases, risk of suicide, and depression than general population (1). It is important to take account of individuals’ mental health in all aspects of individual, social, and work life. In this regard, the nurses who consist a large proportion of health service has a stressful job. They serve to care for patients as well as their physical and mental conditions (2). Nurses, as a powerful part of the health care service, play a pivotal role in care, treatment development, and health promotion (2, 3). Hence, it is important for nurses to be mentally and physically healthy (4, 5). Nurses are prone to mental and physical stresses owing to long working shifts and the resulted fatigue. Nurses without enough mental and physical health, would not be able to do functions like furnishing the patient with mental and physical support (5, 6).
Depression as a common disorder in psychiatry as well as in medicine manifests with mental illness, lack of energy, loss of strength, frustration, uselessness, interestedness, and pessimism (7). Depression is an aggregation of different mental and psychological attitudes expressed from mild distress to silence to everyday life activities avoidance. Basic depression is a term coined by the American association of psychiatry in 1980 referring to the total sum of affective disorder symptoms for DSM-III which later this term got popularized. Depression gives rise to significant incapability in individual, social, and wok life, and has an impact on one’s daily performance like eating, sleeping, and health care (8, 9).
This mental disorder is considered the fourth disabling factor worldwide and predicted to turn out as the second disabling disease by the year 2020 (10). There is a direct relation between the incidence of depression and mental tensions. At work, stress and depression could be caused by physical, psychological, and social stimuli (6, 10). An aggregation of unrelieved stresses can cause chronic fatigue and depression in nurses resulting from frustration. Depression caused by job-related stress brings about damages in the form of medical expenses, loss of work hours, and a reduction in production. Absenteeism is another after-effect of depression turning into a problematic situation (9, 10).
The onset age of depression ranges from childhood to old age, but in 50% of cases the onset range is 20 - 50 years which most of active force of nursing profession fall into this range (11). According to previous studies, nurses’ depression may be linked with various factors such as age, long working hours, night shift, and socioeconomic factors (3, 5, 11). Quality of life is also another psychological part of people’s life indicating to what extent efficiency is matched with a person’s health (12). The World Health Organization (WHO) defines quality of life as an individual’s perception of his or her place in life based on cultural conditions and value-social system in which she or he lives and the perception takes meaning in relation to his or her primary aims, attitudes, and views. This issue is extensively affected in various ways by the individual’s physical and mental status, beliefs, and social communications. Quality of life should be considered an important index in a person’s mental and physical aspects, as it may contribute to increase in the person’s efficiency and prevent mental disturbance (13, 14).
2. Objectives
Given the importance of depression and nurses’ quality of life as a key factor in the health care system, and considering the fact that nurses’ health security affects the quality and quantity of health services which eventually secure community’s health, we aimed to explore depression and quality of life among nurses in Ilam hospitals using casual path analysis model. There are some factors that their relations with depression and quality of life will be looked into, such as age, marital status, sex, couple’s job, couple’s education, parents’ death before the age of 11, family size, constant intake of contraceptive drugs over the last 3 months, current pregnancy, overtime hours, and night work hours.
3. Patients and Methods
The study has a cross-sectional design and conducted on all employed nurses (191 nurses) in Ilam hospitals working shifts in 2013. These hospitals included Imam Khomeini with 71 nurses, Mostafa Khomeini with 74 nurses, Taleghani with 26, Ghaem with 10 nurses, Kosar Maternity with 6 nurses, and social security clinic with 4 nurses. Since they had different shifts, the researchers had to visit them frequently on the job and justify them with regard to the objectives of the study. After orienting all nurses, two questionnaires: 21-item Beck Depression Inventory (BDI) and quality of life (Short form-12) with previously confirmed validity and reliability were distributed among the nurses. Quality of life questionnaire (SF-12) is a modified form of SF-36. The questionnaire comprised of 8 sections divided into two final dimensions: physical and mental. The Cronbach α and intraclass correlation coefficient (ICC) for SF-12 are reported to be 0.70 and 0.60, respectively. And for BDI, they are 0.87 and 0.65, respectively. The BDI score ranges from 0 to 63, and its classification is presented in the Table 1. Also, range of the SF-12 was 1 - 5 for each component that 1 - 2, 2 - 3, 3 - 4, and 4 - 5 showed bad, moderate, good, and very good status for each component, respectively (15, 16).
Table 1.
Depression Profile Among Ilam Nurses in Terms of Intensity a
| Depression Level | No. (%) | Mean ± SD | 95% Confidence Level |
|---|---|---|---|
| Low (0 - 13) | 66 (34.55) | 7.78 ± 1.85 | 4.15 - 11.40 |
| Mild (13 - 19) | 60 (31.41) | 15.23 ± 2.02 | 11.27 - 19.19 |
| Moderate (20 - 28) | 56 (29.32) | 23.10 ± 4.45 | 14.37 - 31.82 |
| Severe (29 - 63) | 9 (4.71) | 38.40 ± 8.70 | 21.34 - 55.45 |
| Total | 191 (100) | 21.13 ± 4.25 | 12.80 - 29.46 |
a Data are presented as No. (%) or mean ± SD.
3.1. Path Analysis
Path analysis is a statistical technique applied to determine casualty and tests casual models which must be a casual graph. In fact, path analysis represents casualty. Path analysis, a form of applied regression analysis, is applied to test complex hypotheses in which path graph is used (17). Path analysis determines to what extent an independent variable directly and indirectly affect the dependent variable. Using path analysis, it is possible to measure the direct and indirect effects of the independent variables on the dependent ones. Therefore, path analysis allows us to spot the compatibility of variable’s effect with one another. Path analysis provides a great deal of information as to the casual processes in a simple way (18). It is used to determine the direct and indirect effects as well as inefficiency among variables embedded in a casual system. Hence, the principle of causality plays a pivotal role in using path analysis. It is noteworthy that the goal of path analysis is testing the analytical model of study, because path analysis diagram results in theoretical frameworks (19). Assumptions related to multiple linear regression were normal distribution of the dependent variable (Kolmogorov–Smirnov test (KS test) test: P value ≥ 0.05), linear relationship between dependent variable and independents variable (Scatter plot), and homoscedasticity and collinearity status among the independent variables (17-19).
In this study, the total score of depression, was entered the model as the main dependent variable. In the first step, a preliminary casual model for depression was developed based on previous research, then the model was analyzed using multiple regression and eventually the final model for depression was developed after eliminating insignificant variables (P ≥ 0.05). In the model, standardized beta coefficient (β) yielded from multiple regression represents the relationship between variables, and coefficient of determination (R2) yielded from regression analysis represents the model’s efficiency. The independent variables that were considered based on the previous studies (7-12) included: physical and mental components (quality of life indexes), age, sex, marital status, spouse’s job, spouse’s education, parents’ death before the age of 11, family size, history of depression, constant use of contraceptive drugs in the last 3 months, current gestation, overtime hours, and night work hours. Data were inserted into SPSS version 18 and analyzed using regression test and, in the end, the fit model was identified.
4. Results
Demographical information of the participants is presented in Table 2. As shown, some variables such as spouse’s job (P ≥ 0.11), spouse’s education (P ≥ 0.28), parents’ death before the age of 11(P ≥ 0.09), family size (P ≥ 0.17), constant intake of contraceptive drugs in the last 3 months (P ≥ 0.32), and current gestation (P ≥ 0.72) revealed no significance in the regression analysis, so they were excluded from the model.
Table 2.
Demographic Characteristics of Nurses in Ilam Hospitals
| Variables | Values a | BDI b |
|---|---|---|
| Age, y | ||
| 20 - 30 | 61 (31.94) | 14.25 ± 2.25 |
| 30 - 40 | 98 (51.31) | 19.23 ± 1.25 |
| Over 40 | 32 (16.75) | 27.25 ± 3.78 |
| Gender | ||
| Female | 117 (61.26) | 22.28 ± 3.45 |
| Male | 74 (38.74) | 19.02 ± 2.76 |
| Marital status | ||
| Married | 97 (50.79) | 24.25 ± 2.208 |
| Single | 84 (43.98) | 21.23 ± 4.18 |
| Widowed or divorced | 10 (5.24) | 22.76 ± 3.25 |
| Spouse’s job | ||
| Employed | 118 (69.41) | 21.15 ± 4.36 |
| Out of work | 40 (23.53) | 22.66 ± 2.33 |
| Other | 12 (7.06) | 19.65± 2.58 |
| Night shift hours per month | ||
| Less than 5 | 10 (5.29) | 17.01 ± 3.33 |
| 5 - 15 | 61 (32.28) | 17.96 ± 3.96 |
| 15 - 25 | 68 (35.98) | 22.76 ± 3.25 |
| 25 - 35 | 32 (16.93) | 23.05 ± 3.25 |
| Above 35 | 18 (9.5) | 22.50± 3.06 |
| Mental component (MC) | ||
| Bad | 13 (6.81) | 24.25 ± 3.25 |
| Moderate | 34 (17.8) | 23.22 ± 4.05 |
| Good | 83 (43.46) | 20.01 ± 2.288 |
| Very good | 61 (31.94) | 17.33 ± 2.22 |
| Physical component (PC) | ||
| Bad | 16 (8.38) | 23.04 ± 2.25 |
| Moderate | 58 (30.37) | 22.62 ± 2.77 |
| Good | 81 (42.41) | 19.66 ± 4.30 |
| Very good | 36 (18.85) | 16.22 ± 3.36 |
a Data are presented as No. (%) or.
b Data are presented as mean ± SD.
R2 coefficient representing efficiency and fitness of model (18) was yielded to be 0.48. In other words, the model can explain 48% variance of depression explained by the independent variables entered to the analysis.
The model of depression is presented along with interpretive tables and graphs in the following sections. Also, the state of quality of life and depression among nurses in Ilam city are presented respectively in Tables 1 and 2.
The mean of depression, in this study, was estimated to be 4.25 ± 21.13; nurses state of depression is also shown in Table 1 in terms of different degrees (Low, mild, moderate, severe). Given the preliminary model, the following path analysis model was developed for nurses’ depression in Ilam using regression analysis.
Table 3.
Regression Analysis of the Related Factors With Depression in Nurses
| Variables | Unstandardized (B) Coefficient | SE | Standardized (B) Coefficient | t | P Value |
|---|---|---|---|---|---|
| Constant | 3.95 | 0.95 | - | 18.25 | 0.01 |
| Age | 1.33 | 0.85 | 0.16 | 8.25 | 0.02 |
| Overtime | 1.02 | 1.33 | 0.12 | 7.75 | 0.04 |
| Night shift | 2.25 | 1.10 | 0.18 | 4.94 | 0.03 |
| Marital status | 2.01 | 0.85 | 0.25 | 5.36 | 0.02 |
| History of depression | 1.36 | 0.35 | 0.07 | 3.33 | 0.01 |
| Sex | 0.95 | 0.86 | 0.02 | 1.26 | 0.12 |
| Physical component | 3.25 | 0.89 | 0.24 | 9.25 | 0.01 |
| Mental component | 4.04 | 1.19 | 0.28 | 9.63 | 0.01 |
| Spouse’s job | 1.25 | 0.96 | 0.06 | 1.25 | 0.11 |
| Spouse’s education | 0.85 | 0.55 | 0.08 | 0.36 | 0.28 |
| Parents’ death | 0.97 | 0.88 | 0.07 | 1.09 | 0.09 |
| Family size | 1.02 | 0.78 | 0.05 | 0.96 | 0.17 |
| Intake of contraceptive drugs | 0.96 | 0.61 | 0.08 | 0.81 | 0.32 |
| Current gestation | 0.88 | 0.36 | 0.01 | 0.33 | 0.72 |
Table 4.
Direct Effect, Indirect Effect, and Total Effect of Independent Variables on Nurses’ Depression Working In Ilam Hospitals
| Variables | Direct Effect | P Value | Indirect Effect | P Value | Total Effect |
|---|---|---|---|---|---|
| Age | 0.16 | 0.01 | (0.13 × 0.28) + (0.13 × 0.3 × 0.24) | 0.02 - 0.01 a | 0.21 |
| Overtime | 0.12 | 0.04 | (0.24 × 0.15) | 0.03 | 0.16 |
| Night shift | 0.18 | 0.03 | (0.24 × 0.12) | 0.03 | 0.21 |
| Marital status (married/single) | 0.25 | 0.02 | (0.35 × 0.28) + (0.35 × 0.3 × 0.24) | 0.01 - 0.02 a | 0.37 |
| History of depression | 0.07 | 0.01 | - | - | 0.07 |
| Sex | - | - | (0.12 × 0.28) + (0.12 × 0.3 × 0.24) | 0.02 - 0.1 a | 0.04 |
| Physical component | 0.24 | 0.01 | - | - | 0.24 |
| Mental component | 0.28 | 0.01 | (0.3 × 0.24) | 0.01 | 0.35 |
a The P values related to first and second the indirect effects, respectively.
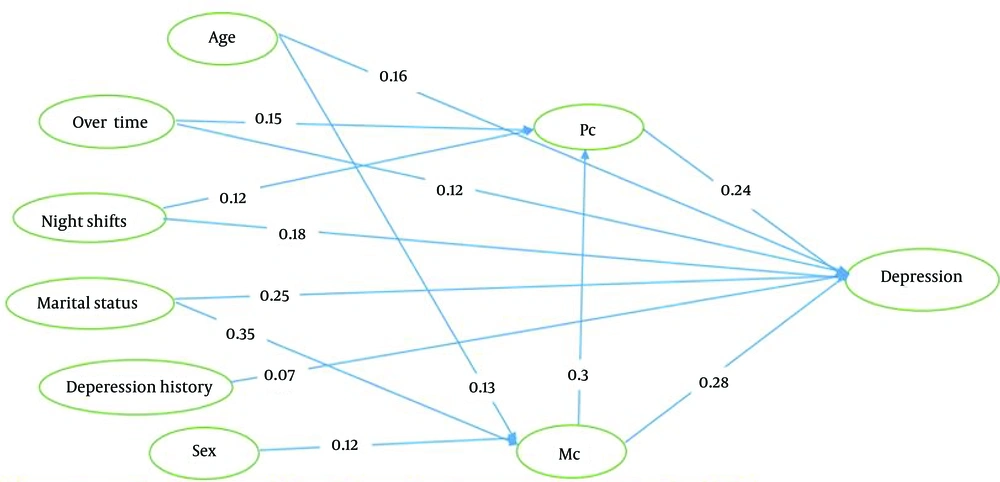
Figure 1.
Path Analysis Model of Depression in Nurses in Hospitals of Ilam
5. Discussion
We found that the main factor contributing to depression are mental and physical components of nurses, marital status (married compared to single), night work hours, overtime, and history of depression among nurses whose direct effect outruns their indirect effect (through physical and mental components).
Mental component plays an essential part in depression as better mental health gives rise to increase in trust and cohesion and prevent depression (3, 4). However, compared to other jobs, nursing profession sets nurses up for numerous high-risk factors such as emotional issues related to the patient, arduous conditions of work, particularly in sections like CCU, ICU, and pediatric section, long working hours, night shifts, heavy workload which in turn increases stresses, depression, and emotion-related problems (1, 20). According to epidemiological studies, psychological factors at work setting play a pivotal role in developing depression. Nurses are exposed to high level of stress which causes depression in them (3, 5, 11).
Previous studies found a significant relationship between marriage and depression which is in accord with our findings (3, 5). Depression is found more in single people as married couples have a purposeful joint life and hopefully attempt to improve it; therefore, married nurses as opposed to single ones experience less, risk factors contributing to depression (21).
Long and irregular night shifts hours negatively affect nurses’ physical and psychological aspects, personal and social life, performance and efficiency. They are contributing factors to depression among nurses. Portela et al. found that there is a relationship between night shifts and nurses’ depression (22). Shifts can cause physical and psychological after-effects resulting in a reduction in people’s efficiency and capability of doing work. Depression as an after-effect of night shifts can lead to nurses’ low efficiency. A lot of research have shown the correlation between depression and shifts, especially night shifts (6, 22, 23). As shown by Ruggiero et al., night shifts can develop or even exacerbate sleep disorder, and on the other hand, there is a relationship between sleep disorder, affective disorder, and depression (23), so a direct relation exists between increased working hours and depression, which is consistent with our findings (24, 25).
As we found, there is a relationship between sex and nurse’s depression as depression has been revealed to be more common in women than men. According to research conducted in the U.S. and Europe, about 9% - 21% of women and 5% - 12% of men go through depression in their life span. Baba et al. found that there is a significant relationship between depression and nurses’ sex which is in accord with our findings (3, 26). This difference is probably due to more emotionally engagement of female nurses as well as their hormonal differences (26, 27). Rovner et al. found in their study that there is a significant relationship between nurses’ age and depression, which is similar with findings of the present study (28).
Evaluating anxiety and depression among nurses, Teresi et al. argued that working hours, education, number of children, and their age are the main factors related to the nurses’ depression, but no relationship was found between the nurses’ gender and depression (29). It seems that with increasing age, due to decreased energy and more engagement, people’s social interaction and communication accordingly decline and their physical problems increase which may explain the relationship between age and depression, as physical and psychological issues are intertwined (23, 25, 29).
Mental component is a factor affecting depression as better mental health can give rise to increase in trust and cohesion and prevent depression, thus, it is essential to make plans for people’s psychological improvement and nurses, in particular. Promoting mental health is considered the index of social system efficiency which is, in practice, measured through the appraisal of people’s life in community. Policy makers and planners should promote nurses’ quality of life with the available resources. Given the psychological and physical after-effects of night shifts as a contributing factor to depression, careful plans are necessary for reducing night shifts hours. Nurses’ physical health is also an important factor in depression as the better a nurse’ physical health, the lower the incidence of depression. In this regard, focusing on physical health through a healthy life style could be helpful. Direct effects of quality of life (mental and physical components), marital status, night shifts, and overtime are important findings yielded from path analysis which makes it essential for policy makers and health care officials to closely concentrate on them. Further research can help scrutinize the relationship between depression and quality of life among nursing community.