1. Background
Anemia is a global health problem with socioeconomic consequences in both low- and high-income countries. Anemia may occur due to bleeding, reduced production of red blood cells (RBCs), chronic diseases, cancer cell infiltration into bone marrow, and hemolysis (1). Exercise-induced anemia is characterized by an increase in plasma volume in response to endurance exercises, deficiency in iron-regulating hormone regulation, and mechanical destruction of erythrocytes (2). Besides, other factors such as hemodilution, exercise-induced oxidative stress, hematuria, gastrointestinal bleeding, iron deficiency, and iron loss through sweat pores are all associated with exercise-induced anemia. Due to the rupture and destruction of erythrocytes during heavy exercise, hemolysis has been suggested as a mechanism for exercise-induced anemia. Studies indicate that exercise-induced anemia leads to an increase in free hemoglobin (Hgb), reticulocyte, and ferritin levels and a reduction in haptoglobin (3). Changes in rheology during endurance exercise can alter the structure and function of RBCs (4). On the other hand, foot-strike’s mechanical damage has been accepted as the major cause of hemolysis during jumping (5).
Short- and long-term exercise can cause changes in blood hematology (6). In this context, it has been shown that one bout of cycling (four sets at maximum power for 30 seconds) can lead to increased levels of RBCs, white blood cells (WBC), Hgb, and hematocrit (Hct), as well as reduced levels of plasma volume (PV) (7). Besides, an increase in the number of RBC, WBC, Hct, Hgb, platelets (PLT), the mean corpuscular volume (MCV), and the mean corpuscular hemoglobin (MCH) has been revealed after four sets of the Wingate anaerobic test (8). Despite the non-significant change in RBC, Hct, Hgb, lymphocyte (Lym), and eosinophil (Eos) levels, a significant increase in leukocytes and neutrophils (Nue) has been reported after 100-km ultra-marathon running under freezing conditions (9). Moreover, two sessions of running and cycling at an intensity corresponding to 75% peak oxygen uptake have been shown to increase plasma-free hemoglobin in male triathletes, although the increase was fourfold greater after running (5). Recently, a statistically significant drop has been demonstrated in RBC count, Hbg, Hct, and MCH immediately after a 24-h ultra-marathon race in runners (10). In the context of exercise training, it has been revealed that RBC count and Hgb declined after four weeks of intensified training in endurance-trained cyclists (11). Furthermore, a significant reduction in Hct, Hgb, and RBC count and an increase in MCV and PV have been reported after four-week progressive heavy cycling in untrained males (12). In contrast, long-term aerobic exercise training at an intensity of about 50% maximal heart rate made no significant change in RBC, WBC, Hgb, Hct, MCV, MCH, and PLT levels in underweight, normal, and overweight women (13).
Rope jumping is performed by children as fun (14). It can be performed regardless of time and location, or the number of people practicing it at one time (15). The beneficial effects of jump rope training on cardiovascular endurance, flexibility, and muscular strength has been demonstrated. Both arm and leg muscles get practiced during rope jumping (14). Rope jumping exercise can also improve coordination, balance, and speed in lower-body limbs (16). Because of its nature, foot-striking is a frequent phenomenon during rope jumping. On the other hand, Telford et al. reported that foot-strike is the major cause of hemolysis during running (5). Furthermore, Lippi et al. highlighted foot-strike-induced hemolysis after a 60-km ultra-marathon (17). In reality, one theory proposed for hemolytic anemia concerns foot-striking on the ground. Rope jump exercise training (RJET) is performed with frequent foot strikes on the ground. Besides, the force of foot-striking in obese children appears to be greater than that of normal-weight children (18). To the best of our knowledge, the effects of RJET on hematological parameters have not been well-examined among obese adolescent boys so far.
2. Objectives
The present study aimed to investigate the possible effects of RJET on hematological parameters involved in hemolysis.
3. Methods
3.1. Participants
In this experimental study, 35 male obese adolescents with a mean age of 13.40 ± 1.09 years from Bojnord, Iran, volunteered to participate as notified via advertisement. After reporting the benefits and risks, 20 subjects completed the present study. The number of subjects in this study was selected based on the studies conducted in this field (13). There was no acute or chronic diseases that would limit rope jumping among the participants. The subjects did not have asthma, allergic rhinitis, or respiratory diseases that might influence immunological parameters. Moreover, they had no rope jump experience. As determined by the Baecke questionnaire (19), they were inactive without any regular exercise during last year. The study procedures were approved by the institutional ethical committee for human use (IR.IAU.BOJNOURD.REC.1399.003), which followed the 1975 Declaration of Helsinki, as revised in 1996. The parents of subjects signed a consent form after being informed orally about the aims and risks of the research project. Finally, using the simple randomization method, the subjects were assigned into equal groups of control (C) and intervention (RJET). The participants’ characteristics are shown in Table 1.
Table 1.
Participants’ Characteristics
| Variables | Group | Inter-group Differences (P Value) | |
|---|---|---|---|
| C (n = 10) | RJET (n = 10) | ||
| Age (y) | 13.50 ± 1.08 | 13.30 ± 1.15 | 0.695 |
| Weight (kg) | 67.56 ± 11.61 | 62.93 ± 8.60 | 0.324 |
| Height (cm) | 156 ± 7.91 | 153.40 ± 8.90 | 0.499 |
| BMI (kg/m2) | 27.58 ± 2.74 | 26.65 ± 1.48 | 0.361 |
Abbreviations: BMI, body mass index; C, control; RIJT, rope jump exercise training.
3.2. Measurement of Body Mass Index
Since measurement of body mass index (BMI) changes with age, we calculated the BMI centile for each child. As per the stipulations of the American Centers for Disease Control and Prevention, this study considered obesity as a BMI above the 95th percentile (19). Therefore, a standard digital anthropometric scale and wall-mounted stadiometer (Jawad Al-A’emeh Hospital, Bojnord, Iran) were used to determine weight and height, respectively. Body mass index was calculated as the body mass divided by the subject’s squared height. Adolescents were asked not to consume foods before bodyweight assessment (19).
3.3. RJET Protocol
The RJET schedule is summarized in Table 2. Subjects in the RJET group performed simple rope jumping for eight weeks (three days a week) in a Sports Hall in Bojnord, Iran. The exercise intensity was controlled by increasing the duration and number of jumps per minute in the RJET group (19). Subjects were familiarized with rope jumping for two weeks. Warm-up and cool-down were performed for 10 minutes before and after any RJET session. Subjects in the C group were inactive and did not participate in any exercise training during the protocol.
Table 2.
Schedule of Rope Jumping for the RJET Group
| Week | No. of Sets | Jumping (min)/Rest Duration (sec) | Jumping Per Minute |
|---|---|---|---|
| 1 | 20 | 1/30 | 40 - 50 |
| 2 | 20 | 1/30 | 50 - 60 |
| 3 | 15 | 1.5/30 | 50 - 60 |
| 4 | 10 | 2.5/30 | 60 - 70 |
| 5 | 8 | 3/60 | 70 - 80 |
| 6 | 6 | 4/60 | 80 - 90 |
| 7 | 6 | 4/60 | 90 - 100 |
| 8 | 5 | 5/60 | 100 - 110 |
3.4. Sample Collection
In this study, 5 mL of fasting blood samples (12 hours) were collected from participants’ antecubital vein before and 48 hours after the last RJET session in Jawad Al-A’emeh Hospital of Bojnord from 8:00 a.m. to 9:00 a.m. Blood samples were obtained by a skilled and qualified technician. Postural changes can influence hematocrit concentration and blood volume. Therefore, all blood samplings were performed in sitting positions (9). The blood samples were kept in tubes containing EDTA and were analyzed on the same day.
3.5. Hematological Determinations
Quantitative determinations of RBC, Hct, Hgb, MCV, mean cell hemoglobin concentration (MCHC), mean cell hemoglobin (MCH), red cell distribution width (RDW), WBC, Lym, neutrophil (Neu), monocyte (Mon), eosinophil (Eos), basophil (Bas), platelets (PLT), plateletcrit (PCT), mean platelet volume (MPV), and platelet distribution width (PDW) obtained by venipuncture were performed using a fully automated hematology cell counter in Jawad Al-A’emeh Medical Laboratory of Bojnord. Finally, the change of plasma volume (PV) was calculated according to the Dill and Costill equation as follows:
3.6. Statistical Analysis
Data were analyzed using the commercial SPSS software V.16. (IBM Corporation, Chicago, USA). The normality of data distribution was determined using the Shapiro-Wilk test. Independent t-test and Mann-Whitney U test were used to examine the inter-group differences for parametric and nonparametric data, respectively. Besides, paired t-test and Wilcoxon test were used to examine the intra-group differences for parametric and nonparametric data, respectively. The results were expressed as mean ± standard deviation, and the level of significance was set at P < 0.05.
4. Results
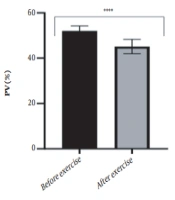
According to the anthropometric and demographic measurements, the results indicated no significant differences between age (P = 0.695), height (P = 0.499), weight (P = 0.324), and BMI (P = 0.361) in C and RJET groups. Table 3 shows the erythrocyte variables before and after RJET in C and RJET groups. No significant difference in RBC, Hgb, Hct, MCV, MCH, MCHC, and RDW was observed between the two groups after the eight-week jump exercise training protocol. In addition, there was no statistically significant difference between the RJET (0.11 ± 4.22 %) and C (-0.30 ± 1.33 %) groups regarding PV (P = 0.773).
Table 3.
The Effect of Eight-Week RJET Protocol on Erythrocytes Parameters in Adolescent Obese Boys
| Erythrocytes Variables and Groups | Before | After | Intra-group Differences (P Value) | Inter-group Differences (P Value) |
|---|---|---|---|---|
| RBC (106/μL) | 0.860 | |||
| C | 5.07 ± 0.33 | 5.07 ± 0.36 | 0.999 | |
| RJET | 5.10 ± 0.27 | 5.10 ± 0.33 | 0.940 | |
| Hgb (g/dL) | 0.628 | |||
| C | 13.52 ± 0.84 | 13.50 ± 0.91 | 0.764 | |
| RJET | 13.46 ± 0.72 | 13.34 ± 0.47 | 0.470 | |
| Hct (%) | 0.278 | |||
| C | 39.72 ± 1.68 | 39.88 ± 1.15 | 0.573 | |
| RJET | 39.42 ± 1.84 | 39.24 ± 1.38 | 0.707 | |
| MCV (fL) | 0.427 | |||
| C | 78.55 ± 4.17 | 78.90 ± 6.09 | 0.848 | |
| RJET | 77.26 ± 3.09 | 77.09 ± 3.36 | 0.323 | |
| MCH (pg) | 0.334 | |||
| C | 26.88 ± 1.42 | 26.89 ± 1.40 | 0.832 | |
| RJET | 26.36 ± 1.57 | 26.23 ± 1.56 | 0.152 | |
| MCHC (g/dL) | 0.608 | |||
| C | 34.28 ± 1.51 | 34.24 ± 1.31 | 0.763 | |
| RJET | 34.11 ± 0.86 | 33.99 ± 0.74 | 0.388 | |
| RDW (fL) | 0.165 | |||
| C | 40.22 ± 2.99 | 39.61 ± 2.44 | 0.393 | |
| RJET | 40.50 ± 1.58 | 40.99 ± 1.76 | 0.514 |
Abbreviations: C, control; RJET, rope jump exercise training; RBC, red blood cell count; Hgb, hemoglobin; Hct, hematocrit; MCV, mean corpuscular volume; MCH, mean corpuscular hemoglobin; MCHC, mean corpuscular hemoglobin concentration; RDW, red distribution width.
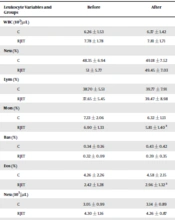
The changes in leukocyte measurements are displayed in Table 4. There was no statistically significant difference between the RJET and C groups regarding WBC, percentage of Neu, percentage of Lym, percentage of Mon, percentage of Bas, percentage of eosinophil, Neu count, Lym count, Mon count, Bas, and Eos. Regarding the effect of time, a significant reduction was observed for Mon count and percentage in the RJET group. However, Eos count and percentage significantly increased after exercise training in the RJET group.
Table 4.
The Effect of the Eight-Week RJET Protocol on Leukocytes Parameters in Adolescent Obese Boys
| Leukocyte Variables and Groups | Before | After | Intra-group Differences (P Value) | Inter-group Differences (P Value) |
|---|---|---|---|---|
| WBC (103/μL) | 0.123 | |||
| C | 6.26 ± 1.53 | 6.37 ± 1.42 | 0.703 | |
| RJET | 7.78 ± 1.78 | 7.81 ± 1.71 | 0.942 | |
| Neu (%) | 0.935 | |||
| C | 48.35 ± 6.94 | 49.18 ± 7.52 | 0.279 | |
| RJET | 51 ± 5.77 | 49.45 ± 7.03 | 0.506 | |
| Lym (%) | 0.936 | |||
| C | 38.70 ± 5.51 | 39.77 ± 7.91 | 0.403 | |
| RJET | 37.65 ± 5.45 | 39.47 ± 8.98 | 0.482 | |
| Mon (%) | 0.561 | |||
| C | 7.33 ± 2.06 | 6.32 ± 1.13 | 0.051 | |
| RJET | 6.90 ± 1.33 | 5.81 ± 1.40 a | 0.022 | |
| Bas (%) | 0.820 | |||
| C | 0.34 ± 0.16 | 0.43 ± 0.42 | 0.492 | |
| RJET | 0.32 ± 0.09 | 0.39 ± 0.35 | 0.556 | |
| Eos (%) | 0.082 | |||
| C | 4.26 ± 2.26 | 4.58 ± 2.15 | 0.403 | |
| RJET | 2.42 ± 1.28 | 2.96 ± 1.32 a | 0.018 | |
| Neu (103/μL) | 0.067 | |||
| C | 3.05 ± 0.99 | 3.14 ± 0.89 | 0.506 | |
| RJET | 4.30 ± 1.16 | 4.26 ± 0.87 | 0.920 | |
| Lym (103/μL) | 0.254 | |||
| C | 2.41 ± 0.60 | 2.53 ± 0.76 | 0.498 | |
| RJET | 2.70 ± 0.67 | 2.88 ± 0.56 | 0.419 | |
| Mon (103/μL) | 0.329 | |||
| C | 0.46 ± 0.12 | 0.38 ± 0.07 | 0.057 | |
| RJET | 0.52 ± 0.11 | 0.42 ± 0.12 a | 0.012 | |
| Bas (103/μL) | 0.699 | |||
| C | 0.021 ± 0.011 | 0.022 ± 0.016 | 0.760 | |
| RJET | 0.020 ± 0.010 | 0.020 ± 0.014 | 0.957 | |
| Eos (103/μL) | 0.879 | |||
| C | 0.23 ± 0.16 | 0.22 ± 0.21 | 0.798 | |
| RJET | 0.21 ± 0.17 | 0.28 ± 0.21 a | 0.015 |
Abbreviations: C, control; RJET, rope jump exercise training; WBC, white blood cells; Neu, neutrophil; Lym, lymphocyte; Mon, monocyte; Bas, basophil; Eos, eosinophil.
a Indicates significant differences from baseline.
Table 5 shows the platelet variables before and after RJET in C and RJET groups. Regarding platelet parameters, no significant differences were obtained for PLT, MPV, PDW, and PCT between C and RJET groups at the end of the exercise training protocol.
Table 5.
The Effect of the Eight-Week RJET Protocol on Platelet Parameters in Adolescent Obese Boys
| Platelet Variables and Groups | Before | After | Intra-group Differences (P Value) | Inter-group Differences (P Value) |
|---|---|---|---|---|
| PLT (103/μL) | 0.471 | |||
| C | 290 ± 49.01 | 310 ± 62.01 | 0.959 | |
| RJET | 300 ± 50.97 | 294 ± 54.17 | 0.357 | |
| MPV (fL) | 0.236 | |||
| C | 8.62 ± 0.90 | 8.57 ± 0.90 | 0.815 | |
| RJET | 8.25 ± 0.96 | 8.22 ± 0.80 | 0.899 | |
| PDW (fL) | 0.123 | |||
| C | 15.70 ± 1.55 | 15.20 ± 3.50 | 0.999 | |
| RJET | 15.71 ± 0.44 | 15.78 ± 0.38 | 0.140 | |
| PCT (%) | 0.085 | |||
| C | 0.266 ± 0.03 | 0.261 ± 0.03 | 0.545 | |
| RJET | 0.240 ± 0.04 | 0.234 ± 0.03 | 0.479 |
Abbreviations: PLT, platelet count; MPV, mean platelet volume; PDW, platelet distribution width; and PCT, plateletcrit.
5. Discussion
Several studies have demonstrated an improvement in coordination, balance, agility, rhythm, muscular endurance, muscular strength, body composition, flexibility, and cardiovascular function after RJET (15, 20). Some other aspects of RJET were investigated in the current study. Our findings revealed that eight weeks of RJET had no adverse effect on hemolytic anemia and platelet parameters. RJET only caused a significant reduction in the count and percentage of monocyte from among all immunological parameters.
The lack of significant change in erythrocytes parameters in the current study is consistent with other studies that demonstrated no dramatic changes in RBC, Hgb, Hct, MCV, MCHC, and MCH after long-term aerobic training program in underweight, normal weight, and overweight women (13). In contrast, our findings are inconsistent with studies that revealed an increase in Hgb, RBC, Hct, MCV, and MCH after sprint interval training in competitive cyclists (7) and sedentary subjects (8). Decreased PV and Hct, induced by acute training, is attributed to dehydration and increased capillary hydrostatic pressure (7, 8). In one study, Halson et al. reported that six weeks of intensified training to overreaching could result in reduced levels of RBC and Hgb in well-trained cyclists (11). It has been demonstrated that the expression of iron absorbance proteins reduces after intensive training that affects Hgb formation (21). Moreover, the ratio of iron absorbance in athletes is lower than in non-athlete subjects (22). However, the current study was conducted at moderate intensity on sedentary participants. Therefore, the differences in exercise intensity and the physical fitness levels of subjects can be the reason for the discrepancy between the results of the current study and other ones.
Moreover, Green et al. reported a reduction in Hct, Hgb, and RBC, and an increase in PV and MCV during four weeks of progressive heavy training in untrained males. However, from week 5 to week 8, no further changes in Hgb, RBC, and MCV were found, and the mean cell Hgb and Hct returned to pre-training levels (12). According to Green et al., the reduction in hematologic parameters may be due to an increase in PV levels (12). In the present study, the blood samples were collected after eight weeks of RJET without dramatic changes in PV levels.
There is a substantial body of evidence demonstrating an increase in WBC and Neu following acute high-intensity interval training (8) and 100-km ultra-marathon under freezing conditions (9). Evidence also indicates that high-intensity interval exercise can induce a significant increase in total leukocytes and Mon in lean subjects, while both moderate- and high-intensity interval exercise may enhance total leukocytes, Mon, and Lym in overweight–obese individuals (23). Evidence has also shown that mechanisms underlying exercise attributed to immune function alteration are associated with several factors, such as neuroendocrine system stimulations (catecholamines, cortisol), metabolic factors (i.e., carbohydrate, antioxidants, or prostaglandin), hemodynamic factors, and shear stress, among others (24). In contrast, the results of long-term chronic exercise training on immune parameters in obese adolescents are less controversial. Regular exercise improves the function of the immune system.
However, more than one part of the immune system may be suppressed by exhaustive/excessive training (24). In reality, long-term intense exercise training may result in a decline in the function of innate immune cells in response to acute conditions, contributing to an increased risk of infection (25). In this regard, the results of the present study demonstrated that RJET had no dramatic effect on WBC, Neu, and Lym, while it decreased the percentage and total count of Mon in healthy obese adolescent boys. Our findings are consistent with a study that revealed a non-significant change in WBC count after 12 weeks of aerobic exercise training at moderate intensity in healthy female smokers (26) and underweight, normal-weight, and overweight women (13). In contrast, higher circulating leukocytes in women with polycystic ovary syndrome is shown to reverse upon long-term aerobic exercise regimens (27). Besides, a 12-week walking program in the evening (30 min/day, 5 days/week, at an intensity corresponding to 3 to 6 METs) resulted in a reduction in WBC count in sedentary patients with coronary artery disease (28). It seems that part of the contradiction in the results is related to the training period and the pathological conditions of the subjects. In this context, a six-month aerobic training reduces Neu counts and total WBC in a dose-dependent manner in postmenopausal women. Moreover, total WBCs and Neu reduce more in women with high baseline WBC counts (29).
Circulating blood platelets play an important role in the physiological process of hemostasis. It has been documented that exercise training alters the parameters involved in hemostatic, including the number, size, and function of platelets (30). In addition, in a review study, Posthuma et al. reported that the hemostatic profile is prominently affected by the intensity of training and is increased more after high- than low-intensity training, as shown by an increase in platelet number and coagulant activity (31). These documents are inconsistent with the increased risk of exercise-induced thrombotic events following high-intensity exercise training. The increase in platelet count after exercise is the result of the release of fresh platelets from the vascular bed of the spleen and bone marrow in response to increased epinephrine and strong splenic contraction (31). The mechanism of the increase in the MPV variable after exercise training is not yet known but may be due to the secretion of large young platelets from the spleen into the bloodstream (30, 31). However, no significant changes in platelet variables (i.e., PLT, MPV, PDW, and PCT) were observed in the present study, suggesting no adverse effect of exercise-related thrombotic events. Our findings are consistent with another study that demonstrated no dramatic change in PLT in underweight, normal-weight, and overweight participants after long-term aerobic training (13).
5.1. Conclusions
The results of the present study showed that striking induced by RJET had no adverse effect on hemolytic anemia in obese adolescent boys.