1. Background
Diabetes mellitus (DM) is the most common metabolic disease in the world. It is caused due to inadequate supply of insulin and inadequate response of tissues to insulin which is the reason for the increase in blood sugar level leading to micro-vascular and macro-vascular effects (1). About 15 - 25% of global populations suffer from DM (1, 2). In Iran, 7.7% of adults in the age range of 25 - 64 years are suffering from the disease, and the number is increasing (3). This type of diabetes is chronic and leads to acute chronic complications. The most acute complication is diabetic ketoacidosis (DKA); other complications include nephropathy, coronary artery disease, and vascular diseases (1). The risk of having diabetic foot ulcers (DFUs) is higher in patients suffering from the disease for more than ten years, as well as those having heart diseases, vascular, and renal diseases (4). DFUs can be created due to neuropathy and peripheral vascular disease in the lower limbs (5). According to the studies in Iran, 20% of diabetic hospitalized patients have foot problems (6). In the United States, 33% of diabetes treatment budget was spent on DFU in 2007 (7). The best treatment for DFU is prevention and to train patients how to prevent it; however, DFU is very common (8). The treatment includes blood pressure control, avoiding body pressure on the ulcer, wound dressing, infection treatment, vascular reconstruction, and amputation (8, 9). Treating DFU is an important problem in vascular surgery (10). Different methods are used to treat DFUs, including negative pressure wound therapy, external shock wound therapy, treatment using honey, phenytoin, tretinoin, ultrasound, becaplermin gel, topical mevastatin, and naltrexone. However, none of these methods can fully treat DFUs (11-14). Treating DFUs successfully depends on prescribing proper antibiotics, wound debridement, and blood pressure control. Prescribing antibiotics for DFUs as a means of preventing infection does not help, and it is used whenever infection exists (15). Oxytetracycline is a type of antibiotics which is widely used to treat infections. It can be used in forms of capsule, eye drops, and oral suspension (16). Tetracycline spray is also used in veterinary to treat cutaneous infections, to recover open wounds, to prevent infection after surgery, and to treat skin disease infections (17). Oxytetracycline has antibacterial effects, and it affects the activities of mammalian collagenase. Using oxytetracycline systematically shows a decrease in activities of collagenase and an increase in recovering ulcers (18). Topical antibiotics can be used to prevent the side effects and to treat DFUs when it is concentrated on the ulcer and used systematically (19). DFUs directly affect the patients’ quality of life (QOL) and create serious problems for healthcare system (20). On the other hand, DFU is the reason for 2.3% of non-traumatic amputations.
2. Objectives
Since there is no certain treatment for DFU, this study aimed to evaluate the effects of spraying tetracycline on DFUs in the Vascular Surgery Ward of Imam Reza Hospital in Mashhad, Iran in 2010 - 2011.
3. Methods
This double-blind, randomized clinical trial was carried out on 60 diabetic patients hospitalized in the Vascular Surgery Ward of Imam Reza Hospital in Mashhad, Iran, in 2010 - 2012. The statistical analyst and the person who checked the graphics were not informed about the patient’s group. The ethics committee of Mashhad University of Medical Sciences approved the study, and it was registered in the Iranian Registry of Clinical Trials (reg. no: IRCT201112208472N1). All patients signed a written informed consent form. Based on previous studies, the number of patients was calculated as 30 in each group. Finally, considering the possible loss, 35 patients were chosen for each group. All the patients were suffering from DFU and were in the Vascular Surgery Ward of Imam Reza Hospital.
The inclusion criteria were: Willingness to participate in the study; having DFUs on toes; having sutured ulcers that could be recovered; amputation wounds; having wounds which fell into Wagner classification I and II; no history of severe renal perfusion disorder; and no history of severe tissue perfusion disorder (ankle/brachial blood pressure index (ABI) < 0.5). The study tools included a demographic questionnaire, a researcher-made DFU questionnaire, and the Wagner and Texas classifications of DFU (21). The patients were divided into two groups by random numbers table: 1 - 30 control group (routine care) and 31 - 60 intervention group (routine care + oxytetracycline spray).
Some trained nurses from the vascular surgery ward were responsible for the two groups of patients. First, the patients were asked about their age, sex, other possible illnesses, duration of the disease, DFU record, and smoking status. Then, the patients underwent some examinations, including neuropathy (testing needle pain), monofilament (if available), a 128-megahertz tuning fork vibration test, ischemia (capillary refill and arterial insufficiency), deformity, light touch sense, moving the patients’ toes up and down, checking the lower limb to see if there are any dryness and swelling, the size of the wound, determining the type of wound (using Wagner classification), purulent discharge, wound smell, erythema and edema around the wound, and the presence of subcutaneous crepitus and necrotic tissue. Height and weight of the patients were measured, and body mass index (BMI) was calculated. Another series of tests, such as ESR, CRP, FBS, BUN, CR, and CBC were requested, and an electric camera (Dino-lite-413) was used to take photos of the wounds with an enlargement of ten. All the patients received the routine DFU treatments. If it was necessary, they were given some kinds of antibiotics, such as clindamycin capsule (300 mg/6h) + ciprofloxacin tablet (500 mg/12h). Suitable food and drug diets were used to control the blood glucose, and if debridement was necessary, the patient was referred to the surgery room. All the patients belonged to classes 1 and 2, according to the Wagner classification.
In the intervention group, in addition to the common treatment of DFU, the patients received oxytetracycline spraying (containing 4.2 gr oxytetracycline hydrochloride, 420 mg gentian violet, and 210 mL excipients and propellant qs) two times a day from a distance of 15 - 20 cm locally at ulcer area (totally, 42 puffs in three weeks) and visited once a week. Each time, the wounds were checked in terms of erythema and edema around the wound, purulent discharge, and wound smell, and then a photo was taken of the wound and analyzed by software. After the patients were discharged from the hospital, they returned to the research center to have their wounds checked. After three weeks, the recovery process of the wounds between the two groups was compared and analyzed. The analyzed items included the wound size, purulent discharge, erythema and edema around the wounds, and the smell of the wounds. All examinations were done in a similar way and in the same laboratory. The data were analyzed using the statistical package for social sciences (SPSS) software version 11.5 (SPSS Inc., Chicago, IL, USA). For demographic information, we used descriptive statistics tests and compared the difference of treatment between two groups in the case of distribution (normal or abnormal) and based on parametric statistic tests (dependent and independent t-test) and non-parameter test Mann-Whitney U test. To investigate the quality variables, the chi-square test was used. A P-value less than 0.05 was considered as statistically significant.
4. Results
Out of a total of 75 patients, four were excluded from the study due to not meeting the inclusion criteria, four due to unwillingness to participate in the study, and seven due to incomplete questionnaires. Finally, 60 patients (30 in each group) were included in the study (Figure 1).
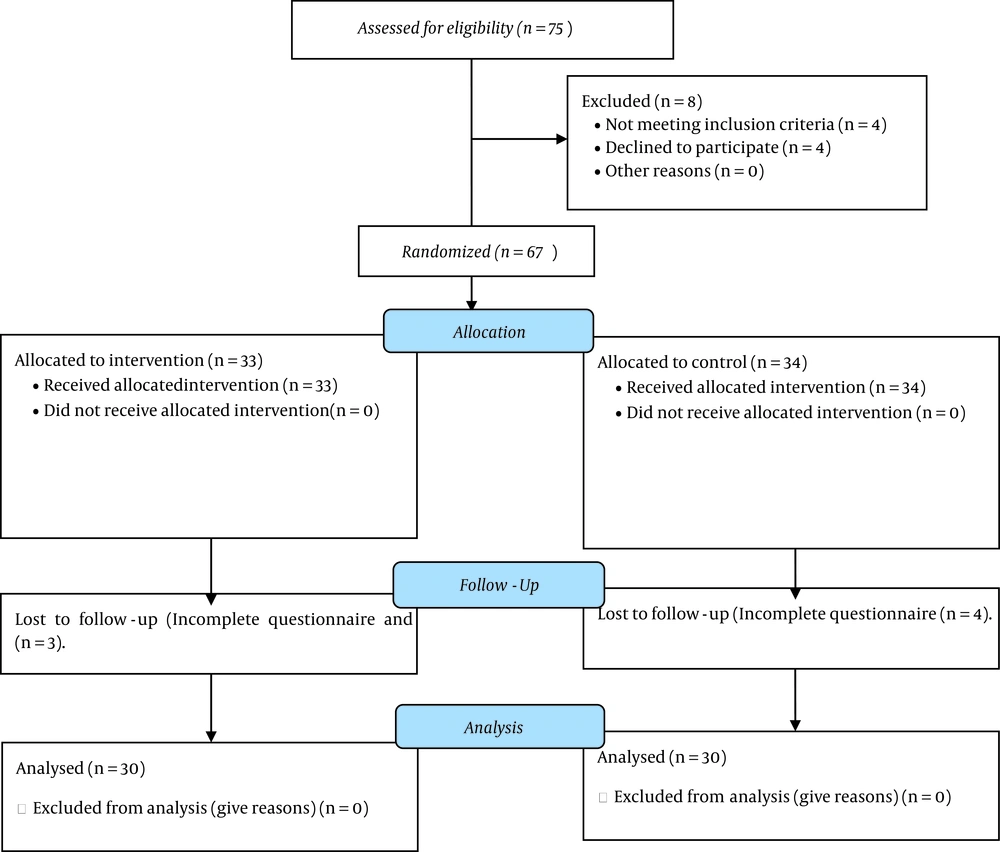
Figure 1.
The participants’ flow diagram
The patients were studied at two stages: Before the intervention vs. during three weeks of intervention. Table 1 shows the demographic characteristics of all participants. The age average was 61.63 ± 9.5 in the intervention group and 61.06 ± 6.68 in the control group (P > 0.05). The majority of patients (68.3%) were male. Table 2 shows the information regarding the reasons of DFU. The most common complication among the patients was ischemic heart disease (IHD), which was equal in both groups. Table 2 shows the information about the clinical tests before the study.
Table 1.
Comparison of the Demographic Characteristics of Participants a
| Variables | Intervention (N = 30) | Control (N = 30) | Test | Test Result P-Value |
|---|---|---|---|---|
| Age (y) | 61.63 ± 9.57 | 61.06 ± 6.68 | t-test | 0.791 |
| Gender | Chi-squared test | 0.781 | ||
| Male | 21 (70) | 20 (66.7) | ||
| Female | 9 (30) | 10 (33.3) | ||
| Weight (kg) | 72.56 ± 8.00 | 71.63 ± 7.81 | t-test | 0.649 |
| Height (cm) | 166.53 ± 7.57 | 169.30 ± 8.53 | t-test | 0.189 |
| BMI (kg/m2) | 25.97 ± 2.29 | 25.02 ± 2.02 | t-test | 0.094 |
| CVA (yes/no) | 4 (13.3) | 3 (10.0) | Chi-squared test | 0.688 |
| MI (yes/no) | 5 (16.7) | 10 (33.3) | Chi-squared test | 0.126 |
| Hypertension (yes/no) | 14 (46.7) | 7 (23.3) | Chi-squared test | 0.058 |
| Hyperlipidemia (yes/no) | 6 (20) | 8 (26.7) | Chi-squared test | 0.542 |
| Smoking (yes/no) | 13 (43.3) | 14 (46.7) | Chi-squared test | 0.795 |
| History of foot ulcer (yes/no) | 9 (30) | 9 (30) | Chi-squared test | 1.000 |
Abbreviations: CVA, cerebrovascular accident; MI, myocardial infarction.
a Values are expressed as No. (%) or mean ± SD.
Table 2.
Information About the Laboratory Tests Before the Intervention
| Factors | Groups | Independent t-test P-Value | |
|---|---|---|---|
| Intervention | Control | ||
| Blood Tests | |||
| FBS (mg/dL) | 160.3 ± 57.82 | 147.4 ± 46.5 | 0.34 |
| BUN (mg/dL) | 25.26 ± 8.42 | 27.03 ± 8.81 | 0.43 |
| Cr (mg/dL) | 1.13 ± 0.27 | 1.12 ± 0.2 | 0.92 |
| WBC | 8740 ± 1765.29 | 9290 ± 1664.92 | 0.21 |
| ESR (mm/hr) | 62.2 ± 45.3 | 58.2 ± 23.4 | 0.75 |
Abbreviations: FBS, fasting blood sugar; BUN, blood-urea-nitrogen; WBC, white blood cell count; ESR, erythrocyte sedimentation rate.
According to Table 2, there was no significant difference in the laboratory test results between the two groups. The average BMI among the patients in the intervention and control groups was 25.97 ± 2.29 and 25.02 ± 2.02, respectively, indicating no significant difference (P > 0.05). Table 3 shows the patients’ DFU before the intervention in both groups, indicating no significant difference (P > 0.05). Also, they were equal in terms of the grade of DFU.
Table 3.
DFU Situation and Grade in the Two Groups Before the Intervention a
| Wound Situation and Grade | Groups | Chi-squared Test | |||||
|---|---|---|---|---|---|---|---|
| Intervention | Control | ||||||
| Yes | No | Total | Yes | No | Total | ||
| Necrotic tissue | 7 (23.3) | 23 (76.6) | 30 (100) | 4 (13.3) | 26 (86.7) | 30 (100) | 0.31 |
| Granulation tissue | 3 (10) | 27 (90) | 30 (100) | 3 (10) | 27 (90) | 30 (100) | 1 |
| Wound culture | 3 (10) | 27 (90) | 30 (100) | 11 (36.7) | 19 (63.3) | 30 (100) | 0.056 |
| Wound grade I | 10 (33.3) | 20 (66.7) | 30 (100) | 9 (30) | 21 (70) | 30 (100) | 0.78 |
| Wound grade II | 20 (66.7) | 10 (33.3) | 30 (100) | 21 (70) | 9 (30) | 30 (100) | 0.8 |
a Values are expressed as No. (%).
One of the most important effects of spraying oxytetracycline on DFUs is the size of ulcers. Table 4 shows the size of DFUs before the intervention and during three weeks of intervention. Photos were taken of the wounds and then analyzed by special software.
Table 4.
Size of DFU Alternations in Different Study Phases
| Factors | Group | Independent t-test | |
|---|---|---|---|
| Intervention | Control | ||
| Size of DFU (mm2) | |||
| Before the study (base size) | 110.87 ± 38.3 | 127.12 ± 40 | 0.114 |
| Wound alteration size after 1 week | 14.90 ± 14.41 | 19.45 ± 1.35 | 0.03 |
| Wound alteration size after 2 weeks | 26.93 ± 18.86 | 23.78 ± 5.31 | 0.03 |
| Wound alteration size after 3 weeks | 41.25 ± 19.51 | 13.29 ± 7.85 | 0.01 |
a Values are expressed as mean ± SD.
As Table 4 shows, a better DFU recovery was seen in the intervention group, indicating a significant difference (P < 0.05). Also, the size of the wounds, erythema, and edema around the wound, purulent discharge, and the smell of the wounds were controlled and checked. Table 5 shows the erythema, edema around the wounds, purulent discharge, and the smell of the wounds in the two groups.
Table 5.
The Erythema, Edema Around the Wounds, Purulent Discharge, and the Smell of the Wounds in the Two Groups a
| Correlative Factors of DFU | Groups | Chi-squared Test | |||||
|---|---|---|---|---|---|---|---|
| Intervention | Control | ||||||
| Yes | No | Total | Yes | No | Total | ||
| Erythema around the wounds | |||||||
| Before the intervention | 27 (90) | 3 (10) | 30 (100) | 21 (70) | 9 (30) | 30 (100) | 0.053 |
| After 1 week | 17 (56.7) | 13 (43.3) | 30 (100) | 15 (50) | 15 (50) | 30 (100) | 0.61 |
| After 2 weeks | 11 (36.6) | 19 (63.4) | 30 (100) | 15 (50) | 15 (50) | 30 (100) | 0.34 |
| After 3 weeks | 1 (3.3) | 29 (96.7) | 30 (100) | 3 (10) | 27 (90) | 30 (100) | 0.31 |
| Edema around the wounds | |||||||
| Before the intervention | 25 (83.3) | 5 (16.7) | 30 (100) | 20 (66.7) | 10 (33.4) | 30 (100) | 0.13 |
| After 1 week | 14 (46.7) | 16 (53.4) | 30 (100) | 14 (46.7) | 16 (53.4) | 30 (100) | 1.01 |
| After 2 weeks | 7 (23.4) | 23 (76.6) | 30 (100) | 13 (43.4) | 17 (56.6) | 30 (100) | 0.11 |
| After 3 weeks | 1 (3.3) | 29 (96.7) | 30 (100) | 3 (10) | 27 (90) | 30 (100) | 0.17 |
| Purulent discharge | |||||||
| Before the intervention | 30 (100) | 0 (0) | 30 (100) | 30 (100) | 0 (0) | 30 (100) | 1.0 |
| After 1 week | 26 (86.7) | 4 (13.4) | 30 (100) | 30 (100) | 0 (0) | 30 (100) | 0.038 |
| After 2 weeks | 18 (60) | 12 (40) | 30 (100) | 28 (93.4) | 2 (6.6) | 30 (100) | 0.002 |
| After 3 weeks | 18 (60) | 12 (40) | 30 (100) | 28 (93.4) | 2 (6.6) | 30 (100) | 0.002 |
| Smell of the wounds | |||||||
| Before the intervention | 24 (80) | 6 (20) | 30 (100) | 24 (80) | 6 (20) | 30 (100) | 1.0 |
| After 1 week | 16 (53.3) | 14 (46.7) | 30 (100) | 12 (40) | 18 (60) | 30 (100) | 0.3 |
| After 2 weeks | 8 (26.6) | 12 (73.4) | 30 (100) | 10 (33.3) | 20 (67.7) | 30 (100) | 0.1 |
| After 3 weeks | 1 (3.3) | 29 (96.7) | 30 (100) | 4 (13.3) | 26 (86.7) | 30 (100) | 0.036 |
a Values are expressed as No. (%).
According to the results of this study, spraying oxytetracycline accelerated the recovery of DFU and reduced the purulent discharge.
5. Discussion
According to our results, there was a significant difference in terms of wound healing between the intervention and control groups (P < 0.05). Diabetes complications such as sensory neuropathy lead to the destruction of natural protective mechanisms of foot, and patients do not realize the DFU being formed in their feet. On the other hand, peripheral vascular disease causes a change to the blood flow of the foot surface, which creates skin cracks. There is also a deep palpation which causes an alteration in foot formation, and peripheral vascular diseases do not allow the skin cracks to recover. All these factors lead to forming DFU (11, 22, 23). The importance of treatment and prevention of DFU can be considered from different aspects. The most important step to take is prevention (9). Although a lot of money is spent on preventing DFU, therapeutic systems do not work and are not effective enough. The spread of DFU in patients under the age of 44 years is 6.5 out of 1000, and in patients over 75 years is 10.3 out of 1000. The number of hospitalized patients suffering from DFU has increased from 5.4 in 1980 to 6.9 in 2003 (7). Furthermore, 60% of non-traumatic amputations of lower limb occur in these patients, and 80% of the amputations are due to DFU (24).
We studied 60 DFU patients. In our study, there was no significant relationship between the two groups in terms of the DFU size before the intervention. After the intervention, alternation of mean and standard deviation in the first week in intervention group was 14.9 ± 14.4 mm2 and 19.4 ± 1.35 mm2 in the control group whom that there was a significant relationship (P = 0.03). The results continued during three weeks of conducting the study (P < 0.05).
Numerous studies have been conducted to find a positive effect on the recovery of DFU. Gilligan et al. and Sawaya et al. showed that becaplermin gel and topical mevastatin were effective treatments in DFU patients with various mechanisms. Becaplermin gel had a good healing with higher rates and lower amputation risks. Topical mevastatin is useful for epithelialization and angiogenesis (12, 13). However, there was no significant effect on wound infection. DFU is classified as a mild infection, and it should be treated with local antibiotics (25). No local effective drug has been produced to control the infection of DFU so far (26). Baba-Mohamadi et al. tested oxytetracycline spray and oxytetracycline ointment on animals. In this study, the recovery process of eight donkeys suffering from DFU was checked during 28 days. The findings showed that the spray was much more effective than the ointment (17). In pharmacology laboratory, oxytetracycline spray had no side effects. In another study, Ramamurthy et al. used chemically modified tetracycline (CMT2) on some diabetic mice and found that hydroxyproline in granulation tissue in non-intervention mice was less, and collagenases and gelatinases were more. The diabetic mice whose wounds were treated by CMT2 3% had an increase in wound hydroxyproline and a decrease in the activity of collagenases and gelatinases. In the diabetic mice, there was a delay in filling the wound by granulation tissue. In the diabetic mice treated by CMT2, the size of granulation tissue was bigger than the ones which were not treated. The mice which were treated with 1% or 3% CMT2 had an increase of 17 to 52% in reoptilasion compared to the mice which were not treated. It shows that CMT2 normalized the recovery in diabetic mice and can be used as an adjuvant treatment in chronic wounds (27). Our findings are consistent with some of the mentioned results. Oxytetracycline has anti-inflammatory, antibiotic, and proteolysis effects. Using systematically tetracycline has an inhibitor effect on collagenases and gelatinases, which leads to a better wound healing (28-30). Recently, an experimental study showed anti-apoptosis effects for oxytetracycline (29). In DFU, the cells necrosis and then die, but anti-apoptosis can heal the wounds. In another study by Nakao et al., oxytetracycline ointment was used on rats, which caused a better recovery (31).
5.1. Conclusions
Different treatments have been used to treat DFUs. However, most of these treatments have relative impacts, and they are complement to each other. In conclusion, in our study, spraying oxytetracycline on DFUs facilitated the process of healing. Thus, it can be used as an affordable, available, and effective method. Further studies are needed to confirm our results.