
1. Background
Periodontitis is a chronic inflammatory infectious-driven disease characterized by an exaggerated inflammatory response to pathogenic microbiota. This disease destroys periodontium, including the periodontal ligament and the alveolar bone, which, in turn, diminishes masticatory function and leads to tooth loss (1). Clinical studies have indicated a positive association between periodontitis and systemic conditions, such as low-grade inflammatory factors (2), insulin resistance (3), and blood clotting disorders (4). Moreover, some other studies revealed the probable relationship of periodontitis with dyslipidemia (5) and blood pressure (6).
Metabolic syndrome (MetS) is a collection of metabolic disorders diagnosed with insulin resistance, central obesity, dyslipidemia, high blood pressure, and chronic low-grade inflammatory state (7). This chronic and progressive condition increases the risk of type II diabetes mellitus and atherosclerotic cardiovascular disease. In addition, some patients with metabolic syndrome may exhibit pro-inflammatory and pro-thrombotic states (8). The prevalence of MetS in Iran has been reported as 24.1% - 31.0% in recent years (9). International clinical and epidemiological studies indicated a strong association between periodontal disease and MetS in several populations (10-13). Although many studies have been recently conducted to investigate this association, a limited number of studies have been carried out on the Iranian people.
While periodontitis generates chronic inflammation, the risk of cardiovascular disease decreases after the successful treatment of periodontitis in subjects with insulin resistance and dyslipidemia, as is usually the case with MetS (14). At the population level, the treatment and prevention of periodontal disease can be an efficient public health measure.
2. Objectives
The present study aimed to investigate the association between MetS and periodontitis in a group of Iranian patients. It is reported that among all MetS components, dysglycemia has the strongest relationship with periodontal disease (14). One of the minor objectives of the current study was to assess the association between periodontal diseases and metabolic syndrome in patients with metabolic syndrome without dysglycemia. Therefore, patients with diagnosed diabetes were excluded from the case group to eliminate the effect of dysglycemia.
3. Methods
This cross-sectional study was carried out on a simple random sample of 50 patients with MetS referred to the internal clinic of Imam Khomeini Hospital, Ardabil, Iran. In addition, another simple random sample of 50 individuals without MetS was selected and invited for a dental examination. This study was approved by the Ethics Committee of Ardabil University of Medical Sciences (IR.ARUMS.REC.1397.199). The Adult Treatment Panel III (ATP III) was used for the diagnoses of MetS (7). According to ATP III, the presence of MetS is confirmed if three or more of the following five criteria are satisfied: Hyperglycemia (FPG): Serum glucose level ≥ 110 mg/dL (6.1 mmol/L) or on treatment for diabetes; central obesity: Waist circumference > 102 cm (40 inches) in men and > 88 cm (35 inches) in women; hypertension: Systolic blood pressure ≥ 130 mm Hg and/or diastolic blood pressure ≥ 85 mm Hg or on treatment for hypertension; low high-density lipoprotein (HDL) cholesterol: Serum HDL cholesterol < 40 mg/dL (1.04 mmol/L) in men and < 50 mg/dL (1.29 mmol/L) in women; and high blood levels of triglycerides: Serum triglyceride level ≥ 150 mg/dL (1.69 mmol/L).
Before the study, all the invited subjects declared their willingness to participate. The participants filled in a self-administered questionnaire. Shortly thereafter, sociodemographic characteristics, smoking habits, clinical examination results, and laboratory characteristics of the participants were collected from February 2019 to August 2019. In addition, all participants were asked to give verbal informed consent and trained for oral health behaviors.
Except for the third molars, the periodontal status of all teeth was assessed for probing depth (PD), bleeding index (BOP) (bleeding from gingiva after probing), and clinical attachment level (CAL). Gingival status was examined using sterile dental mirrors and explorers, whereas PD and CAL were measured by standardized Michigan O periodontal probes with Williams markings. Besides, PD was measured from the base of the pocket to the gingival margin. For the measurement of CAL, the distance from the cementoenamel junction (CEJ) or the margin of fixed restoration to the base of the pocket in cases of exposure to CEJ was recorded. In other cases, the distance from the gingival margin to CEJ was subtracted from the PD to indirectly measure CAL. In addition, the CEJ level was felt and determined using the tip of the probe. Moreover, GI, PD, and CAL were measured at four sites, including mesiofacial, mid-facial, distofacial, and mid-lingual per tooth for all teeth, except for third molars.
The number of missing teeth was recorded. Definition of periodontitis was confirmed by the evidence of at least one point with a PD ≥ 5 mm, CAL ≥ 3, and PD ≥ 4 mm at two points not located on the same tooth as mild periodontitis. At least two approached points with a CAL > 4 mm or PD > 5 mm not on the same tooth were defined as moderate periodontitis. Finally, severe periodontitis was defined as the presence of at least two points on the separated teeth with a CAL > 6 mm and one or more points with a PD ≥ 5 mm (15-17).
The MetS and control groups were compared in terms of distributional differences in sociodemographic characteristics by the chi-square test. In the same sense, the chi-square test was applied to analyze the significance of differences between the subgroups of MetS components in terms of the prevalence of periodontitis. In addition, the differences in the mean values of periodontal parameters between the two groups and between the subgroups of MetS components were examined using the independent sample t test. The one-way ANOVA test was used to evaluate the association between the number of MetS components and periodontal parameters. The Kolmogorov-Smirnov test indicated that the data were normally distributed. Corresponding 95% confidence intervals were generated for all significant variables. Data were analyzed with SPSS software (version 17). A P value less than 0.05 was considered statistically significant.
4. Results
4.1. Characteristics of Study Participants
The current study was performed on 100 participants aged 25 - 78 years, of whom 50 subjects were male. The study population entailed 50 patients with MetS (21 males and 29 females) and 50 non-MetS participants (29 males and 21 females). Table 1 depicts the distribution of sociodemographic characteristics across the MetS categories. The participants in the MetS and non- MetS groups did not differ in sociodemographic characteristics.
Table 1.
Sociodemographic Characteristics of Participants a
| Variables | MetS (+) | MetS (-) | P-Value b, c |
|---|---|---|---|
| Age (y) | 0.542 | ||
| 25 - 50 | 22 (44) | 19 (38) | |
| 50 - 78 | 28 (56) | 31 (62) | |
| Gender | 0.110 | ||
| Males | 21 (42) | 29 (58) | |
| Females | 29 (58) | 21 (42) | |
| Income | 0.341 | ||
| < 2 million Tomans | 29 (58) | 32 (64) | |
| > 2 million Tomans | 21 (42) | 18 (36) | |
| Education | 0.270 | ||
| < High school | 32 (64) | 28 (56) | |
| > High school | 18 (36) | 22 (44) | |
| Frequency of daily tooth brushing | 0.912 | ||
| No brushing | 17 (34) | 15 (30) | |
| 1 - 2 times/d | 15 (30) | 16 (32) | |
| ≥ 3 times/d | 18 (36) | 19 (38) | |
| Regularity of dental check-ups | 0.344 | ||
| Yes | 21 (42) | 24 (48) | |
| No | 29 (58) | 26 (52) |
a Values are exressed as No. (%).
b Chi-square test
c Significance at P-value < 0.05
4.2. Prevalence of Periodontitis
As illustrated in Figure 1, moderate periodontitis was more prevalent in the MetS group (36%) than in the control group (8%). Nonetheless, the percentage of patients with mild periodontitis was 22% in the MetS group, which was lower than that in the control group (24%).
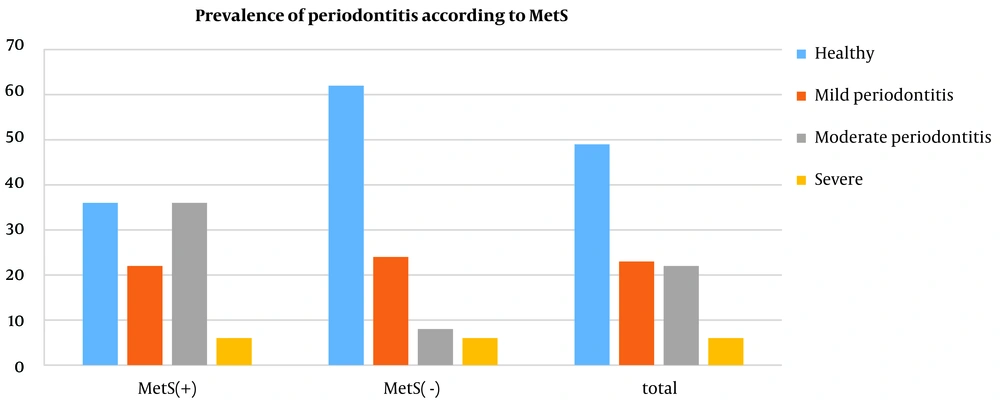
Figure 1.
Prevalence of periodontitis according to MetS
4.3. Periodontal and Metabolic Syndrome Parameters
Table 2 displays the periodontal and metabolic syndrome parameters based on MetS. The patients afflicted with MetS demonstrated significantly higher periodontal parameters (including BOP and CAL), missing teeth, WC, glycemia, and triglycerides than their counterparts without MetS. However, the participants in the case and control groups were not different in terms of PD. In addition, HDL cholesterol was reported to be significantly lower among participants with MetS than among patients without MetS. Moreover, the two groups did not differ regarding systolic and diastolic blood pressures. Table 3 demonstrates the marked increase in periodontal parameters, including BOP, CAL, and missing teeth, and this increase was reported to be the highest in patients with four or five components (P < 0.05). Nonetheless, the increased number of metabolic components did not affect PD. Table 4 shows the Bonferroni Post Hoc test for periodontal parameters by metabolic components.
Table 2.
Periodontal and Metabolic Syndrome Parameters a
| Variables | MetS (+), n = 50 | MetS (-), n = 50 | P-Value b, c |
|---|---|---|---|
| PD (mm) | 2.75 ± 0.702 | 3.08 ± 0.46 | 0.711 |
| CAL (mm) | 2.12 ± 1.11 | 1.39 ± 1.05 | 0.001 |
| BOP (%) | 51.04 ± 31.06 | 22.36 ± 28.46 | 0.001 |
| Missing teeth | 13.34 ± 6.55 | 6.84 ± 5.33 | 0.001 |
| WC (cm) | 88.37 ± 6.81 | 83.87 ± 7.29 | < 0.001 |
| Glycaemia (mmol/L) | 6.26 ± 1.75 | 5.58 ± 1.54 | < 0.001 |
| Triglycerides (mg/dL) | 2.33 ± 1.15 | 1.32 ± 0.26 | < 0.001 |
| HDL cholesterol (mg/dL) | 1.16 ± 0.22 | 1.63 ± 0.27 | < 0.001 |
| Systolic blood pressure (mm Hg) | 12.16 ± 1.25 | 12.02 ± 1.15 | 0.442 |
| Diastolic blood pressure (mm Hg) | 7.65 ± 0.81 | 7.79 ± 0.78 | 0.101 |
Abbreviations: BOP, bleeding on probing; PD, pocket depth; CAL, clinical attachment loss; WC, waist circumference; HDL cholesterol, high-density lipoprotein cholesterol.
a Data are presented as means ± SD.
b Independent t test.
c Significance at P-value < 0.05
Table 3.
Periodontal Parameters by Metabolic Components a
| Variables | 0 - 2 Components (n = 50) | 3 Components (n = 34) | 4 - 5 Components (n = 16) | P – Value b, c |
|---|---|---|---|---|
| BOP (%) | 22.36 ± 28.46 | 39.33 ± 31.87 | 56.55 ± 29.54 | 0.001 |
| PD (mm) | 2.58 ± 0.92 | 2.78 ± 0.67 | 2.67 ± 0.70 | 0.719 |
| CAL (mm) | 1.39 ± 1.05 | 2.12 ± 0.86 | 2.11 ± 1.55 | 0.001 |
| Missing teeth | 6.84 ± 5.33 | 10.31 ± 6.07 | 14.76 ± 6.36 | 0.001 |
Abbreviations: PI, plaque index; GI, gingival index; BOP, number of teeth with bleeding on probing; PD, pocket depth; and CAL, clinical attachment loss.
a Data are presented as means ± SD.
b One-way ANOVA test
c Significance at P-value < 0.05
Table 4.
Bonferroni Post Hoc Test for Periodontal Parameters by Metabolic Components
| (I) mm | (J) mm | Mean Difference (I-J) | Std. Error | Sig. |
|---|---|---|---|---|
| BOP (%) | ||||
| 0 - 2 components | 3 components | -16.97 | 5.05 | 0.0035 |
| 0 - 2 components | 4 - 5 components | -34.19 | 1.52 | 0.0019 |
| 3 components | 4 - 5 components | -17.22 | 2.05 | 0.0059 |
| CAL (mm) | ||||
| 0 - 2 components | 3 components | -0.73 | 0.05 | 0.036 |
| 0 - 2 components | 4 - 5 components | -0.72 | 0.06 | 0.039 |
| 3 components | 4 - 5 components | -0.01 | 0.56 | 0.46 |
| Missing teeth | ||||
| 0 - 2 components | 3 components | -3.74 | 1.55 | 0.0045 |
| 0 - 2 components | 4 - 5 components | -7.92 | 2.01 | 0.0001 |
| 3 components | 4 - 5 components | -4.45 | 0.55 | 0.0025 |
4.4. Periodontal Parameters in Case Group Without Diagnosed Diabetes and Control Group
MetS patients without diagnosed diabetes demonstrated significantly higher BOP, missing teeth, and CAL than the control group. However, the two groups did not differ in PD (Table 5).
Table 5.
Periodontal Parameters in Case Group Without Diagnosed Diabetes and Control Group a
| Variables | Mets (+) Without Diagnosed Diabetes, n = 12 | Mets (-), n = 50 | P-Value |
|---|---|---|---|
| PD (mm) | 2.38 ± 0.77 | 2.58 ± 0.91 | 0.4 |
| CAL (mm) | 1.95 ± 0.49 | 1.39 ± 1.04 | 0.005 |
| BOP (%) | 52.55 ± 31.93 | 22.36 ± 28.45 | 0.005 |
| Missing teeth | 13.33 ± 5.07 | 6.84 ± 5.32 | 0.001 |
Abbreviations: BOP, bleeding on probing; PD, pocket depth; CAL, clinical attachment loss.
a Data are presented as means ± SD.
b Independent t test
c Significance at P-value < 0.05
5. Discussion
In the current study, the association between MetS and periodontitis was investigated using the following procedure: Consideration of MetS as a whole, separated by its components, and concerning the presence or absence of diabetes in the subjects referred to the internal clinic of the hospital. The obtained results indicated that higher periodontal parameters, including BI, CAL, and missing teeth, were observed in patients affected by MetS. It can be inferred that a positive correlation exists between MetS components and periodontal disease and between the severity of periodontitis and metabolic syndrome. Nonetheless, the obtained results did not suggest any significant association between metabolic syndrome and PD, which can be attributed to the small sample size.
In addition, it is worthy to note that the community periodontal index was implemented to diagnose periodontitis in previous studies. However, this method limits the number of examined teeth and may downgrade the incidence of deep pockets (18). Therefore, in the current study, periodontitis was diagnosed based on CDC and AAP (2015), which classify the levels as mild, moderate, and severe (15-17).
The present study results are in line with previous findings concerning the correlation between MetS and the severity of periodontal disease. For instance, in the research conducted by Kim et al., the multivariate analysis indicated a positive relationship between the severity of periodontitis and the prevalence of MetS in men but not in women (19). A study on the Brazilian population indicated the association between metabolic syndrome prevalence and severe periodontitis (20). Li et al. (21) induced periodontitis in rats by periodontal injection of lipopolysaccharide and found a relationship between MetS and increased periodontal inflammation and alveolar bone loss. In the same vein, Tu et al. (22) performed a study on a group of 33,740 Taiwanese participants and demonstrated that the diagnosis of periodontal diseases in Taiwanese women was significantly correlated with MetS; nonetheless, this association was reported to be weaker in Taiwanese men.
Various bioactive substances referred to as adipocytokines, including tumor necrosis factor-α, secreted from visceral adipose tissue, might directly affect periodontal tissue (23). In addition, periodontitis generates peroxisome proliferator-activated receptors that are common in diseases such as atherosclerosis, cardiovascular disease, diabetes, and metabolic syndrome (24).
Among all MetS components, dysglycemia has been reported to build the strongest relationship with periodontal disease (14). Another study indicated a severe PD in subjects with undetected dysglycemia compared to subjects with normoglycemia (25). Both periodontal parameters and missing teeth were evaluated between the case group without diagnosed diabetes and the control group to assess the effect of other metabolic syndrome components, apart from dysglycemia. Higher CAL, BOP, and missing teeth were observed in the case group without diagnosed diabetes, suggesting the additive effect of atherogenic dyslipidemia, central obesity, and hypertension on the risk of periodontitis. However, PD did not change between the two groups. Comparable to the present study, a cohort study (26) suggested that the presence of periodontal pockets seemingly develops hypertension and atherogenic dyslipidemia.
Like the current study, Lee et al. (27) suggested that the presence of gingivitis in a population of 12 to 18-year-old individuals was positively correlated with the number of MetS components. Moreover, in the research performed by Kikui et al. (11), a significantly higher prevalence of periodontal disease was observed in participants with two or more Mets components. However, contrary to the current study, the association between MetS or MetS components and periodontitis was not confirmed by some research. For instance, Thanakun et al. (28), in a study performed on Thai people, indicated that the relationship between periodontitis and increased risk of MetS was not statistically significant. In addition, a recent cross-sectional study carried out by Zuk et al. (29) indicated no association between periodontitis and MetS. These discrepancies between the present study results and the above-mentioned studies can be attributed to different sample sizes and different diagnostic and clinical criteria applied for the definition of MetS components and periodontitis. In addition, the classification of participants based on age, sex, and smoking status seemingly exerts an impact on periodontitis severity.
There are two major limitations in this study that should be addressed in future research. In the first place, the sample size was not large enough to achieve appropriate statistical power. Dilution bias was another major limitation. The components of metabolic syndrome were liable to misclassification because the components were measured on a single day. Such inaccuracy in exposure measurement may result in biased estimation or underestimation. However, a positive association was detected between metabolic syndrome and periodontal disease.