
1. Background
Various metabolic and cardiovascular disorders such as endothelial dysfunction are associated with obesity in childhood and adolescence (1, 2). Studies have shown that more than half of children and adolescents will be obese in adulthood and show a significantly higher risk of non-communicable diseases such as cardiovascular diseases, cancer, and type 2 diabetes mellitus (3). It is widely agreed that inflammation can contribute to the development of atherosclerosis and the risk of cardiovascular disease, and the role of C-reactive protein as an important inflammatory marker in atherosclerotic disease is very complex (4). Recent evidence suggests that miRNAs are involved in almost all physiological responses, and genetic studies using new technologies show that some miRNAs play a vital role in the pathology of cardiovascular disease and normal physiological functions (5). Among numerous miRNAs identified, miR-125a-5p has been identified as a potential biomarker associated with endothelial dysfunction. It has been shown to play a critical role in endothelial tissue function by decreasing cell proliferation and increasing apoptosis and inflammation (6, 7).
The C-reactive protein (CRP) is involved in the transfer of monocytes into the arterial wall and their adhesion, and by inhibiting nitric oxide production, they change the rapid and appropriate response of blood vessels to a specific stimulus (8). Endothelial dysfunction is an early marker of cardiac disease, decreased normal hemostatic function of blood vessels (9), and development of hyperlipidemia and cardiovascular disease (10, 11). On the other hand, CRP is an essential factor in atherosclerosis at all ages, and obesity is a significant determinant of increased CRP concentration (12). Nowadays, it is accepted that regular physical activities are beneficial for the health and quality of life, with little cost and no side effects, resulting in numerous adaptations (7). Recent studies have shown that children and adolescents are sedentary 64% of their waking time on average (13), which causes obesity and increases the risk of cardiovascular disease. The school environment provides a unique opportunity to improve the physical activity of children and adolescents, as they spend a significant part of their waking hours in this environment for more than 10 months a year (14). School-based exercise programs were effective for aerobic power, weight loss, and clinical indicators of obese and normal children and patients (15, 16). Recently, After-school Physical Activity (APA) interventions are more common because schools are safe places to host and sustain programs for enhancing physical activity (17).
In recent years, different training methods have been studied for childhood obesity and some biomarkers related to various diseases, and the results typically indicate the effectiveness of various exercises. However, there is no consensus on training type, duration, and intensity (18). Although some exercise methods, such as high-intensity intermittent training, need much less time and have significant effectiveness, they are very complicated for obese children to perform and require much motivation. On the other side, low-intensity, long-term aerobic exercise is generally monotonous and often dull due to its nature. Therefore, professionals should seek to introduce specific training methods that are more operational in terms of execution time, intensity, and variety of training. Previous studies have less emphasized the effect of APA on cardiovascular factors in children, and the impacts of different exercise modes on vascular inflammation markers and lipid profile have been investigated rarely.
2. Objectives
Therefore, this study aimed to evaluate the effect of a selected APA program on the levels of CRP, miR-125a-5p, lipid profile, and cardiovascular endurance of male children with overweight/obesity.
3. Methods
3.1. Participants
Twenty-four male children (13 - 15 years) from the schools of Shahrekord city were enrolled in this study. G-Power 3.1 software was used to calculate the sample size. The α level, power, and effect size were set at 0.05, 0.95, and 0.8, respectively, resulting in a minimum sample size of 23 (19, 20). Written informed consent was obtained from participants' parents to confirm their voluntary participation in the study. Then, they completed the general health and wellness questionnaire. Overweight was defined as a Body Mass Index (BMI)-for-age between 85th and 95th percentiles and obesity as a BMI-for-age at or above the 95th percentile for children of the same age and sex (21). Inclusion criteria were BMI-for-age of 25 - 35 kg/m2, sedentary lifestyle (< 30 min physical activity per week), no smoking, no history of cardiovascular and other chronic diseases, and no medication use assessed by a medical health history questionnaire. Exclusion criteria were injury during physical activity and absence from more than two sessions during the exercise protocol.
Given that participants' nutritional status could influence outcomes, nutritional counseling was provided to the participants and their parents before the first and last blood sampling at the first meeting on the first and second visits. Participants were stratified according to BMI and then randomly assigned to APA (BMI = 27.5 ± 1.4 kg/m2, n = 12) and control (BMI = 26.28 ± 2.3 kg/m2, n = 12) groups. Participants were instructed not to exercise for 48 hours before the study and to maintain their usual diet. This study was approved by the institutional review board of the University of Isfahan (ethics code: IR.UI.REC.1399.055) and conducted in agreement with the ethical principles for biomedical research involving human participants outlined in the Declaration of Helsinki. The research variables were measured before and after the exercise intervention.
3.2. Exercise Training Protocol
The APA program consisted of 12 weeks (three sessions per week) of typical physical education class routines consisting of 20 min shuttle run test as aerobic training, Futsal basic skills training, playing Futsal, and sit-up exercises with a duration of 30 min in the first week to 55 min in the last session.
3.3. Physiological Assessments
The dependent variables were measured before and after exercise interventions in the same condition. A digital scale and a stadiometer (Harpenden, UK Ltd.) measured body mass and height, respectively. The BMI was calculated by dividing the weight by the square of the height in meters. The waist to hip ratio (WHR) was calculated by dividing the waist measurement by hip measurement since the waist is the narrowest part and the hips are the widest part of the buttocks (22). Body fat percentage was determined by Cortés-Castell et al. (2017) equation based on BMI (22). All participants performed 20 min shuttle run tests to measure peak oxygen consumption under the same environmental conditions, and then we used the formula of Matsuzaka et al. to estimate VO2peak (23).
3.4. Laboratory Measurements
Blood samples (5 cc) following 12 h overnight fasting in pre-posttest phases (24 h before and 48 - 72 h after the last training session) were collected from the left brachial vein in the sitting position, kept in test tubes, and transferred to the laboratory for CRP and lipid profile analysis.
Immediately after sample collection, blood specimens were poured into the tubes containing anticoagulants and transferred to the laboratory. The CRP and other variables were measured in standard laboratory conditions. Blood samples were centrifuged at 4°C for 10 min at a speed of 3,000 rpm, and the resulting plasma was frozen at -80°C until further measurements. The CRP levels were measured using the Pars Test Kit manufactured in Iran with a sensitivity of 0.1 to 30 mg/l by immunoturbidimetric assay with a fully automatic ERBA XL600 system made in Germany.
To measure miR125a, we transferred the samples to the laboratory for testing with a Real-Time PCR (RT-PCR) system. First, 500 µL of blood was thoroughly mixed with 1 mL of buffer to give a homogeneous solution and transferred to a 2 mL microtube. The resulting mixture was kept at ambient temperature for 5 min. Then, 200 mL of chloroform was added to the mixture, shaken up and down sharply for 10 to 15 s, and rereleased for 5 min. The tube containing the mixture was centrifuged at 12,000 rpm for 5 min. After this phase was completed, two layers were visible. The RNA-containing supernatant was separated and transferred to another tube. Then, 1000 μL of 100% cold ethanol was added to it and placed in a -20°C freezer for 8 min. Finally, the tube was removed from the freezer and centrifuged as before. The liquid inside the tube was discarded after centrifuging. At this point, sometimes colorless or white spots were observed in the body and bottom of the tube. Centrifugation was repeated in this condition by adding 80% ethanol for washing. After removing ethanol and drying tube content (using the air-dry method), 20 to 50 µL of double distilled water was added depending on the amount of sediment and dissolved by a micro-RNA pipette into the tube. Then, 5 µL of it was electrophoresed on a 1% agarose gel to confirm the quality to be used in deoxyribonucleic acid (DNA) synthesis after confirmation. To eliminate DNA from the extracted RNA product, after verifying the RNA quality on the 1% agarose gel, 0.5 mL of DNaseI was added to a tube containing RNA at a concentration of 2 ng/mL to a concentration of 500 ng to 5 µg. It was then incubated at 37°C for 10 min. For the extraction of miR125a, the RT-PCR system (ABI Step one, USA) was used, and the values were calculated (ΔCt). The microRNA database (miRBase) was used to determine the miR125a sequences. Quantitative analysis of miR-125a was performed using the biotech kit from Irizol Biotech by ELISA according to the manufacturer's instructions (RNA Extraction Kit manufactured by the Rena Biotech Co.; access code: RB1001) (18).
3.5. Statistical Analysis
The measured variables are presented as mean ± SD. The data normality was verified by the Shapiro-Wilk test, and the homogeneity of variance was confirmed by Levene’s test. Paired t test was used for within-group comparisons, and Analysis of Covariance (ANCOVA), considering pretest scores as covariates, and Bonferroni post hoc tests were used to compare the between-group changes in measured variables. SPSS version 21 software (IBM, New York, USA) was applied for data analysis. For testing research hypotheses, the significance level was set at ≤ 0.05.
4. Results
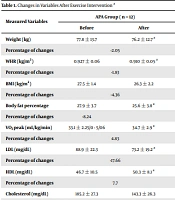
The physical characteristics were not significantly different between the two groups at baseline (Table 1). All exercise group participants attended the after-school exercise sessions for 12 weeks without absenteeism. Body composition, cardiorespiratory fitness, and other physiological variables measured at baseline and after exercise intervention are presented in Table 1. There were significant improvements in all measured variables in the posttest compared to baseline (P = 0.01) (Table 1). The BMI, WHR, Low-density Lipoprotein (LDL), triglyceride, CRP, and body fat percentage decreased significantly in the APA group (P = 0.01). There were significant improvements in VO2peak, high-density lipoprotein (HDL), and miR-125a-5p levels, and between-group changes were statistically significant (P = 0.01) (Table 1).
Table 1.
Changes in Variables After Exercise Intervention a
| Measured Variables | APA Group ( n = 12) | CON Group ( n = 12) | Between-Group P-Value | ||
|---|---|---|---|---|---|
| Before | After | Before | After | ||
| Weight (kg) | 77.8 ± 13.7 | 76.2 ± 12.7 a | 77.4 ± 13.7 | 77.7 ± 13.5 | 0.001 b |
| Percentage of changes | -2.05 | 0.38 | |||
| WHR (kg/m2) | 0.927 ± 0.06 | 0.910 ± 0.05 a | 0.915 ± 0.04 | 0.919 ± 0.3 | 0.013 b |
| Percentage of changes | -1.83 | 0.43 | |||
| BMI (kg/m2) | 27.5 ± 1.4 | 26.3 ± 2.2 | 26.28 ± 2.3 | 26.9 ± 2.2 | 0.103 b |
| Percentage of changes | -4.36 | 2.35 | |||
| Body fat percentage | 27.9 ± 3.7 | 25.6 ± 3.8 a | 28.1 ± 3.6 | 28.3 ± 3.7 | 0.001 b |
| Percentage of changes | -8.24 | 0.7 | |||
| VO2peak (mL/kg/min) | 33.1 ± 2.25/0 - 5/06 | 34.7 ± 2.9 a | 32.2 ± 1.4 | 31.7 ± 1.4 | 0.001 b |
| Percentage of changes | 4.83 | -1.6 | |||
| LDL (mg/dL) | 88.9 ± 22.3 | 73.2 ± 19.2 a | 80.4 ± 20.8 | 81.9 ± 20.7 | 0.001 b |
| Percentage of changes | -17.66 | 1.9 | |||
| HDL (mg/dL) | 46.7 ± 10.5 | 50.3 ± 8.1 a | 49.9 ± 9.4 | 49.6 ± 8.9 | 0.018 b |
| Percentage of changes | 7.7 | -0.6 | |||
| Cholesterol (mg/dL) | 185.2 ± 27.3 | 143.3 ± 26.3 | 151.6 ± 21.0 | 152.7 ± 19.4 | 0.001 b |
| Percentage of changes | -22.6 | 0.7 | |||
| Triglycerides (mg/dL) | 107.4 ± 40.9 | 90.5 ± 31.6 a | 102.2 ± 28.1 | 108.3 ± 25.7 | 0.021 b |
| Percentage of changes | -15.7 | 5.9 | |||
| C-reactive protein (micro g/mL) | 2.56 ± 0.9 | 1.85 ± 0.7 a | 2.57 ± 1.1 | 2.82 ± 1.0 | 0.001 b |
| Percentage of changes | -27.7 | 9.7 | |||
| miR125a (ΔCt) | 3.57 ± 2.2 | 4.88 ± 2.8 a | 4.36 ± 1.8 | 4.69 ± 1.8 | 0.079 |
| Percentage of changes | 36.7 | 7.6 | |||
Abbreviations: CON, control; APA, after-school physical activity; BMI, body mass index; WHR, waist-to-hip ratio; VO2peak, peak oxygen consumption; VLDL, very low-density lipoproteins; LDL, low-density lipoproteins; HDL, high-density lipoproteins; ∆Ct, difference of expression between two genes; mg/dL, milligram per deciliter; pg/mL, picogram per milliliter.
a Values are expressed as mean ±SD, (P < 0.05).
b Significant difference between pre-posttests.
c Significant difference between the groups.
5. Discussion
The findings showed that the C-reactive protein level was significantly decreased after the 12-week exercise intervention (APA -27.7% and CON 9.1%), which is consistent with the results of previous studies (4, 24). Since regular physical activity decreases sympathetic stimulation, it possibly decreases the secretion of tumor necrosis factor-alpha, the potent stimulator of interleukin-6 production, which is a potent inhibitor of CRP production (8). Additionally, it has been found that obesity is associated with high concentrations of inflammatory markers such as CRP in the bloodstream. An increase in blood CRP in adolescence is related to coronary artery disease and can predict the values of this inflammatory marker in adulthood.
Studies show that long-term exercise reduces CRP and increases insulin sensitivity by reducing the production of cytokines in adipose tissue, muscle, and mononuclear cells, which, in turn, improves endothelial function and is helpful to control body weight (25). In this study, APA increased hsa-miR-125a-5p levels to 36.7% compared to the control group (7.6%) and probably improved the endothelial function of adolescents with overweight and obesity, which is consistent with some previous studies that identified hsa-miR-125a-5p level as a biomarker of endothelial function improvement (1).
Previous studies have shown the role of miRNAs as either tumor suppressors by down-regulating oncogenic targets or tumor promoters through negatively regulating tumor-suppressive target mRNAs (26, 27). Available evidence suggests that miR-125 has various functions in several cancers, including ovarian cancer, bladder cancer, breast cancer, hepatocellular carcinoma, melanoma, cutaneous squamous cell carcinoma, and endothelial function (1, 28). Because of abnormal expression of the hsa-miR-125 family in almost all types of cancers and other diseases, they can be used as biomarkers for the early diagnosis of cancers and other diseases, depending on their abundance (26, 29). Based on the above findings, we hypothesized that exercise, as an active lifestyle, along with other treatment modalities, can play an essential role in preventing some diseases and use as adjunctive therapy with prescription drugs in adolescents and adults.
Our study revealed that this exercise intervention was influential on the lipid profile of participants. It seems that various exercise training modes like our training program can positively improve the lipid profile of overweight and obese adolescents with different mechanisms. Possible causes of improved HDL levels are increased liver lipoprotein lipase and reduced hepatic lipase enzyme activities following exercise training. Although LDL levels reduce due to weight loss and body fat, lecithin-cholesterol acyltransferase (LCAT) may play a vital role in this process (30, 31). Studies have reported that every 1 mg/dL rise in HDL-C level is associated with a 2% - 3% decreased risk of CVD, and a 1% reduction in TC level is associated with a 2% reduction in CVD (32, 33). In this study, significant changes were observed, similar to other studies. Therefore, regular exercise activities that are well planned in terms of intensity, duration, and frequency of weekly sessions can improve children's health indicators. It should be noted that one of the objectives of this study was to evaluate the effectiveness of school-based exercises outside class hours, and it was found that if these exercises are planned regularly for at least three sessions per week, instead of one session per week, it will improve the health of children and adolescents. Previous studies agree that exercise activities, especially regular aerobic exercise, may increase endothelial nitric oxide, increase antioxidant agents, and reduce anti-inflammatory agents and pro-inflammatory cytokines. It has been shown that the reduction of systemic and local inflammation and, consequently, the reduction of inflammatory cytokines from endothelial wall smooth muscles and their eventual effects are likely to decrease the production of inflammatory markers of CRP in the liver (34).
5.1. Conclusion
This study revealed that a 12-week after-school physical activity program had remarkable positive effects on the participants' body composition, lipid profile, CRP, and VO2peak levels. Therefore, it can be concluded that school-based physical activities may positively reduce endothelial dysfunction in children and adolescents. It seems that the use of regular exercise, especially school-based training, is more in line with students' daily activities and will have beneficial effects on the prevention and control of endothelial dysfunction. The results showed that the amount of miR-125a-5p increased parallel with the increase in aerobic capacity of the participants. Meanwhile, performing high-intensity interval training in children and adolescents with severe obesity is extremely difficult and requires more motivation. This study had some limitations, such as a lack of careful control of participants' nutritional and physical activity status outside the training sessions and a small number of participants. Therefore, future studies must consider these limitations to investigate the effects of APA and other exercise modalities to obtain more information on these important biomarkers.