
1. Background
Nasal polyps are caused by hyperplasia, a protrusion of the mucous membranes of the sinuses and nose that results from systemic or localized disease. The most common association between them is in chronic rhinosinusitis (CRS) (1), which is associated with the specific pathologies of cystic fibrosis, asthma, Churg-Strauss syndrome, and sarcoidosis (2). The CRS with polyposis, with the appearance of nasal polyps on both sides, originates in the middle myatosum and ethmoid region (3). Histopathologically ocular visual polyps consist of an appendix of pseudo - flat cylinders with a large thickness of basement membrane located on a set of edematous stroma (4).
Clinical signs include the obstructive symptoms of pain or pressure in the face, nasal congestion and nasal speech, purulent nasal discharge, olfactory or hypoxic dysfunction, sleep disturbances, mouth breathing, and epistaxis with cough (5, 6). Physical examination, computed tomography (CT) scan, and sinus endoscopy are helpful in history diagnosis. Sinonasal endoscopy is needed to diagnose polyps, which can also detect other disorders and diseases. The CT scan is also used to check for the involvement of paranasal sinuses (7). In these patients, after unsuccessful drug treatments, endoscopic sinus surgery is performed, and to prevent the recurrence of polyps, long - term courses of topical corticosteroid therapy are prescribed after surgery (3).
The Eustachian tube is a part of the middle ear that connects the tympanic cavity to the nasopharynx. The outer part of the Eustachian tube is inside the bony canal, and the inner part of the Eustachian tube is the cartilaginous duct that hangs from the base of the skull. In general, the function of the Eustachian tube is determined by the balance between the opening forces and the forces that tend to close it (8).
Recent studies show that the middle ear, Eustachian tube, nose, and paranasal sinuses act as a single entity, and each disorder affects the other components. Nasal obstruction due to polyps leads to dysfunction of the Eustachian tube and changes in pressure on both sides of the tympanic membrane, which can cause changes in the structure and function of the tympanic membrane and hearing disorders (9, 10).
2. Objectives
Considering the above - mentioned issues and studies on middle ear function by performing audiometric tests, this study aimed to investigate the effect of polypectomy on middle ear function in patients with nasal and sinus polyposis.
3. Methods
This quasi-experimental study started after receiving permission from the Ethics Committee of Birjand University of Medical Sciences, Birjand, Iran (IR.BUMS.REC.1399.219) and during the administrative steps of the study in Vali-e-Asr University and Razi Hospital in Birjand. The results were collected during 2021 and analyzed and reported in general at the end without the names of individuals.
The study population included patients with symptoms of chronic headache, persistent nasal congestion, anosmia or hyposmia, the presence of otorrhea and rhinorrhea, accumulation of sputum in the back of the throat, recurrent infections, nasal congestion, snoring during sleep, snoring and bloating, loss of sense of taste, runny nose and sneezing, fatigue, halitosis, a feeling of fullness, and tinnitus in the specialized clinic of ear, nose, and throat (ENT) of Vali-e-Asr and Razi hospitals in Birjand.
The patients underwent a complete clinical examination of ENT by an ENT specialist. If polyps are suspected, outpatient endoscopy is performed. If nasopharyngeal polyposis was confirmed and polypectomy was indicated, the patients were evaluated for inclusion criteria and the form of demographic characteristics, including age, gender, occupation, and septal deviation diseases. Turbinate hypertrophy, tumor, acute sinusitis, and other inflammatory diseases were completed.
After explaining the objectives of the study and obtaining informed consent, the patients were referred to an audiometry center (Tanin Audiometry Center) on a specific date and time. At the on - site audiometry clinic, a tympanometric audiometric test was performed on the patients. Then, the patients underwent polypectomy by an ENT specialist. One month after surgery, middle ear function was evaluated again with preoperative conditions and methods, and pre - and postoperative findings were compared.
The volume threshold of individuals is divided and categorized as follows:
0 - 25 dB: Normal hearing
24 - 40 dB: Mild hearing loss
41 - 55 dB: Moderate hearing loss
56 - 70 dB: Almost severe hearing loss
71 - 90 dB: Severe hearing loss
90 and over 90 dB: Deep hearing loss
To interpret the tympanometric test and the type of hearing and tympanometric disorders, the following protocol was followed (Figure 1) :
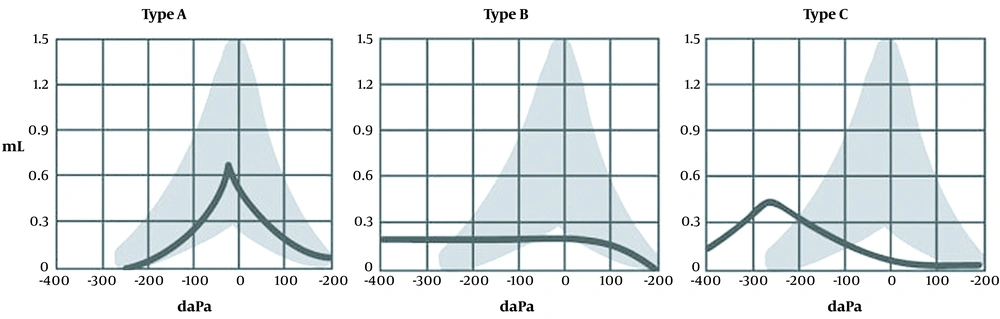
Figure 1.
Results of the tympanometric test
Type A: The peak of the tympanogram is at normal pressure. This category has three subcategories as follows:
An: Both pressure and amplitude of the tympanogram are normal.
Ad: Pressure is normal; however, the range is higher than normal. This is observed when the hardness of the middle ear is reduced due to lesions, such as neotampan (i.e., thinning of the tympanic membrane due to rupture and then repair) or rupture of the bony chain of the middle ear.
As: Pressure is normal; however, the amplitude is less than normal. This is observed in cases where the hardness of the middle ear is increased due to lesions, such as otosclerosis, tympanosclerosis, and cholesteatoma.
Type B: In this case, the tympanogram has no peak at all. Accordingly, it shows its amplitude so that it is like or smooth. This type of tympanogram is observed in patients with otitis media. Additionally, in case of a rupture of the tympanic membrane, the tympanogram is a straight line, and the volume of the ear canal is shown to be normal.
Type C: Regardless of the range, the peak is under very negative pressure. This type of tympanogram is commonly observed in Eustachian tube disorder.
3.1. Data Analysis Method
After completing the questionnaire, the data were entered into SPSS software (version 18). The Kolmogorov - Smirnov test was used to check for normality. The data were analyzed using the paired t-test, and the Wilcoxon test was used if there was no normal distribution. McNemar’s test was utilized to compare symptomatology before and after surgery. The significance level was considered P < 0.05.
4. Results
In the present study, 50 patients underwent nasal polyposis surgery. Out of 50 patients, 25 (50%) and 25 (50%) subjects were female and male, respectively. The mean age of the patients was 36.7 ± 11.5 years. Moreover, 28% of the patients were housewives, and another 28% were employees. In this study, 44% of the patients had 1 - 2 years of clinical symptoms (Table 1).
Table 1.
Frequency Distribution of Demographic Information of Patients in the Study
| Variables | No. (%) |
|---|---|
| Gender | |
| Male | 25 (25) |
| Female | 25 (50) |
| Occupation | |
| Household | 14 (28) |
| Farmer/rancher | 2 (8) |
| Self-employed | 10 (20) |
| Student | 8 (16) |
| Employee | 14 (28) |
| Duration of clinical symptoms of the disease | |
| ≥ 1 | 19 (38) |
| 1 - 2 years | 22 (44) |
| ≤ 3 | 9 (18) |
Based on the results of the present study, the frequency distribution of clinical symptoms of headache, sputum accumulation, sneezing, runny nose, nasal congestion, nasal speech, tinnitus, feeling of fullness in the face, decreased sense of smell, smoking snoring, and snoring after surgery significantly decreased, compared to those before surgery (P < 0.05) (Table 2).
Table 2.
Comparison of Frequency Distribution of Clinical Symptoms of Patients in the Study a
| Clinical Symptoms | After Surgery | Before Surgery | P-Value (Mcnemar’s Test) |
|---|---|---|---|
| Fever | 1 (2) | 2 (4) | 1.000 |
| Headache | 2 (4) | 10 (20) | 0.008 |
| Fatigue | 2 (4) | 5 (10) | 0.250 |
| Sputum accumulation | 9 (18) | 40 (80) | 0.000 |
| Cough | 2 (4) | 6 (12) | 0.125 |
| Sneezing | 4 (8) | 18 (36) | 0.000 |
| Rhinorrhea | 8 (16) | 30 (60) | 0.000 |
| Nasal congestion | 12 (24) | 45 (90) | 0.000 |
| Nasal speech | 5 (10) | 19 (38) | 0.000 |
| Tinnitus | 3 (6) | 11 (22) | 0.008 |
| A feeling of heaviness in the ears | 1 (2) | 5 (10) | 0.125 |
| Decreased sense of smell | 6 (12) | 21 (42) | 0.000 |
| Decreased sense of taste | 1 (2) | 6 (12) | 0.063 |
| Feeling heavy or full in the head | 2 (4) | 13 (26) | 0.001 |
| Snoring while sleeping | 2 (4) | 12 (24) | 0.002 |
| Snore | 10 (20) | 17 (34) | 0.016 |
| Bad breath | 3 (6) | 7 (14) | 0.250 |
a Values are expressed as No. (%).
Based on the results of the present study, the mean scores of speech recognition threshold (SRT) and speech discrimination score (SDS) in the left and right ears after surgery were not significantly different from those at the beginning of the study (P > 0.05) (Table 3).
Table 3.
Comparison of Mean Scores of Speech Recognition Threshold and Speech Discrimination Score in the Ears of Study Patients a
| Underlying Disease | Before Surgery, Median (q3 - q1) | After Surgery, Median (q3 - q1) | P-Value (Wilcoxon Statistical) |
|---|---|---|---|
| SRT right ear | 18.9 ± 9.1 | 18.1 ± 8.6 | 0.080 |
| 15 (20 - 15) | 15 (20 - 15) | ||
| SRT left ear | 18.7 ± 9.5 | 18.8 ± 10.2 | 0.239 |
| 15 (20 - 15) | 15 (20 - 15) | ||
| SDS right ear | 100 ± 0 | 100 ± 0 | 1.000 |
| 100 (100 - 100) | 100 (100 - 100) | ||
| SDS left ear | 100 ± 0 | 100 ± 0 | 1.000 |
| 100 (100 - 100) | 100 (100 - 100) |
Abbreviations: SRT, speech recognition threshold; SDS, speech discrimination score.
a Values are expressed as mean ± SD or No. (%).
Based on the results of the present study, which are shown in Table 4, the frequency distributions of 84% and 92% of pure - tone audiometry (PTA) of the right and left ears before surgery were normal, respectively. The frequency distributions of PTA of the right and left ears after surgery were 86% and 86% in patients, respectively. The tympanometric frequency distributions of the right ear before and after surgery were 80% and 88% normal, respectively, and of the left ear were 72% and 92%, respectively (Table 4).
Table 4.
Frequency Distribution of Middle Ear Tympanometric Status of Patients in the Study a
| Variables | Natural | Middle Ear Membrane Laxity | Acute Otitis Media | Chronic Otitis |
|---|---|---|---|---|
| Right ear tympanometry before surgery | 40 (80) | 3 (6) | 7 (14) | 0 (0) |
| Right ear tympanometry after surgery | 44 (88) | 3 (6) | 2 (4) | 1 (2) |
| Left ear tympanometry before surgery | 36 (72) | 3 (6) | 11 (22) | 0 (0) |
| Left ear tympanometry after surgery | 46 (92) | 2 (4) | 2 (4) | 0 (0) |
| Right ear PTA before surgery | 42 (84) | 7 (14) | 1 (2) | 0 (0) |
| Right ear PTA after surgery | 43 (86) | 6 (12) | 1 (2) | 0 (0) |
| Left ear PTA before surgery | 46 (92) | 3 (6) | 1 (2) | 0 (0) |
| Left ear PTA after surgery | 43 (86) | 7 (14) | 0 (0) | 0 (0) |
Abbreviation: PTA, pure-tone audiometry.
a Values are expressed as mean ± SD or No. (%).
Based on the results of the present study, the frequency distribution of clinical symptoms of headache, sputum accumulation, sneezing, runny nose, nasal congestion, nasal speech, tinnitus, feeling of fullness in the face, decreased sense of smell, smoking snoring, and snoring, decreased sense of taste, and bad breath in patients after surgery significantly decreased, compared to those before surgery (P < 0.05) (Table 2).
5. Discussion
In a study conducted by Teo et al. (11) entitled “Evaluation of the Effect of Nasal Sinus Endoscopy on Auditory Symptoms in 395 Patients”, after surgery, the symptoms of earache, dizziness, and headache were significantly reduced, which is consistent with the present study’s results. In a study conducted by Zhang et al., it was stated that the mean score of the 22 - item Sinonasal Outcome Test (SNOT - 22) (i.e., a questionnaire of symptoms, diseases, and nasal problems) in patients with nasal polyps 1 and 3 months after rhinoplasty was significantly reduced. The severity of symptoms also had a significant decrease (P < 0.05) which is consistent with the present study’s results (12). In a study by Deconde et al., it was stated that the mean score of the SNOT - 22 6 months after surgery in patients undergoing endoscopic sinonasal surgery was significantly reduced (P < 0.05), which is consistent with the current study’s results. Had (13).
In the current study, patients with CRS undergoing surgery, obstruction and inflammation of the nasal mucosa, infection, middle ear infection, and nasal cavity were reduced. On the other hand, the improvement of clinical symptoms in patients was observed. The quality of life of patients with rhinosinusitis after surgery also improved following the improvement of these symptoms.
Based on the results of the present study, the mean scores of SRT and SDS in the left and right ears after surgery were not significantly different from those at the beginning of the study (P > 0.05). It is noteworthy that the mean frequency of parameters related to the electrocardiography of the patients was within the normal range. The lack of significant differences in SDS and SRT parameters after surgery might be related to the normality of these parameters.
Given that the middle ear is considered a specialized paranasal space, it is predicted that nasal polyps will lead to dysfunction of the Eustachian tube, which in turn will lead to negative pressure in the middle ear.
Based on the results of the present study, the tympanometric frequency distributions of the right ear before and after surgery were 80% and 88% normal, and for the left ear, were 72% and 92%, respectively. Due to the fact that the average duration of this problem in patients was not very long, the patients underwent surgery in the early stages. Therefore, in most patients before and after sinus surgery, the condition of the middle ear was normal.
Due to the fact that CRS leads to the inflammation and obstruction of the nasal cavity, mucous secretions lead to the chronic inflammation of the Eustachian tube and cause middle ear infection in patients, which brings about symptoms such as tinnitus, dizziness, headache, and earache. It is recommended that all patients with rhinosinusitis undergo audiometric testing to be screened for middle ear conditions before and after surgery.
5.1. Conclusions
Middle ear function, except for PTA, was not significantly different in SDS and SRT tests before and after CRS surgery in patients undergoing surgery. The tympanometric performance of patients before and after surgery was significantly improved. Additionally, the clinical symptoms of patients after CRS surgery improved compared to those at the beginning of the study.