


1. Background
Nowadays, cancer is one of the most important diseases and health disturbing factor that jeopardizes the physical, psychological and social health. Some patients experience more severe psychological problems that reduce their quality of life (QoL). The cancer diagnosis is followed by lack of patient's personal control over treatment method and uncertainty of its outcome. Therefore, psychological problems are associated with cancer (1). Among different types of cancer, breast cancer is the most common cancer and the fifth leading cause of death due to cancer among Iranian women (2).
According to the National Cancer Registry report in Iran, during the last four decades, increased incidence of breast cancer has put this disease among the most common cancers in Iranian women. In Iran, according to the Management Center of Diseases in the Ministry of Health, the incidence of breast cancer among all cancers in women still ranks first. Its incidence rate is 27.15 (3).
Fortunately, the survival rate of breast cancer after diagnosis is 75% during a 5-year period. Breast cancer patients often experience severe psychological distress after being aware of their disease and also during the whole course of treatment. However, educating patients about cancer, treatment and rehabilitation can lead to lesser side effects from cancer treatments, and improved performance status (4). Almost in all cancer types, psychological distress is associated with an increased treatment-related side-effect during chemotherapy (5), and increased risk of mortality (6). Moreover, anxiety is higher at the period of 4 - 6 months after diagnosis (7). Studies have shown that emotional reactions to breast cancer depend on many factors including the disease (disease stage, tumor location and size), and patient status (social and cultural status, attitude to disease, support systems, personality traits, accommodative mechanisms and the underlying physical and psychological diseases) (8). Cancer patients are at increased risk of depression and anxiety (9). About 40% of cancer patients are in a psychologically vulnerable state (10). Health-care providers and patients believe that more focus should be put on Quality of life (QoL), because of the increased survival rate and the younger age of diagnosis (11). Physical functioning, social interaction, psycho-emotional well-being and related symptoms should be considered in QoL (12).
According to World Health Organization (WHO), QoL is defined as individual perception of life, values systems, goals, expectations, standards, and interests in the context of the culture (13, 14). Several studies showed that the survival of most cancer patients is associated with better QoL (15-17). So, identifying the determinants of QoL can lead to better care for cancer patients. The QoL in cancer patients is low and many factors contribute to the poor QoL. Social support from family members, friends and neighbors, higher household income, medical insurance plans with low co-payment, optimism, symptom distress, social support, appraisal of illness, and a give-in coping mode are associated with QoL (18-20).
Another psychological issue is defense mechanisms. Freud uses defense mechanisms to refer to those unconscious psychological mechanisms that human beings apply to resolve negative emotions. These emotionally-oriented strategies do not change the stressful situation, but they only change the way it is perceived. Defense mechanisms affect cognitive and emotional processes and may lead to distortion of one’s emotional system (21). They are the individual’s first response in dealing with the stress. Researchers have emphasized on distinguishing between defense mechanisms and coping strategies. Coping strategies require full awareness and decision-making to manage and solve problematic situations, while unconscious defense mechanisms occur and can only interfere with the internal emotional state and create distortion of reality. In addition, coping strategies are dependent on situation, while defense mechanisms reflect relatively stable characteristics of individuals. Intentionality, functionality, and adaptiveness can be considered as distinguishing coping and defense mechanisms (22-24).
According to the DSM5, defense can be classified based on the degree of experience and maturity as: 1) psychotic narcissistic defenses: These defenses are usually considered as part of psychosis process, but may also occur in dreams and fantasies of young children and adults. The typical characteristics of these cases are avoidance, denial or distortion of reality, projection, denial and distortion. 2) Immature defenses: These mechanisms become the relatively common mood disorders in the years before puberty and also in adulthood. These defenses include acting out, blocking, hypochondriasis, introjection, passive aggression, projection (at non-psychotic level), regression, schizoid fantasy and somatization. 3) Neurotic defense: These are common in apparently healthy and normal people and in neurosis disorders. It is possible that these defenses have conformity aspect depending on the circumstances and may be socially acceptable. Neurotic defense includes control, displacement, analysis, externalization, inhibition, intellectualization, isolation, rationalization, reaction formation, repression, sexualization, altruism, anticipation, asceticism, humor, sublimation and suppression (25).
However, it can be argued that patients with breast cancer often experience severe psychological distress at the time of awareness of cancer and during the course of treatment. They may have lower physical and psychological QoL and have more stress and face many psychological problems which include depression, anxiety, exhaustion, feeling of frustration and anger. Defense mechanisms are used as common automated psychological processes that protect cancer patients against anxiety, awareness of danger and internal and external stressors. Thus, the aim of this study is to investigate the relationship between defense mechanisms and the QoL in women with breast cancer. However, this study is the first study (in Iran) that investigates the defense mechanisms in cancer patients, particularly in women with breast cancer.
2. Methods
The present study is a correlational study. Statistical population of the study included all women with breast cancer who referred and were hospitalized in Imam Khomeini Hospital of Tehran in the summer of 2015. Participants were 96 patients that were selected using available sampling. All patients completed general quality of life and defense mechanisms questionnaires. This study was approved by the Institutional Review Board (IRB) in Semnan University (approval no.: IRB25694238). Informed written consent was obtained from each participant before the questionnaires were distributed.
The questionnaire measurs the Global “Life Quality” in cancer patients (QLQ-C30) - (general quality of life questionnaire). This questionnaire belongs to European Organization for Research and Treatment of Cancer (EORTC). General quality of life is a multi-dimensional questionnaire which contains 30 questions and it measures the QoL 5 functional scales (physical functioning, role, emotion, cognitive and social) and 9 symptoms scale (fatigue, pain, nausea and vomiting, shortness of breath, diarrhea, constipation, insomnia, decreased appetite and economic problems caused by disease and received treatment) and a general field of quality of life. Measuring the reliability of this test by Cronbach's alpha showed that its reliability is variable from 0.48 to 0.95. The validity and reliability of these questionnaires were evaluated by Montazeri et al. The range of reliability of this questionnaire with Cronbach’s alpha was reported 0.48 - 0.95 (26).
Defenses style questionnaire (DSQ): this test contains 77 items that was done and normalized by Hosseini (27). Reliability of the test is calculated as 0.84 by Cronbach's alpha. Test answers are adjusted based on a 5-degree Likert scale (strongly agree, strongly disagree). This questionnaire measures 14 defense mechanisms which include: repression, compensation, identification, introjection, projection, rationalization, reaction formation, regression, displacement, denial, fancy, sublimation, conversion and intellectualization. Questionnaire scoring is adjusted based on a 5-point Likert scale, scoring from “strongly agree = 4”, to “strongly disagree = 0”. After answering, according to terms related to each mechanism, we counted the scores and divided them by the number of phrases associated with each mechanism. Thus, the average of each mechanism is obtained (27). Patients’ demographic information were collected such as age, sex, marital status, education, date of awareness of disease, date of diagnosis, type of treatment received and the existence of this type of cancer in family history. For people who did not have sufficient literacy, the questionnaire was read orally.
Data were analyzed using SPSS/PC version 19 (IBM SPSS). Using canonical correlation, the relation between variables of QoL and the defense mechanisms of patients were analyzed.
3. Results
Participants were 96 patients with the mean age of 43.05 (SD = 11.31). About 57 percent of them were married, and the rest were either single or widowed. Education Diploma or less was 69%. The mean and standard deviation (SD) of defense mechanisms and the QoL variables are reported in Table 1. Repression defense mechanism is the most strongly correlated with QoL in fatigue aspect (r = 0.21, P < 0.05). Identification and introjection defense mechanisms had a high correlation with QoL in pain aspect (r = 0.22, P < 0.05). Rationalization defense mechanism is strongly correlated with QoL in insomnia aspect (r = -0.36, P < 0.05). A canonical correlation analysis was performed to investigate the canonical relationship between defense mechanism and QoL variables. The findings showed that null hypothesis, based on which all canonical correlation were zero in society, was rejected (Wilks' Lambda = 0.023, P < 0.001). Also, the next null hypothesis based on the fact that the remaining thirteen canonical correlations were zero was rejected (Wilks' Lambda = 0.063, P < 0.05). Thus, two distinct and significant linear combinations can be considered between variables. Canonical correlation, eigenvalues and their significance test is reported in Table 2. The first and the second canonical correlation coefficients were significant between variables at the intensity of 0.79 and 0.69 (Figure 1), respectively. For the first canonical function in the left set of variables (latent variables of defense mechanisms) displacement defense mechanism had the most canonical loading with - 0.59 canonical loading. After that, regression defense mechanism with canonical loading - 0.53 had the most canonical loading. Thus, the latent variable of defense mechanism, (variable 1) the first canonical function, was saturated with displacement and regression mechanism. In another dimension of the right side variables (latent variable of QoL) QoL in physical and cognitive aspects with 0.48 canonical loading had the most canonical loading. Then, the QoL in role aspect with the 0.48 canonical loading had the greatest canonical loading. Thus, the latent variable of QoL was saturated in the first canonical function of QoL in physical, cognitive and role. These relationships indicated that excessive use of displacement and regression mechanisms are associated with lower levels of QoL in the physical, cognitive and role aspects. The severity of this canonical relationship was 0.79. Raw and standard coefficients are reported in Table 3. Canonical model test is plotted in Figure 1. For the second canonical function in the left set of variables (latent variables of defense mechanisms), projection defense mechanism had the most canonical loading with - 0.52 canonical loading. After that, reaction formation defense mechanism with canonical loading - 0.47 had the most canonical loading. Thus, the latent variable of defense mechanism in the second canonical function was saturated with projection and reaction formation mechanism. In another dimension for the right side variables (latent variable of QoL), QoL in cognitive aspects with 0.48 canonical loading had the most canonical loading. Then, the QoL in role aspect with the 0.40 canonical loading had the greatest canonical loading. Thus, the latent variable of QoL was saturated (variable 2) in second canonical function of QoL in cognitive and role aspects. These relationships indicated that excessive use of projection and reaction formation mechanisms are associated with lower levels of QoL in cognitive and role aspects and the severity of this canonical relationship was 0.69 (Table 3 and Figure 1). Adequacy and redundancy canonical function coefficients are reported in Table 4. Thus, we can conclude that variables load on the first latent variable (defense mechanisms) are more associated with this structure, in comparison with second complex of variable collection or latent variable QoL. A similar argument holds true for latent variable of QoL. In canonical function 1, adequacy coefficient of latent variable of QoL, was 0.312, while the redundancy coefficient was 0.198 (Table 4).
Table 1.Mean, Standard Deviation and Zero-Order Correlation Between Dimension of Defense Mechanisms and Quality of Life
| Variables | Mean | Std. Deviation | Physical | Role | Emotion | Cognition | Social | Fatigue | Nausea and Vomiting | Pain | dyspnea | insomnia | Appetite Loss | Constipation | Diarrhea | Financial Difficulties | QO1 |
|---|---|---|---|---|---|---|---|---|---|---|---|---|---|---|---|---|---|
| Repression | 2.67 | 0.46 | -0.01 | -0.2a | -0.05 | -0.03 | -0.05 | 0.21 a | 0.14 | 0.16 | 0.04 | 002 | 0.2 a | 0.07 | 0.07 | 0.07 | -0.15 |
| Compensation | 2.64 | 0.54 | -0.04 | -0.23 a | -0.20 | -0.01 | -0.22 a | 0.23 a | 0.22 a | 0.19 a | 0.07 | 0.20 a | 0.13 | -0.04 | 0.01 | 0.13 | -0.22 |
| Identification | 2.67 | 0.55 | 0.01 | -0.15 | -0.14 | -0.12 | -0.04 | 0.17 | 0.10 | 0.22 a | -0.04 | 0.15 | 0.14 | 0.20 | -0.01 | 0.03 | -0.12 |
| Introjection | 2.99 | 0.63 | -0.07 | -0.17 | -0.009 | -0.06 | -0.10 | 0.17 | 0.10 | 0.22 a | 0.12 | 0.20 a | -0.05 | 0.04 | -0.01 | 0.05 | -0.05 |
| Projection | 2.29 | 0.62 | -0.13 | -0.36b | -0.25 a | -0.26 a | -0.26 b | 0.3 b | 0.21 a | 0.33** | 0.19 | 0.19 | 0.08 | 0.28 b | 0.25 a | 0.35 b | -0.28 |
| Rationalization | 2.59 | 0.51 | -0.09 | -0.13 | -0.21 a | -0.21 | -0.11 | 0.23 a | 0.19 | 0.15 | 0.19 | 0.36 b | 0.19 | 0.10 | 0.01 | 0.05 | -0.07 |
| Reaction formation | 2.93 | 0.70 | -0.23 a | -0.38 b | -0.24 a | -0.38 b | -0.33 b | 0.34 b | 0.16 | 0.32 b | 0.21 a | 0.26 a | 0.12 | 0.19 | -0.02 | 0.34 b | -0.31 |
| Regression | 2.43 | 0.65 | -0.12 | -0.31 b | -0.41 b | 0.23 a | -0.20 a | 0.35 b | 0.26 a | 0.29 b | 0.13 | 0.15 | 0.16 | 0.21 a | 0.02 | 0.29 b | -0.31 |
| Displacement | 2.11 | 0.71 | -0.19 | -0.40 b | -0.39 b | -0.17 | -0.40 b | 0.39 b | 0.12 | 0.39 b | 0.05 | 0.33 b | 0.12 | 0.25 a | -0.02 | 0.31 b | -0.31 |
| Denial | 2.43 | 0.58 | -0.03 | -0.21 a | -0.03 | -0.17 | -0.01 | 0.13 | 0.05 | 0.13 | 0.03 | 0.13 | -0.05 | 0.14 | 0.08 | 0.16 | -0.01 |
| Fancy | 2.90 | 0.88 | -0.15 | -0.25 a | -0.26 b | -0.23 a | -0.28 b | 0.25 a | 0.31 b | 0.20 a | 0.12 | 0.15 | 0.17 | 0.14 | -0.02 | 0.27 b | -0.20 |
| Sublimation | 2.21 | 0.67 | -0.022 | -0.25 a | -0.11 | -.002 | -0.17 | 0.16 | 0.12 | 0.18 | 0.03 | 0.11 | 0.06 | 0.08 | 0.01 | 0.08 | 0.02 |
| Itysteria | 2.88 | 0.69 | -0.29 b | -0.26 b | -0.50 b | -0.27 b | -0.34 b | 0.46 b | 0.15 | 0.43 b | 0.16 | 0.43 b | 0.29 b | 0.22 a | -0.06 | 0.44 b | -0.33 |
| Intellectualization | 3.96 | 0.51 | -0.14 | -0.02 | 0.07 | 0.01 | -0.09 | 0.04 | 0.01 | 0.00 | 0.06 | 0.06 | 0.05 | -0.02 | 0.01 | 0.01 | -0.01 |
| Mean | - | - | 77.22 | 82.98 | 61.97 | 78.99 | 82.11 | 35.06 | 7.11 | 31.77 | 18.40 | 32.98 | 13.88 | 15.62 | 6.25 | 28.77 | 59.46 |
| Std. deviation | - | - | 14.91 | 22.16 | 24.71 | 23.35 | 23.35 | 22.81 | 13.62 | 24.67 | 28.14 | 31.89 | 23.52 | 24.63 | 16.26 | 33.54 | 21.03 |
a P < 0.05
b P <0.001
Table 2.Multivariate Tests for Canonical Models of Defense Mechanisms and Quality of Life
| Function | Canonical Correlation | Eigen Value | Wilks’ Lambda | Chi-SQ | df | P |
|---|---|---|---|---|---|---|
| 1 | 0.796 | 0.633 | 0.023 | 297.33 | 210 | 0.001 |
| 2 | 0.695 | 0.483 | 0.063 | 218.17 | 182 | 0.035 |
| 3 | 0.613 | 0.376 | 0.122 | 166.1 | 156 | 0.275 |
| 4 | 0.564 | 0.318 | 0.196 | 128.92 | 132 | 0.559 |
| 5 | 0.519 | 0.269 | 0.287 | 98.64 | 110 | 0.773 |
| 6 | 0.457 | 0.209 | 0.393 | 73.88 | 90 | 0.891 |
| 7 | 0.447 | 0.199 | 0.496 | 55.4 | 72 | 0.926 |
| 8 | 0.392 | 0.154 | 0.620 | 37.8 | 56 | 0.970 |
| 9 | 0.344 | 0.118 | 0.732 | 24.59 | 42 | 0.985 |
| 10 | 0.265 | 0.070 | 0.831 | 14.65 | 30 | 0.992 |
| 11 | 0.216 | 0.046 | 0.894 | 8.88 | 20 | 0.984 |
| 12 | 0.207 | 0.042 | 0.937 | 5.1 | 12 | 0.954 |
| 13 | 0.137 | 0.018 | 0.979 | 1.64 | 6 | 0.950 |
| 14 | 0.043 | 0.001 | 0.998 | 0.14 | 2 | 0.930 |
Table 3.Metric and Standardized Coefficients of Variables Categorized by Canonical Functions
| Defense Mechanisms | Quality of Life | ||||||||
|---|---|---|---|---|---|---|---|---|---|
| Variable | Function 1 | Function 2 | Variable | Function 1 | Function2 | ||||
| Simple | Standard | Simple | Standard | Simple | Standard | Simple | Standard | ||
| Repression | 0.03 | 0.017 | -0.66 | -0.31 | Physical | 0.008 | 0.12 | -0.003 | -0.04 |
| Compensation | -0.15 | -0.08 | 1.46 | 0.8 | Role | 0.005 | 0.11 | 0.01 | 0.32 |
| Identification | 0.53 | 0.29 | 0.83 | 0.46 | Emotion | 0.02 | 0.54 | -0.03 | -0.88 |
| Introjection | -0.01 | -0.009 | -0.23 | -0.15 | Cognition | -0.008 | -0.18 | 0.02 | 0.66 |
| Projection | -0.3 | -0.19 | -0.86 | -0.54 | Social | 0.005 | 0.1 | -0.007 | -0.15 |
| Rationalization | 0.08 | 0.04 | 0.01 | 0.008 | Fatigue | 0.000 | -0.008 | -0.01 | -0.23 |
| Reaction formation | -0.51 | -0.36 | -1.07 | -0.75 | Nausea and vomiting | -0.01 | -0.18 | 0.03 | 0.53 |
| Regression | -0.12 | -0.08 | -0.25 | -0.16 | Pain | 0.005 | 0.11 | 0.000 | 0.009 |
| Displacement | -0.48 | -0.34 | 0.16 | 0.11 | Dyspnea | -0.002 | -0.06 | -0.01 | -0.47 |
| Denial | 1.19 | 0.7 | -0.55 | -0.33 | Insomnia | -0.005 | -0.15 | 0.01 | 0.32 |
| Fancy | -0.05 | -0.04 | 0.51 | 0.45 | Appetite loss | 0.000 | -0.002 | -0.01 | -0.23 |
| Sublimation | 0.05 | 0.03 | -0.11 | -0.07 | Constipation | 0.003 | 0.07 | -0.01 | -0.25 |
| Itysteria | -1.11 | -0.78 | 0.12 | 0.08 | Diarrhea | 0.014 | 0.23 | -0.02 | -0.45 |
| intellectualization | 0.26 | 0.13 | -0.002 | -0.001 | Financial difficulties | -0.01 | -0.35 | -0.01 | -0.35 |
| - | - | - | - | - | QO1 | 0.006 | 0.11 | 0.004 | 0.08 |
Table 4.Adequacy and Redundancy Coefficients of Latent Variables of Defense Mechanisms and Quality of Life
| Variable | Adequacy Coefficients | Redundancy Coefficients | ||
|---|---|---|---|---|
| Defense Mechanisms | Quality of Life | Defense Mechanisms | Quality of Life | |
| 1 | 0.149 | 0.312 | 0.094 | 0.198 |
| 2 | 0.051 | 0.071 | 0.025 | 0.034 |
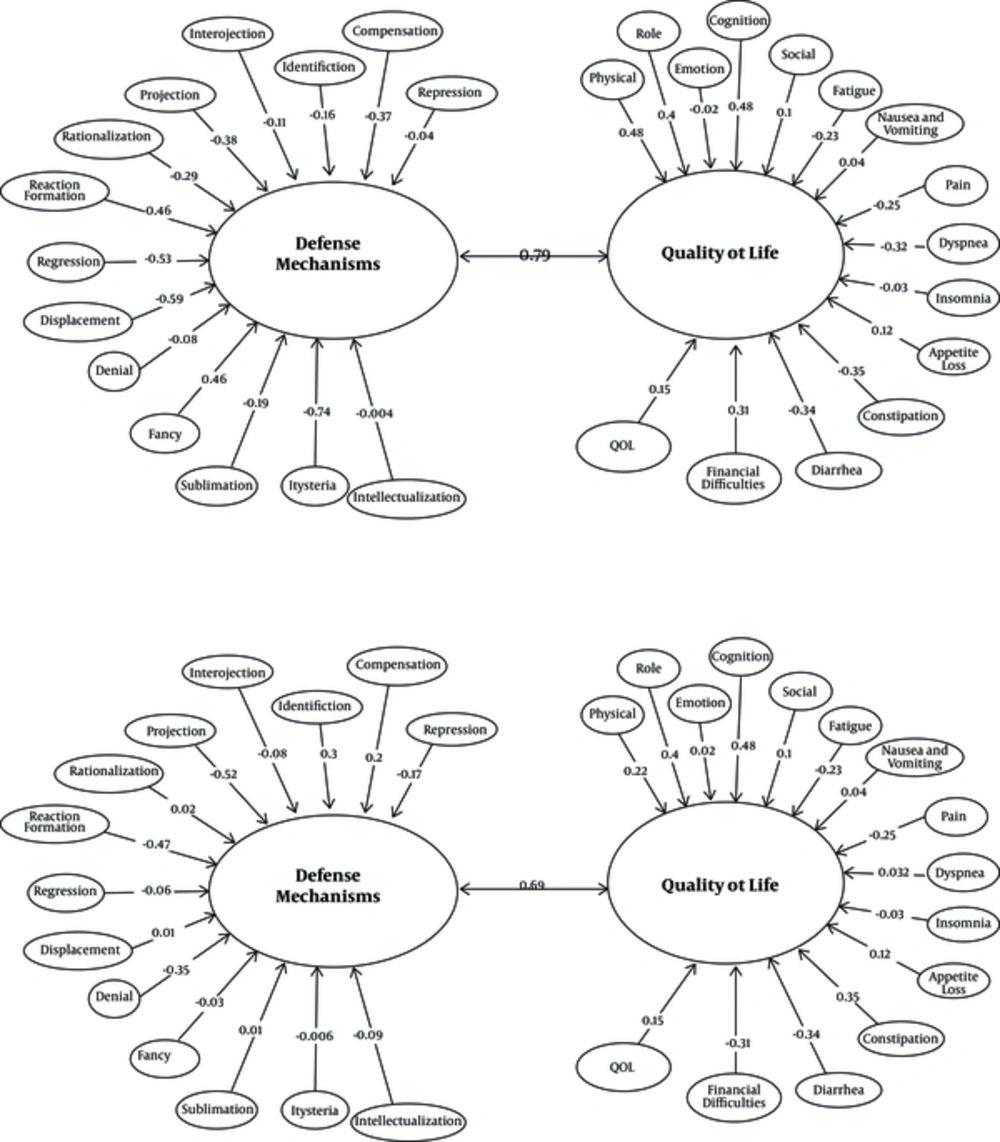
Figure 1.
Final Model of Canonical Relations Defense Mechanism and Quality of Life
4. Discussion
The aim of this study was to investigate the relationship between defense mechanisms in cancer patients and various aspects of their QoL. Findings demonstrated that excessive use of displacement and regression mechanisms are associated with lower levels of QoL in physical, cognitive and role aspects. A possible explanation for this finding is that cancer patients with awareness of their disease and with sense of problem in physical aspect, subconsciously change their emotional investment from their current life and this change is associated with lowering their QoL in cognitive and role dimensions. They try to avoid the anxiety evoked by current level of growth and regression to a lower level of growth performance. A possible explanation for this finding is that incidence of some lower level of growth behaviors in patients with cancer is due to the use of regression defense mechanism. Regression to previous points consolidation associate with behavioral styles that individual has renounced before. This condition usually occurs due to the imbalance in the next stage of growth. Hyphantis et al. (28) reported lower repression scores and improvement in depressive symptoms predicted physical health-related quality of life (HRQoL) improvement. In a study on patients with chronic illness, the researchers concluded that patients showed an immature defense and neurological profile (25). Also, in sciatica patients, the findings showed that exponential action of defense-style and depression with pain related to QoL were correlated and in these patients immature and neurotic defensive profile was diagnosed from defense mechanisms (29). Another finding of this study was that excessive use of reaction formation and projection mechanisms are associated with lower levels of QoL in the cognitive and role aspects. A possible explanation for this finding is that cancer patients with decline in QoL in role and cognitive aspects probably ascribe their express feelings to other emotions such as extreme prejudice, and rejection of intimacy due to suspicions. So it may accuse their relatives regularly because of having these feelings. However, at higher levels of performance, projections may occur in wrong attribution of motives, attitudes, feelings or intentions to others. Also, use of reaction formation mechanism may be shaped in this category of patients. For managing the unacceptable impulses, the possibility of presenting the impulses in contradictory way is provided in reaction formation defense, this defense is equivalent to antithetical demonstration. In this way, the patient may present their momentum with stable personality trait. Some previous evidence confirms these findings. In one study, it was found that the wider use of reaction formation defense mechanisms and high rates of somatization were variants that had the highest correlation with health-related quality of life (30). In patients with chronic mood disorder, emotional defensiveness as a dealing style (consistency) affect the physical and mental aspects of structure of QoL differentially in health aspect (31). In this way, nurses familiar with a variety of defense mechanisms and ways to resolve them could prevent the progressive implementation of these mechanisms which are associated with lower QoL. Understanding the behavior that can be induced by defense mechanisms prepares nurses to behave in a particular way with cancer patients. Behavior with someone who has lost his mental balance is certainly different from the person who is in a state of mental balance. In this way, training nurses about defense mechanisms, particularly those who work in areas related to cancer patients, can play an important role in controlling the QoL of cancer patients.
The first limitation of this study was that the obtained relationship is correlational. Therefore, it cannot make causal inferences. The second limitation is related to the volunteer sample. Findings from volunteer samples cannot be attributed to the population of cancer patients. Another limitation was related to the use of self-report measures. These tools had inherent limitations (measurement error, lack of self- insight in response, etc.). Another limitation was related to confounding variables. Dispersion and the type of cancer can affect the quality of life in varying degrees. Also, severe experienced anxiety can affect the immune system. Accordingly, researchers are suggested to deduce more valid inferences in future studies, to collect and control the possible confounding variables and then to examine multiple relationships of defense mechanisms and the QoL.
Also, it is suggested that this study be repeated on other patients to obtain evidence of development of these relations. Using probability samples can increase generalizability of the study. Therefore, it is suggested that this study be performed in the context of finding programs to determine the generalizability obtained statements.
4.1. Conclusion
The use of defense mechanisms, especially immature defenses are associated with lower levels of QoL in cancer patients. Cancer patients with decline in quality of life probably impute their express feelings to others emotions such as extreme prejudice, and rejection of intimacy due to suspicions. This turn of emotions is associated with lower levels of QoL. Professional caregivers who care for cancer patients should be familiar with psychological defense. Nurses’ familiarity with a variety of defense mechanisms and ways to resolve them could prevent the progressive implementation of these mechanisms. Therefore, regarding psychological factors and defense mechanisms used by cancer patients can help clinical therapists to make a highly effective mental health intervention.

