
1. Background
Upper gastrointestinal endoscopy is one of the outpatient diagnostic and treatment procedures in children. Some applications of this procedure in children comprise investigating and diagnosing the causes of chronic pain, malabsorption, lack of weight gain, iron deficiency anemia in children, and dysphagia (swallowing disorder) or removing a foreign body or dilatation in cases of esophageal stricture or band ligation (1).
Children over 6 months old have significant anxiety due to separation from their parents and entrance into the operating room (2). Therefore, it is recommended to use sedatives and painkillers to reduce anxiety and discomfort, create appropriate sedation, and finally improve the results of this procedure (3, 4).
Considering that children have different physiological responses to pain and anxiety (5), choosing the type of medicine and its dose is of particular importance so that it not only creates good sedation but also brings a short duration of sedation and minimal adverse effects. Therefore, it is possible to discharge the patient a few hours after the endoscopy (6).
At present, the commonly prescribed medicines in this regard are midazolam, propofol, ketamine, and dexmedetomidine (7-10).
Midazolam has antianxiety, sedative, and anticonvulsant properties; however, it is associated with adverse effects such as respiratory depression, behavioral disorder, and drowsiness and alone is not sufficient for patient comfort during endoscopy (11, 12).
Propofol is also a strong sedative with a fast onset of action, short duration of effect, and quick recovery (13, 14). Moreover, it causes mild analgesics and minor adverse effects, including transient hypotension, dose-dependent respiratory depression, and hypoventilation (14).
Ketamine is an N-methyl-D-aspartate antagonist (NMDA) and a phencyclidine derivative, which is known as a dissociative anesthetic agent and causes sufficient analgesia and amnesia (15). In addition, it can be an alternative to opioids because it provides good analgesia in low doses and prevents the respiratory and cardiovascular side effects of opioids. Thus, the use of low-dose ketamine can have acceptable analgesic effects and is associated with the least adverse effects for children (16, 17).
Dexmedetomidine is also a selective α-2 agonist with sedative and analgesic properties, and its most important advantage is that it does not cause respiratory depression (18). Therefore, today, its premedication is increasing (19, 20).
In this regard, the results of some recent reports have indicated that the combination of sedative medicines such as propofol, dexmedetomidine, and ketamine can neutralize the adverse effects of each other and create the best and most effective sedation with the least adverse effects for the patient by prescribing the minimum dose of these medicines (11, 19, 21-24).
Although many studies have compared the sedation and adverse effects of these drugs, few studies have evaluated the administration of these medicines and their combined effects in procedures, such as endoscopy, within the age group of children. More studies are required to be conducted in this regard since this age group is a sensitive and high-risk group and requires anesthesia procedures to be performed with the least adverse effects and safety.
2. Objectives
The present study aimed to evaluate the effect of adding low-dose ketamine to dexmedetomidine and propofol on the quality of sedation and hemodynamic response in children during upper gastrointestinal endoscopy.
3. Methods
3.1. Study Design
The current study was a double-blind randomized clinical trial. The study population included all children who were candidates for upper gastrointestinal endoscopy and referred to Imam Hossein Hospital, Isfahan, in 2021 - 2022.
3.2. Patient Enrollment
From the mentioned population, 52 patients were selected as the sample using the convenience random sampling method considering the confidence level of 95%, the test power of 80%, the SD of the sedation rate after endoscopy in previous studies (19) to be equal to 1, and the minimum significant difference between the 2 groups to be equal to 0.8.
Inclusion criteria were children between 2 and 12 years old who were candidates for upper gastrointestinal endoscopy. Moreover, the patients were not included in the study in case of second- or third-degree atrioventricular block in electrocardiography, slow heart rate (HR), QTc > 550 ms in electrocardiography, severe heart failure, abnormally low blood pressure, liver problems, use of any painkillers and pre-anesthetic drugs, the presence of chronic pain syndromes, and history of sensitivity or allergic reaction to any of the diet therapy drugs.
In addition, the patient was excluded from the study and replaced with another sample in the case of changing the sedation program and the occurrence of medicine sensitivity.
3.3. Randomization, Intervention, and Blinding
After obtaining the code of ethics from the Ethics Committee of Isfahan University of Medical Sciences (code: IR.MUI.MED.REC.1400.683), the clinical trial code (code: IRCT20180416039326N21), and the written consent from the children’s parents, 52 eligible children entering the study were divided into 2 groups of 26 using random allocation software (Figure 1). At the beginning of the study, the children’s demographic information (including their age, gender, and weight) was recorded.
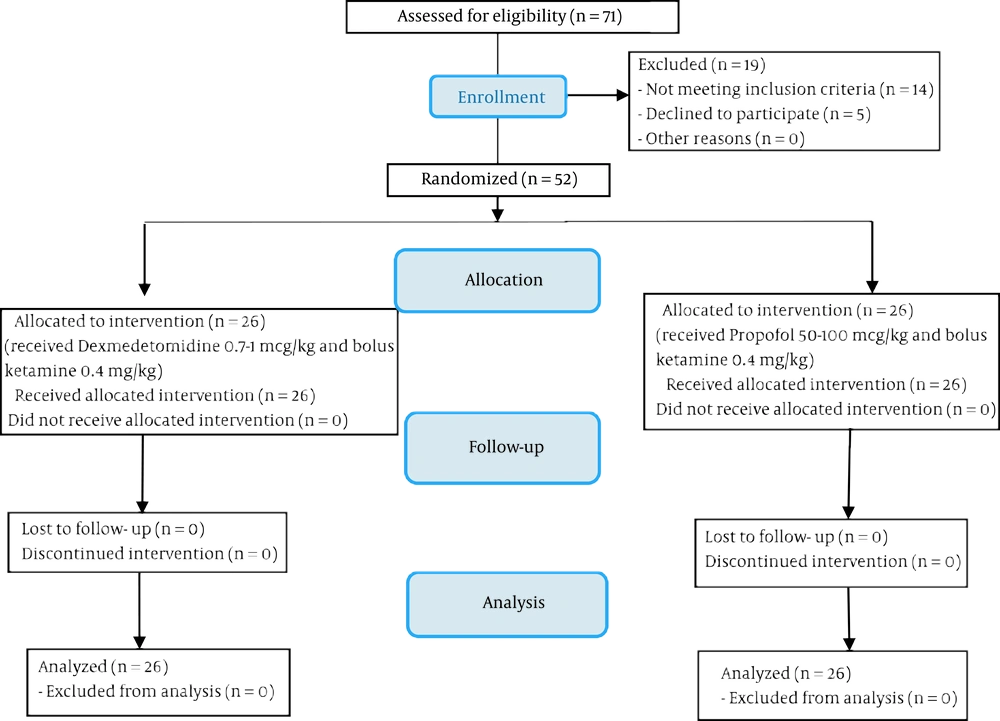
Figure 1.
Consolidated standards of reporting trials flowchart of patients
On the day of performing the endoscopic procedure, all children underwent standard monitoring, including an electrocardiogram (ECG), non-invasive intermittent blood pressure, and pulse oximetry in the operating room. Moreover, patients received oxygen with a flow rate of 4 lit/min through a nasal cannula.
In the first group (Ketadex group), infusion of dexmedetomidine (0.7 - 1 μg/kg) for 10 minutes and ketamine bolus (0.4 mg/kg) for anesthesia induction and then infusion of dexmedetomidine at a rate of 0.5 - 1 μg/kg/h and ketamine at a rate of 0.4 mg/kg/h for anesthesia maintenance were prescribed. In the second group (Ketofol group), infusion of propofol (50 - 100 μg/kg) for 10 minutes and ketamine bolus (0.4 mg/kg) for anesthesia induction and then the infusion of propofol at a rate of 50 μg/kg/h for 30 minutes and ketamine at a rate of 0.4 mg/kg/h for anesthesia maintenance were prescribed.
All children were monitored every 5 minutes using the Ramsay Sedation Scale (RSS) to maintain sedation at level 3.
Moreover, after the completion of the procedure, when the children reached an Aldrete anesthesia score of 9 or 10, they were discharged from recovery and were monitored for at least 2 hours after the completion of the procedure (25, 26).
It should be noted that to comply with the conditions of blinding, propofol, ketamine, and dexmedetomidine were brought to equal volumes by adding normal saline, placed in pre-prepared syringes, and completely enclosed with a cover so that their contents were not identifiable; they were labeled with codes 1, 2, and 3 and provided to the anesthesiologist daily. Without knowing the type of medicine, the anesthesiologist prescribed them according to the specified instructions for each syringe.
3.4. Data Measurement
Patients’ level of sedation specified using RSS (score 1 to 6; Table 1) and hemodynamic parameters, including HR, respiratory rate (RR), oxygen saturation percentage (SpO2), systolic blood pressure (SBP), diastolic blood pressure (DBP), and mean arterial pressure (MAP), were determined and recorded every 5 minutes during the procedure and every 15 minutes during the recovery. Moreover, the duration of the procedure, the recovery time (time interval from stopping the drug infusion to the time the patient was ready for discharge), and adverse effects (including hypoxia, hypotension, cough, tachycardia, bradycardia, agitation, shivering, nausea, and vomiting) during the procedure and recovery were recorded.
Table 1.
Ramsay Sedation Score a
| RSS | Score |
|---|---|
| Anxious and agitated | 1 |
| Cooperative, tranquil, oriented | 2 |
| Responds only to verbal commands | 3 |
| Asleep with brisk response to light stimulation | 4 |
| Asleep without response to light stimulation | 5 |
| Not responsive | 6 |
Abbreviation: RSS, Ramsay Sedation Score.
a Source: Ramsay et al. (27)
The endoscopist’s satisfaction was evaluated and recorded at the end of the procedure using a 5-point Likert scale (1 = completely dissatisfied to 5 = completely satisfied).
3.5. Statistical Analysis
The collected data were analyzed using SPSS version 26 (SPSS Inc, Chicago, IL, USA). The data are presented as mean, SD, frequency, and percentage frequency at the level of descriptive statistics. At the level of inferential statistics, according to the Kolmogorov-Smirnov test indicating the normal distribution of data, the independent samples t test, repeated measures analysis of variance (ANOVA), and chi-square test were used to compare the mean of quantitative variables between the 2 groups, compare the change of the mean of quantitative variables over time in each of the groups, and compare the frequency distribution of qualitative variables, respectively. In all analyses, a significance level of less than 0.05 was considered.
4. Results
The Ketadex group comprised 11 (42.3%) female and 15 (57.7%) male patients with a mean age of 7.19 ± 3.81 years, and the Ketofol group consisted of 8 (30.8%) females and 18 (69.2%) males with the mean age of 6.92 ± 3.91 years (P > 0.05; Table 2).
Table 2.
Comparison of Children’s Demographic Characteristics Between the 2 Groups
| Characteristics | Ketadex Group (n = 26) | Ketofol Group (n = 26) | P Value |
|---|---|---|---|
| Age (y) | 7.19 ± 3.81 | 6.92 ± 3.91 | 0.802 b |
| Gender | 0.565 c | ||
| Girl | 11 (42.3%) | 8 (30.8%) | |
| Boy | 15 (57.7%) | 18 (69.2%) | |
| Weight (kg) | 29.17 ± 16.04 | 25.65 ± 16.81 | 0.443 b |
a Values are expressed as mean ± SD or No. (%).
b The significance level of the independent samples t test comparing the mean of the variable between the 2 groups.
c The significance level of the chi-square test comparing the frequency distribution of the variables between the 2 groups.
The evaluation of the hemodynamic parameters during the endoscopic procedure and recovery time between the 2 groups indicated that none of the hemodynamic parameters significantly differed between the 2 groups at the beginning of the study (P > 0.05). In general, the patients’ mean blood pressure (SBP, DBP, and MAP) decreased slightly during and after the endoscopic procedure in the Ketadex group than in the Ketofol group. In detail, the mean SBP at the 10th, 20th, and 30th minutes during recovery and the mean MAP at the 5th and 10th minutes during the procedure and at 10th and 20th minutes during the recovery were significantly higher in the Ketadex group than in the Ketofol group (P < 0.05). The patients’ mean HR at the 5th and 10th minutes during the procedure and at the 10th to 50th minutes during recovery was significantly lower in the Ketadex group than in the Ketofol group (P < 0.05). The respiratory rate and SpO2 at 10th minutes during the procedure were significantly lower in the Ketadex group (14.73 ± 1.19 and 94.73 ± 7.14, respectively) than in the Ketofol group (15.48 ± 1.04 and 98.57 ± 2.43, respectively; P < 0.05). However, these 2 groups were not significantly different from each other in terms of these 2 parameters at other follow-up times (P > 0.05; Table 3).
Table 3.
Comparison of the Mean of Hemodynamic Parameters Between the 2 Groups Over Time a
| Parameters | Ketadex Group (n = 26) | Ketofol Group (n = 26) | P Value b |
|---|---|---|---|
| SBP (mmHg) | |||
| T0 | 111.46 ± 8.43 | 114.65 ± 8.73 | 0.186 |
| T5 | 109.15 ± 21.07 | 100.81 ± 6.05 | 0.058 |
| T10 | 102.36 ± 9.98 | 98.78 ± 6.71 | 0.224 |
| R10 | 104.04 ± 7.64 | 99.27 ± 6.28 | 0.017 |
| R20 | 104.46 ± 7.15 | 100.08 ± 6.06 | 0.021 |
| R30 | 104.46 ± 7.69 | 100.50 ± 6.12 | 0.045 |
| R40 | 105.19 ± 7.90 | 101.71 ± 6.53 | 0.113 |
| R50 | 106.29 ± 6.59 | 104.17 ± 5.71 | 0.483 |
| R60 | 108.00 ± 4.23 | 103.00 ± 4.24 | 0.395 |
| P value c | 0.001 | 0.002 | |
| DBP (mmHg) | |||
| T0 | 74.15 ± 7.05 | 71.19 ± 10.54 | 0.239 |
| T5 | 70.19 ± 8.30 | 65.54 ± 10.74 | 0.087 |
| T10 | 66.00 ± 11.66 | 62.57 ± 10.67 | 0.400 |
| R10 | 68.27 ± 9.41 | 63.62 ± 10.62 | 0.101 |
| R20 | 68.27 ± 9.66 | 63.96 ± 10.31 | 0.126 |
| R30 | 68.08 ± 9.89 | 64.23 ± 10.52 | 0.178 |
| R40 | 68.92 ± 9.45 | 64.81 ± 10.33 | 0.161 |
| R50 | 68.71 ± 8.76 | 67.67 ± 10.11 | 0.805 |
| R60 | 71.86 ± 7.43 | 79.00 ± 4.24 | 0.247 |
| P value c | 0.878 | 0.108 | |
| MAP (mmHg) | |||
| T0 | 99.19 ± 7.43 | 99.85 ± 8.86 | 0.774 |
| T5 | 93.19 ± 6.88 | 89.15 ± 6.80 | 0.038 |
| T10 | 90.09 ± 7.46 | 86.48 ± 7.54 | 0.028 |
| R10 | 91.88 ± 7.49 | 87.00 ± 7.25 | 0.021 |
| R20 | 92.23 ± 7.16 | 87.73 ± 6.86 | 0.025 |
| R30 | 92.04 ± 7.72 | 88.00 ± 6.81 | 0.051 |
| R40 | 92.73 ± 8.01 | 89.33 ± 6.84 | 0.130 |
| R50 | 93.33 ± 6.49 | 91.33 ± 5.75 | 0.502 |
| R60 | 95.57 ± 6.53 | 95.00 ± 4.24 | 0.912 |
| P value c | 0.009 | 0.003 | |
| HR (bpm) | |||
| T0 | 103.46 ± 6.22 | 99.50 ± 11.74 | 0.135 |
| T5 | 100.58 ± 9.80 | 106.54 ± 11.46 | 0.049 |
| T10 | 98.91 ± 8.55 | 107.91 ± 11.90 | 0.032 |
| R10 | 99.46 ± 9.42 | 106.69 ± 13.23 | 0.028 |
| R20 | 97.42 ± 9.79 | 105.04 ± 13.29 | 0.023 |
| R30 | 96.73 ± 9.81 | 103.27 ± 12.44 | 0.040 |
| R40 | 94.85 ± 9.92 | 102.71 ± 12.95 | 0.023 |
| R50 | 94.10 ± 8.98 | 105.83 ± 12.48 | 0.016 |
| R60 | 93.29 ± 10.19 | 98.00 ± 8.36 | 0.553 |
| P value c | 0.570 | 0.069 | |
| RR (bpm) | |||
| T0 | 20.54 ± 1.82 | 20.92 ± 1.60 | 0.421 |
| T5 | 15.35 ± 1.35 | 15.81 ± 0.98 | 0.166 |
| T10 | 14.73 ± 1.19 | 15.48 ± 1.04 | 0.039 |
| R10 | 16.12 ± 0.99 | 16.23 ± 0.81 | 0.649 |
| R20 | 17.27 ± 0.82 | 17.19 ± 0.89 | 0.749 |
| R30 | 18.04 ± 0.72 | 17.73 ± 0.87 | 0.172 |
| R40 | 18.77 ± 1.03 | 18.29 ± 1.27 | 0.157 |
| R50 | 19.38 ± 0.92 | 19.17 ± 1.60 | 0.675 |
| R60 | 19.43 ± 0.97 | 19.00 ± 1.41 | 0.626 |
| P value c | 0.001 | 0.001 | |
| SpO2 (%) | |||
| T0 | 97.19 ± 2.01 | 96.88 ± 1.77 | 0.564 |
| T5 | 97.73 ± 6.30 | 99.50 ± 0.71 | 0.161 |
| T10 | 94.73 ± 7.14 | 98.57 ± 2.43 | 0.026 |
| R10 | 99.12 ± 1.27 | 98.58 ± 1.92 | 0.240 |
| R20 | 98.92 ± 1.16 | 98.38 ± 1.65 | 0.180 |
| R30 | 98.12 ± 1.42 | 98.23 ± 1.21 | 0.754 |
| R40 | 98.08 ± 1.55 | 97.95 ± 1.46 | 0.780 |
| R50 | 98.19 ± 1.54 | 98.50 ± 1.97 | 0.686 |
| R60 | 98.13 ± 1.64 | 96.00 ± 1.41 | 0.135 |
| P value c | 0.399 | 0.420 |
Abbreviations: SBP, systolic blood pressure; DBP, diastolic blood pressure; MAP, mean arterial pressure; HR, heart rate; RR, respiratory rate; T0, baseline; T5, 5th minute during the procedure; T10, 10th minute during the procedure or at the end of the procedure; R10, 10th minute after endoscopy; R20, 20th minute after endoscopy; R30, 30th minute after endoscopy; R40, 40th minute after endoscopy; R50, 50th minute after endoscopy; R60, 60th minute after endoscopy or at the time of discharge from recovery.
a Values are expressed as mean ± SD.
b The significance level obtained from the independent samples t test to compare the variable mean between the 2 groups.
c The significance level obtained from the repeated measure analysis of variance to compare the variable mean in each group over time (time effect).
Moreover, although the patients’ level of sedation was slightly higher in the Ketadex group than in the Ketofol group, no significant difference was found between the 2 groups in any of the follow-up times (P > 0.05; Table 4 and Figure 2).
Table 4.
Comparison of the Mean of Ramsay Sedation Score Between the 2 Groups Over Time
| RSS | Ketadex Group (n = 26) | Ketofol Group (n = 26) | P Value |
|---|---|---|---|
| T0 | 2 [1 - 3] | 2 [1 - 3] | 1.000 |
| T5 | 6 [6 - 6] | 6 [5 - 6] | 0.322 |
| T10 | 6 [5 - 6] | 6 [5 - 6] | 0.971 |
| R10 | 6 [5 - 6] | 6 [5 - 6] | 0.561 |
| R20 | 6 [5 - 6] | 6 [4 - 6] | 1.000 |
| R30 | 5 [3 - 5] | 5 [3 - 5] | 0.116 |
| R40 | 4 [4 - 5] | 4 [3 - 5] | 0.244 |
| R50 | 4 [4 - 5] | 4 [3 - 5] | 0.517 |
| R60 | 2 [2 - 4] | 2 [1 - 4] | 0.865 |
Abbreviations: RSS, Ramsay Sedation Scale; T0, baseline; T5, 5th minute during the procedure; T10, 10th minute during the procedure or at the end of the procedure; R10, 10th minute after endoscopy; R20, 20th minute after endoscopy; R30, 30th minute after endoscopy; R40, 40th minute after endoscopy; R50, 50th minute after endoscopy; R60, 60th minute after endoscopy or at the time of discharge from recovery.
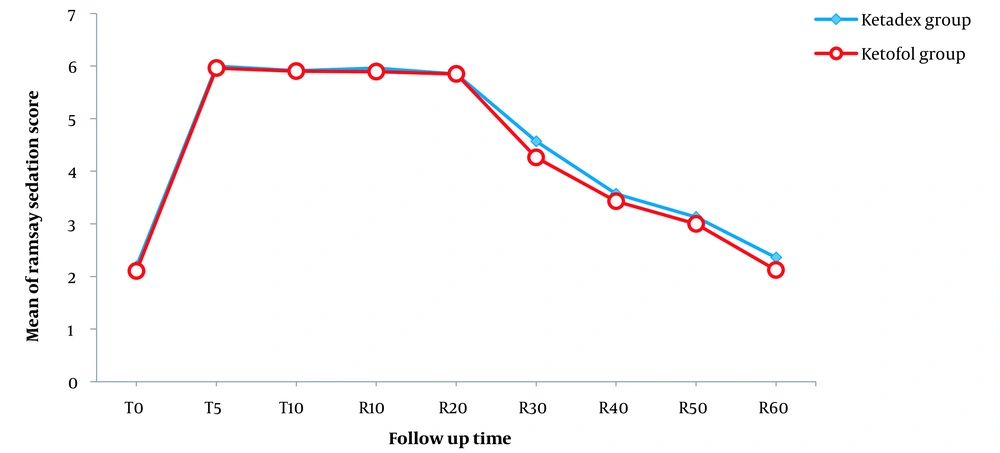
Figure 2.
Linear graph of the Ramsay Sedation Scale (RSS) mean in follow-up times between the 2 groups. Abbreviations: RSS, Ramsay Sedation Scale; T0, baseline; T5, 5th minute during the procedure; T10, 10th minute during the procedure or at the end of the procedure; R10, 10th minute after endoscopy; R20, 20th minute after endoscopy; R30, 30th minute after endoscopy; R40, 40th minute after endoscopy; R50, 50th minute after endoscopy; R60, 60th minute after endoscopy or at the time of discharge from recovery
The recovery time was significantly longer in the Ketadex group (55.12 ± 7.55 minutes) than in the Ketofol group (41.85 ± 7.03 minutes; P < 0.001). The frequency distribution of the adverse effects and the mean of the endoscopist’s satisfaction level were not significantly different between the 2 groups (P > 0.05; Table 5).
Table 5.
Comparison of Adverse Effects, Recovery Time, and Satisfaction Score Between the 2 Groups
| Variables | Ketadex Group (n = 26) | Ketofol Group (n = 26) | P Value |
|---|---|---|---|
| Adverse effects | 0.508 | ||
| Oxygen desaturation | 4 (15.4) | 2 (7.7) | |
| Hypotension | 3 (11.5) | 3 (11.5) | |
| Tachycardia | 2 (7.7) | 6 (23.1) | |
| Bradycardia | 2 (7.7) | 0 (0) | |
| Nausea and vomiting | 0 (0) | 1 (3.8) | |
| Shivering | 0 (0) | 0 (0) | |
| Cough | 0 (0) | 0 (0) | |
| Agitation | 0 (0) | 0 (0) | |
| Procedure time (min) | 20.65 ± 12.36 | 21.63 ± 10.30 | 0.311 |
| Recovery time (min) | 55.12 ± 7.55 | 41.85 ± 7.03 | < 0.001 |
| Satisfaction | 4.65 ± 0.94 | 4.77 ± 0.65 | 0.608 |
5. Discussion
The results of the present study indicated that the administration of ketamine and dexmedetomidine combination (Ketadex) was associated with a lower blood pressure decrease than the administration of ketamine and propofol combination (Ketofol) during and after the children’s endoscopic procedure. In fact, the blood pressure was higher in the Ketadex group than in the Ketofol group, while the children’s HR was significantly lower in the Ketadex group than in the Ketofol group. The RR and SpO2 factors were not significantly different between the 2 groups over the majority of follow-up times.
Amer et al. conducted a similar study on the effect of adding ketamine to dexmedetomidine and propofol during gastrointestinal endoscopy in children, finding that hemodynamic parameters did not differ significantly between the Ketofol and Ketadex groups (24). However, the mean SpO2 was higher in the Ketofol group than in the Ketadex group (24). The results of another study indicated that the rate of bradycardia was significantly higher in the Ketofol group than in the dexmedetomidine group (6). Tosun et al. revealed that HR was significantly higher in the Ketadex group than in the Ketofol group (28). Azizkhani et al. showed that the mean of PR, MAP, and SpO2 was not significantly different between the Ketadex and Ketofol groups (10).
Additionally, Joshi et al. reported a similar reduction in HR in the Ketadex group (29). Although the reduction was more in the Ketadex group than in the Ketofol group, this difference was not statistically significant. The mean SBP and DBP decreased in both groups after induction; however, no statistically significant difference was observed in the mean blood pressure between the 2 groups during the cardiac catheterization procedure (29). Although in our study, SpO2 was not significantly different between the 2 groups, the mean blood pressure and PR were higher and lower in the Ketadex group than in the Ketofol group. The observed difference in the results may be attributed to different follow-up times and procedures performed for children.
Morray et al. evaluated the hemodynamic effects of ketamine in children with congenital heart disease and concluded that hemodynamic changes after administration of ketamine in children undergoing cardiac catheterization were minor and did not change the patients’ clinical status or the information obtained from cardiac catheterization (30).
It is noteworthy that the drug dose can affect the patient’s hemodynamic status and recovery time. Ketamine at a dose of 1 or 2 mg/kg/h, along with dexmedetomidine (1 μg/kg) or propofol (1 mg/kg), was prescribed in the cardiac catheterization procedure (28-30), or ketamine at a dose of 1 mg/kg/h, along with dexmedetomidine (0.5 μg/kg) or propofol (100 μg/kg), was prescribed during dressing changes in the pediatric burn patients (31). In the present study, ketamine at a minimum dose of 0.4 mg/kg for anesthesia induction and 0.4 mg/kg/h for anesthesia maintenance, along with dexmedetomidine (0.7 - 1 μg/kg) or propofol (50 - 100 μg/kg) was prescribed. In fact, the combined dose of drugs was lower in our study than in many other studies.
Some recent reports have shown that the combination of sedatives (such as propofol and ketamine) can be safe and effective (32). Propofol, with its antiemetic and antianxiety properties, neutralizes the effects of vomiting and emergency reactions of ketamine. Moreover, the sympathomimetic effects of ketamine neutralize the propofol-induced decrease in blood pressure (33).
Furthermore, dexmedetomidine can effectively and safely reduce not only the hemodynamic blood pressure reaction caused by ketamine but also the psychological effects of ketamine (19). In fact, dexmedetomidine is expected to prevent tachycardia, high blood pressure, sialorrhea, and the emergence phenomenon associated with ketamine. Ketamine may prevent the bradycardia and hypotension reported with dexmedetomidine (34).
It should be noted that although ketamine has an excellent safety profile, it is contraindicated in children younger than 3 months of age due to concerns about airway complications. On the other hand, there was no increase in side effects at the age of more than 1 year. Therefore, it can be stated that the combined use of ketamine with dexmedetomidine or propofol results in the attainment of sedation with lower doses of each drug; as a result, it is associated with less toxicity and faster recovery time (35).
In this regard, the findings of the present study revealed that there was no significant difference in the incidence of adverse effects, the mean procedure time, and the endoscopist’s satisfaction level following the use of both drug combinations. Moreover, there was no significant difference in the sedation induction; however, the recovery time was significantly longer in the Ketadex group than in the Ketofol group.
In line with the findings of the present study, Tosun et al. investigated these 2 drug combinations for sedation of children undergoing cardiac catheterization and showed that the recovery time was longer in the dexmedetomidine-ketamine combination group than in the propofol-ketamine combination group; however, there was no preference for one of them in the induction of sufficient sedation (28).
In addition, Xu et al. stated that both esketamine-propofol and dexmedetomidine-propofol administration produced the same sedation for pediatric patients undergoing 3 Tesla (T) magnetic resonance imaging (MRI), though esketamine-propofol sedation reduced the need for propofol without increasing side effects (36). Another study in children undergoing gastrointestinal endoscopic procedures also showed that post-procedure nausea and vomiting were less in the Ketofol group than in the Ketadex group; however, there was no difference in endoscopic satisfaction between the 2 groups (24).
Vázquez et al. indicated that the recovery time was shorter and patient satisfaction was higher in the dexmedetomidine group than in the control group (37), which is in line with the findings of the present study, though our study addressed the endoscopist’s satisfaction level. Some other studies have also found that dexmedetomidine has lower respiratory adverse effects and respiratory depression than midazolam and propofol (38, 39).
Another study also indicated that the recovery time was longer in the Ketadex group than in the Ketofol group. None of the groups had adverse effects, such as bradycardia, decreased oxygen saturation, blood pressure requiring treatment, convulsions, larynx spasms, restlessness, hiccups, chills, increased oral secretions, nausea, and vomiting (29). Similarly, rare adverse effects (including oxygen desaturation, hypotension, tachycardia, nausea, and vomiting) were reported in our study, and only 2 patients suffered from bradycardia in the Ketadex group.
It should be noted that attention to the age group of children and the use of the minimum doses of the combined sedation drugs in common outpatient diagnostic and treatment procedures in children can be among the strengths of this study. However, the small sample size, the lack of comparison between different drug doses, and the lack of comparison between the effects of each drug alone and drug combinations can be limitations of the present study. Therefore, it is suggested to conduct future studies with special attention to the evaluation of the effects of prescribing each of these drugs alone and in combination with ketamine and other procedures in children.
5.1. Conclusions
The combination of propofol with low-dose ketamine was associated with a shorter recovery time than the combination of dexmedetomidine with low-dose ketamine following children’s upper gastrointestinal tract endoscopy. However, the 2 studied combinations did not differ significantly in terms of the level of sedation, incidence of adverse effects, procedure time, and endoscopist’s satisfaction level.