
1. Background
One of the critical factors in early rehabilitation after surgery is postoperative pain (1). Although opioids used to be a primary option for pain control, complications, such as respiratory depression and ileus, have led to using other drugs with fewer side effects (2).
There are well-established reports on the importance of pain control in the rehabilitation process and the reduction of morbidity related to thoracic surgery (1, 3, 4). Controlling pain after thoracotomy can lead to improved lung function after surgery. Therefore, adequate pain management plays a crucial role in reducing pulmonary complications and stress response. Pain related to thoracotomy incision is severe and intense due to tissue damage to the ribs, muscles, and peripheral nerves. Although multiple analgesic techniques have been described to relieve postoperative thoracotomy pain, clinicians still face challenges in managing pain associated with thoracotomy.
Nonsteroidal anti-inflammatory drugs (NSAIDs) work by inhibiting the cyclooxygenase enzyme and are effective in attenuating pain. Ketorolac is an example of a parenteral form of NSAID that has been shown to be useful for intercostal and epidural analgesia (5). Ketorolac and apotel are alternative options for postoperative pain management with fewer side effects (6, 7).
2. Objectives
Despite various pain management options, there is still a significant knowledge gap regarding the optimal choice of medication for postoperative pain management. This study aimed to compare the analgesic effects of ketorolac plus apotel to meperidine after surgery through a randomized controlled trial design. This study is of great nobility and importance as it seeks to provide evidence-based guidance on the best analgesic option for postoperative pain management. The study’s findings will help bridge the gap in knowledge by providing clinicians with a better understanding of the relative efficacy and safety of ketorolac plus apotel and meperidine for postoperative pain management. Finally, this study will contribute to improving patient outcomes and satisfaction by enabling clinicians to make informed decisions regarding pain management after surgery.
3. Methods
3.1. Study Design and Eligibility
This study was conducted as a single-center randomized clinical trial with a total of 122 adult cases referred to Ghaem Hospital, a tertiary referral hospital, in Mashhad, Iran, and eligible for right thoracotomy surgery. The trial was registered in the Iranian Registry of Clinical Trials under the clinical trial code IRCT20210921052538N1 (https://www.irct.ir/trial/58861). The protocol was approved by the Research Ethics Committees of the Faculty of Medicine, Mashhad University of Medical Sciences, Mashhad, Iran, with an ID number of IPR.MUMS.MEDICAL.REC.1400.397.
3.2. Patient Selection
The criteria were an age range of 18-70 years, scheduled to undergo thoracotomy for lung lobectomy, the American Society of Anesthesiologists physical status II, and the ability to provide written informed consent. The exclusion criteria included the inability to provide informed consent, a history of addiction or any chronic painful conditions, coagulation disorders, unstable vertebral and transverse process fractures, allergies to any of the drugs used in the study protocol, age under 18 or over 70 years, comorbid conditions, such as sepsis, kidney failure, serum creatinine more than one and a half times the upper limit of standard, unstable angina, hyperthyroidism, congestive heart failure, or patient refusal.
3.3. Randomization and Blinding
The eligible patients were randomly assigned into two groups, A and B, using the permuted block randomization method. Group A received ketorolac (30 mg) and apotel (1 g), and group B received meperidine (0.5 - 1 mg/kg) at the beginning of recovery. An online website available at https://sealedenvelope.com/simple-randomiser/v1/lists (8) was used to create random blocks with variable sizes of 4 and 6, and each block was sealed. Upon arrival at the operating room, all the patients received standard monitoring and underwent the same anesthesiology protocol. To allocate patients to either group A or B, a block was randomly chosen, and patients were assigned based on the content of the chosen block. This process was repeated for subsequent blocks until the last patient was assigned to each study arm. By assigning the last sheet of the final block, the patients were grouped equally into both study arms. Blinding was achieved using identical syringes labeled with letters A or B based on their contents. The personnel involved in preparing the syringes were not involved in the study. The trial was double-blinded, meaning that the investigators and the patients were unaware of group allocation.
3.4. Outcome Measures
The patient’s blood pressure, oxygen saturation (SpO2), sweating, pulse rate, and pain level were assessed in the recovery room immediately after the surgery, before infusion, and at 30-minute intervals. The pain level was measured using the Numeric Rating Scale (NRS), where the pain is scored on a scale of 0 to 10, indicating no pain and the highest imaginable pain, respectively. The primary outcome measure was the NRS pain score at 30-minute intervals up to 1 hour after surgery.
3.5. Statistical Analysis
The sample size was determined based on a previous study (9) that reported postoperative pain levels at various points after surgery. With a power of 80% and type I error of 0.05, a minimum sample size of 55 patients per group was calculated. In order to compensate for potential dropouts for various reasons, the number of patients in each group was increased to 61. The normal distribution of the data was analyzed by the Kolmogorov-Smirnov test. Parametric data were expressed as mean and standard deviation values. Non-parametric data were expressed as the median and interquartile range (IQR). The Mann-Whitney U test was used for continuous non-parametric variables. A P-value < 0.05 was considered statistically significant. Statistical analysis was carried out using SPSS software (version 26 for Windows. SPSS, Chicago, IL, USA).
4. Results
A total of 122 patients were screened and met the eligibility criteria. All the enrolled patients completed the trial (Figure 1).
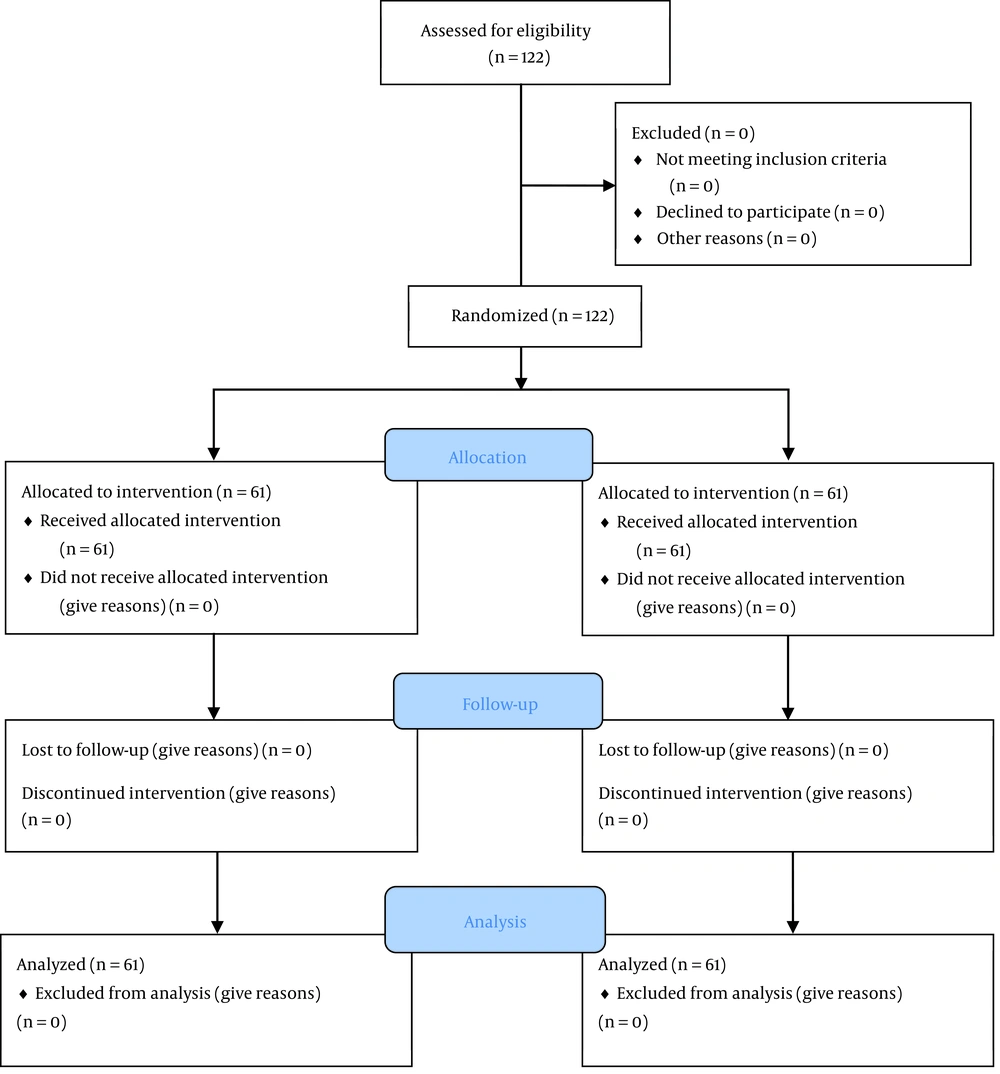
Figure 1.
CONSORT flowchart of study patients
4.1. Demographics Characteristics
In total, 122 patients were evaluated in this study, assigned to the meperidine (n = 61) and apotel/ketorolac (n = 61) groups, respectively. The mean age of the patients was 40.68 ± 14.27 years, and 48% of the subjects were female. The mean of weight, height, body mass index (BMI), and duration of surgery in all patients were 66.62 ± 11.60 kg, 168.26 ± 12.33 cm, 23.59 ± 4.03 kg/m2, and 190.35 ± 56.06 minutes, respectively. There was no statistical difference between the meperidine and apotel/ketorolac groups according to related demographics data, such as age (P = 0.086), weight (P = 0.678), height (P = 0.347), BMI (P = 0.336), and duration of surgery (P = 0.879) (Table 1).
Table 1.
Comparison of Demographic Characteristics of Study Groups
| Groups | Meperidine (n = 61), Mean ± SD | Apotel/Ketorolac (n = 61), Mean ± SD | P-Value a |
|---|---|---|---|
| Age, y | 38.16 ± 13.20 | 43.20 ± 15.01 | 0.086 |
| Weight, kg | 66.06 ± 11.14 | 76.77 ± 12.04 | 0.678 |
| Height, cm | 169.29 ± 12.28 | 167.17 ± 12.40 | 0.347 |
| Body mass index, kg/m2 | 23.24 ± 4.34 | 23.95 ± 3.67 | 0.336 |
| Duration of surgery, min | 193.93 ± 64.12 | 186.64 ± 46.54 | 0.479 |
a Independent t-test was used to compare the groups.
4.2. Pain and Hemodynamic Changes
The median and IQR of the baseline NRS score in recovery was 1 [1 - 3]. Additionally, the median baseline values of hemodynamic parameters, such as systolic blood pressure (SBP), diastolic blood pressure, pulse rate, and SpO2, were 113 (99 - 130) mmHg, 77 (61 - 85) mmHg, 78 (95 - 92) bpm, and 96 (93 - 98). There was a significant difference between the meperidine and apotel/ketorolac groups in the NRS score at the baseline (P = 0.007), 30 minutes after recovery (P = 0.001), and 60 minutes after recovery (P = 0.003), respectively (Table 2).
Table 2.
Comparison of Pain and Hemodynamic Changes of Study Groups
| Groups | Meperidine (n = 61), Median (IQR) | Apotel/Ketorolac (n = 61), Median (IQR) | P-Value a |
|---|---|---|---|
| Numeric Rating Scale score | |||
| Baseline | 1 (1 - 5) | 1 (1 - 1) | 0.007 |
| 30 minutes in recovery | 3 (1 - 4) | 1 (1 - 2) | 0.001 |
| 60 minutes in recovery | 4 (1 - 4.25) | 2 (1 - 3) | 0.003 |
| Systolic blood pressure, mmHg | |||
| Baseline | 117 (97.75 - 130) | 111 (99 - 130) | 0.752 |
| 30 minutes in recovery | 125 (110 - 137) | 111 (106 - 125) | 0.009 |
| 60 minutes in recovery | 118 (94 - 130) | 115 (104 - 127) | 0.826 |
| Diastolic blood pressure, mmHg | |||
| Baseline | 80 (61 - 86) | 76 (61 - 84) | 0.236 |
| 30 minutes in recovery | 77.5 (70 - 85) | 74 (68.5 - 80) | 0.142 |
| 60 minutes in recovery | 73.5 (64.75 - 87) | 77 (65 - 84) | |
| Pulse rate, bpm | |||
| Baseline | 79.5 (64 - 92) | 78 (67.5 - 89) | 0.826 |
| 30 minutes in recovery | 84.5 (68 - 91.25) | 79 (67 - 90.5) | 0.279 |
| 60 minutes in recovery | 74.5 (65 - 92) | 72 (65 - 88.5) | 0.811 |
| Oxygen saturation, % | |||
| Baseline | 94 (91 - 98) | 98 (94 - 99) | 0.001 |
| 30 minutes in recovery | 98 (96 - 99) | 99 (97 - 100) | 0.126 |
| 60 minutes in recovery | 98 (97 - 100) | 99 (97 - 99) | 0.826 |
Abbreviation: IQR, interquartile range.
a Groups are compared using the Mann-Whitney U test.
In evaluating hemodynamic parameters, although SBP did not differ significantly at the baseline (P = 0.752), the mean of SBP after 30 minutes in recovery was higher in the meperidine group (P = 0.009). The SpO2 as another parameter was only significantly higher at the baseline in the apotel/ketorolac group (P = 0.001) (Table 2).
In order to eliminate the effect of the baseline characteristics of individuals in pain assessment, the mean differences of 60 minutes in recovery minus the baseline NRS score and 30 minutes in recovery minus the baseline NRS score were compared between the groups. There was no significant difference between the meperidine and apotel/ketorolac groups in the NRS scores of the baseline and both 30 minutes (P = 0.645) and 60 minutes (P = 0.4480) in recovery (Table 3).
Table 3.
Comparison of Pain and Hemodynamic Differentiation from Baseline in Study Groups
| Groups | Meperidine (n = 61), Mean ± SD | Apotel/Ketorolac (n = 62), Mean ± SD | P-Value a |
|---|---|---|---|
| Numeric Rating Scale score differentiation | |||
| 30 minutes in recovery | 0.33 ± 1.99 | 0.39 ± 1.15 | 0.645 |
| 60 minutes in recovery | 0.88 ± 2.37 | 1.09 ± 1.82 | 0.448 |
| Systolic blood pressure, mmHg | |||
| 30 minutes in recovery | 8.01 ± 20.72 | 1.09 ± 1.82 | 0.026 |
| 60 minutes in recovery | 1.61 ± 23.17 | 2.49 ± 15.5 | 0.595 |
| Diastolic blood pressure, mmHg | |||
| 30 minutes in recovery | 0.17 ± 19.26 | 0.52 ± 13.38 | 0.885 |
| 60 minutes in recovery | -0.20 ± -14.5 | 1.47 ± 14.32 | 0.539 |
| Pulse rate, bpm | |||
| 30 minutes in recovery | 1.67 ± 17.98 | -0.55 ± 11.61 | 0.260 |
| 60 minutes in recovery | -1.58 ± 17.71 | -2.09 ± 15.85 | 0.545 |
| Oxygen saturation, % | |||
| 30 minutes in recovery | 2.64 ± 4.15 | -0.34 ± 11.93 | 0.012 |
| 60 minutes in recovery | 3.53 ± 3.63 | 1.72 ± 2.97 | 0.003 |
Abbreviation: IQR, interquartile range.
a Groups are compared using the Mann-Whitney U test.
In addition, the mean differentiation of SBP was significantly higher in the meperidine group versus apotel/ketorolac at 30 minutes in recovery (P = 0.026). Furthermore, the mean differentiation in both 30 minutes (P = 0.012) and 60 minutes (P = 0.001) in recovery was significantly higher in the meperidine group.
5. Discussion
According to the present study’s results, there was no significant difference between the effectiveness of apotel/ketorolac and meperidine in postoperative pain management after right thoracotomy. There are multiple options to control postoperative pain. Although the intramuscular administration of opioids is a common practice for controlling postoperative pain, it often leads to serious complications, such as respiratory depression, addiction, itching, vomiting, dizziness, weakness, and nausea (10). Several studies have investigated the effects of ketorolac on postoperative pain management, with some reporting that its use can lead to appropriate analgesia and reduced prevalence of shivering. Additionally, the combination of ketorolac and other drugs, such as morphine, has been shown to provide longer analgesia than using either drug alone (11-16).
In a similar study by Khezri et al. that evaluated the effect of ketorolac on cesarean section in 150 cases, it was reported that providing a single dose of meperidine and ketorolac immediately after surgery can lead to appropriate analgesia and diminish the prevalence of shivering (17). In another study by Shankariah et al., comparing the effect of intramuscular administration of ketorolac and tramadol, it was demonstrated that although both drugs are effective in pain control, tramadol was more effective than ketorolac (18). A study evaluating the effect of the intrathecal administration of morphine and ketorolac on postoperative analgesia in cases with knee replacement surgery revealed that using both drugs in combination could provide longer analgesia than using them alone (19). Additionally, another study reported that the administration of a single dose of ketorolac after surgery resulted in longer analgesia and decreased usage of drugs such as morphine (20).
The current study also demonstrated that hemodynamic changes were insignificant between ketorolac and meperidine regarding SBP and SpO2 (P > 0.05). The hemodynamic stability related to these drugs could be due to preventing rising blood pressure and pulse rate by reducing pain, fear, and anxiety (17). The main advantage of NSAIDs is their ability to control pain without serious side effects, such as respiratory depression. However, using NSAIDs can be associated with complications, such as coagulopathy, gastrointestinal bleeding, and acute kidney injury (21). Notably, in the present study, the baseline level of SpO2 was significantly lower in the meperidine group, which might be attributed to the respiratory depression effect of opioids. However, the higher mean differentiation from the baseline in the meperidine group might indicate that the respiratory issues caused by meperidine in this condition were short-term and could not lead to serious problems.
Dastan et al.’s findings in their double-blind control trial study on the effects of intravenous ketorolac, paracetamol, and morphine in patients undergoing video‑assisted thoracoscopic surgery indicated that heart rate was higher in ketorolac receivers than the other groups. However, there was no significant difference related to heart rate in the present study (9). This difference could be linked to the difference in the follow-up period, which was shorter in the current study than in Dastan et al.’s study.
One of the strengths of the present study is the direct comparison of two commonly used drugs for pain management. However, this study also has some limitations that need to be considered while interpreting the results. Firstly, the postoperative follow‐up period was relatively short, which might limit the understanding of the long-term effectiveness of the drugs in pain management. Additionally, the present study only compared two drugs and did not consider other available options for pain management, such as opioids, which could provide insight into the most effective and cost-efficient options in the region. Finally, the current study did not document other potential complications that could have informed the overall outcomes of the study and added value to the current findings.
5.1. Conclusions
In conclusion, effective pain management is imperative for the successful rehabilitation of patients after thoracic surgery. This study provides evidence supporting the use of a combination of ketorolac and apotel, which has a slightly better analgesic effect than meperidine in patients undergoing thoracotomy. Pain management is crucial during recovery, and the current study’s findings suggest that administering ketorolac/apotel provides effective analgesia during recovery after thoracic surgery.