
1. Background
In December 2019, a pneumonia outbreak occurred in Wuhan, China. Its origin was initially unknown, but after isolating a new respiratory virus related to SARS-CoV, it was named severe acute respiratory syndrome coronavirus 2 (SARS-CoV-2) (1). This disease infected more than 600 million people and killed more than 6,470,000 people worldwide as of August 2022 (2). Although a continuous effort has been made to find effective medication therapies and vaccines for the treatment and prevention of this disease, which is still ongoing, nutritional strategies to strengthen the immune system for better prevention and treatment and to reduce the complications of this disease are of particular importance (3, 4). The human immune system is the first line of defense against viruses and diseases, and several immune response mechanisms are involved in the body's defense when pathogens attack. Also, nutrition has a great effect on strengthening these immune response mechanisms against pathogens (5).
It has been shown that the risk of mortality and adverse inpatient events in adults with COVID-19 is significantly higher in patients who have nutritional problems or are malnourished (6). Malnutrition or the risk of malnutrition is also associated with excessive inflammation and immunosuppression in coronavirus disease 2019 (COVID-19) patients and may contribute to the progression of the disease and exacerbation of its complications (7). Therefore, nutrients that can potentially increase immunity against COVID-19 and reduce the risk of contracting the disease or the spread of the factors that cause it are of great importance in preventing and treating infected patients (8-10). The nutritional status and diet greatly impact the process of COVID-19, which is mainly due to the bidirectional relationship between the gut microbiota and the lung or the gut-brain axis, which may aggravate clinical outcomes in viral respiratory infections (11). In the infection caused by COVID-19, the integrity of the gut microbiome is lost, the extent of which is related to the severity of the disease. A poor prognosis has been observed in people with underlying diseases whose intestinal permeability is increased, and the diversity of the intestinal microbiome is reduced (12).
Also, the immune function of the human body is highly dependent on specific nutrients in the diet and bioactive compounds in foods (13). Despite the contradictory and limited studies, probiotic fermented dairy products can generally have preventive and ameliorating effects on various pathophysiological disorders in the body (14). Modulation of the gut/lung microbiome due to the immunomodulatory properties of probiotics and prebiotics could be helpful as an adjunct to the prevention/treatment of COVID-19 patients (15). In addition to having nutritional properties, fermented foods, which have been recommended in studies to strengthen the immune system against contracting COVID-19, help strengthen the immune system by helping to digest other foods and increase antioxidant activity (16). Studies have shown that certain fermented foods and probiotics can provide vital microbes with the ability to enhance gut immunity, while prebiotics can improve gut immunity by selectively stimulating normal gut flora microbes (3).
It is also said that the probiotic-enriched foods market, including fermented dairy products, has expanded progressively during the pandemic due to their potential immune-boosting properties (17). Studies have shown that regular consumption of fermented dairy products, including kefir, is likely to improve immune defenses in the gut (18). Kefir is a fermented drink that can be prepared at home cheaply, improving the host's immunity and reducing the possibility of viral infections (19, 20). This product is a widely used traditional fermented dairy product with many complex probiotic and nutritional compounds. Kefir granules contain casein and other milk solids along with yeasts and lactobacilli, which are the distinguishing factors of kefir fermentation and can act as a starter to induce fermentation when combined with fresh milk (21). Available research data show a strong relationship between regular consumption of kefir and improved health; particularly, its effect on improving the immune system and its antiviral effects due to its probiotic strains and bio-functional metabolites have been established (22). As an anti-inflammatory agent, kefir can reduce the expression of IL-6, IL-1, TNF-α, and interferon-γ. Therefore, kefir may be an important inhibitor of the "cytokine storm" to prevent complications of severe COVID-19 (23).
2. Objectives
To the best of our knowledge, no study has assessed the effects of kefir supplementation as a probiotic product on clinical outcomes and inflammatory markers of COVID-19 patients. Given the limited data, we aimed to investigate the effect of kefir consumption on the inflammatory and clinical indicators and hematological indices among COVID-19 patients.
3. Methods
3.1. Study Design and Participants
A clinical trial study (IRCT20221106056423N1) was conducted on 100 patients with confirmed COVID-19 (with positive PCR-test, moderate or severe disease, and ICU admission provided that there was no restriction on the consumption of certain food substances, age of 20 - 60 years, having received two doses of Sinopharm vaccine, and absence of food allergies) admitted to Emam Reza Hospital from February 9, 2022, to March 9, 2022. The study was approved by the Ethics Committee of Aja University of Medical Sciences (IR.AJAUMS.REC.1400.252). The patients were randomly divided into two equal groups: the intervention group consuming 250 cc of milk containing kefir granules (2 - 10%) twice a day for two weeks, and the control group consuming the placebo.
3.2. Kefir Production
Kefir was produced in three stages:
(1) Preparation of equipment and materials: Including kefir granules (1 - 2 kg), fresh cow milk (21 kg per day until the end of the test), containers (fermentation vessel, plastic strainer, and 300 cc bottle), and incubator (environment) with temperature 25°C.
(2) Production process: Kefir was prepared by adding kefir granules (2 - 10%) to milk pasteurized and cooled at 25°C. After a 24-hour fermentation period at 25°C, the granules were separated by filtering through a plastic sieve and washed before the next culture incubation.
(3) Product quality and health control: All kinds of physical, chemical, and sensory properties of kefir production were measured to confirm the health and quality according to the national standard of Iran entitled "Fermented milk - drinkable kefir - characteristics and test methods" under number 11177. After these steps, the product was packed in bottles under hygienic conditions and distributed among the test subjects after refrigeration.
Physical (sensory), chemical, and microbial characteristics of the kefir product produced and used in this study are shown in Table 1.
Table 1.
Physical (Sensory), Chemical, and Microbial Characteristics of the Kefir Product Produced and Used in This Study
| Characteristics and Features | Amount |
|---|---|
| Physical (sensory) and chemical | |
| pH | 4.2 |
| Dry matter without milk fat (%) | 10 |
| Fat (%) | 1.3 |
| Salt (%) | 0.1 |
| Acidity (lactic acid) (%) | 0.98 |
| Ethanol | 0.46 |
| Microbial | |
| Coliforms (CFU/mL) | 0 |
| E. coli | Negative |
| S. aureus - coagulase-positive | Negative |
| Mold and yeast (CFU/mL) | 3.6 × 10² |
| Probiotic strains count (CFU/mL) | 7.3 × 10⁵ |
3.3. Data Collection, Measurement, and Statistical Analysis
The severity and symptoms (dry cough, productive cough, shortness of breath, fever, chills, sore throat, common cold-like symptoms, weakness, myalgia, headache, diarrhea, nausea, and vomiting) of the disease, pulse rate, respiratory rate, axillary temperature, blood oxygen saturation (O2sat), White Blood Cell (WBC) count, neutrophil count, lymphocyte count, hemoglobin (Hb), platelet count, inflammatory indices (ESR, CRP), drug history, underlying diseases, and smoking status, as the main outcomes of the intervention, were evaluated and measured twice, once before and again after the intervention, through clinical examinations and laboratory tests and changes in parameters were calculated.
Chi-square was used to compare qualitative data, and t-test was used to compare quantitative data before and after the intervention by SPSS version 18 software.
4. Results
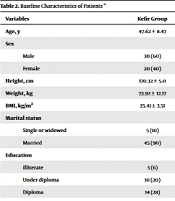
The baseline characteristics of patients are presented in Table 2.
Table 2.
Baseline Characteristics of Patients a
| Variables | Kefir Group | Control Group | P-Value |
|---|---|---|---|
| Age, y | 47.62 ± 8.47 | 46.50 ± 9.36 | |
| Sex | 0.422 | ||
| Male | 30 (60) | 25 (50) | |
| Female | 20 (40) | 25 (50) | |
| Height, cm | 170.32 ± 5.0 | 169.68 ± 3.99 | 0.267 |
| Weight, kg | 73.92 ± 12.17 | 68.72 ± 8.62 | 0.376 |
| BMI, kg/m2 | 25.41 ± 3.51 | 24.81 ± 2.17 | 0.657 |
| Marital status | 0.715 | ||
| Single or widowed | 5 (10) | 3 (6) | |
| Married | 45 (90) | 47 (94) | |
| Education | 0.384 | ||
| Illiterate | 3 (6) | 3 (6) | |
| Under diploma | 10 (20) | 4 (8) | |
| Diploma | 14 (28) | 18 (36) | |
| Higher than diploma | 23 (46) | 25 (50) | |
| Occupation | 0.876 | ||
| Unemployed | 3 (6) | 1 (2) | |
| Employee | 14 (28) | 12 (24) | |
| Self-employed | 29 (58) | 32 (64) | |
| Healthcare worker | 4 (8) | 5 (10) |
Abbreviation: BMI, body mass index.
a All quantitative values are mean± SD. All qualitative values are expressed as No. (%).
Also, PO2 saturation, WBC, and neutrophil significantly increased in the placebo group, but Hb, lymphocyte, and platelet increased in the kefir-treated group (Table 3). Besides, CRP and ESR decreased in the kefir-treated group (Table 3). However, changes in pulse rate, respiratory rate, and axillary temperature were not significantly different between the groups (Table 3).
Table 3.
Inflammatory and Clinical Outcome Indices at Baseline and Two Weeks After the Intervention in Patients Who Received Either Kefir or Non-kefir Product a
| Variables | Before | After | Changes |
|---|---|---|---|
| WBC | |||
| Placebo | 4.86 ± 0.40 | 6.57 ± 0.60 | 1.72 ± 0.33 |
| Kefir | 6.06 ± 0.09 | 6.70 ± 0.72 | 0.63 ± 0.08 |
| P-value | 0.003 | 0.824 | 0.002 |
| Neutrophil | |||
| Placebo | 52.4 ± 1.5 | 63.5 ± 2.3 | 11.1 ± 2.1 |
| Kefir | 64.4 ± 2.2 | 66.0 ± 2.0 | 1.6 ± 0.6 |
| P-value | 0.001 | 0.411 | 0.001 |
| Lymphocyte | |||
| Placebo | 33.7 ± 1.4 | 32.1 ± 1.7 | -0.7 ± 0.4 |
| Kefir | 23.2 ± 0.9 | 26.4 ± 1.2 | 0.4 ± 0.4 |
| P-value | 0.001 | 0.006 | 0.013 |
| Hb | |||
| Placebo | 12.2 ± 0.4 | 12.0 ± 0.4 | -0.13 ± 0.18 |
| Kefir | 13.6 ± 0.2 | 14.4 ± 0.1 | 0.72 ± 0.21 |
| P-value | 0.002 | 0.001 | 0.003 |
| Platelet | |||
| Placebo | 125.0 ± 9.4 | 129.4 ± 8.5 | 4.39 ± 1.96 |
| Kefir | 135.1 ± 9.8 | 142.5 ± 9.1 | 7.40 ± 2.78 |
| P-value | 0.459 | 0.295 | 0.381 |
| CRP | |||
| Placebo | 22.5 ± 2.2 | 23.6 ± 2.3 | 1.01 ± 1.41 |
| Kefir | 30.0 ± 2.3 | 21.9 ± 1.7 | -8.08 ± 0.96 |
| P-value | 0.022 | 0.571 | 0.001 |
| ESR | |||
| Placebo | 53.4 ± 6.2 | 44.6 ± 5.9 | -8.8 ± 3.4 |
| Kefir | 42.8 ± 2.9 | 24.8 ± 1.5 | -18.0 ± 2.2 |
| P-value | 0.121 | 0.001 | 0.025 |
| Pulse rate | |||
| Placebo | 71.4 ± 0.8 | 74.1 ± 1.2 | 2.61 ± 1.01 |
| Kefir | 74.7 ± 1.7 | 77.7 ± 1.4 | 2.92 ± 1.42 |
| P-value | 0.080 | 0.062 | 0.861 |
| Respiratory rate | |||
| Placebo | 19.4 ± 0.3 | 37.3 ± 18.4 | 17.9 ± 18.4 |
| Kefir | 18.7 ± 0.4 | 18.8 ± 0.4 | 0.6 ± 0.51 |
| P-value | 0.313 | 0.582 | 0.331 |
| axillary temperature | |||
| Placebo | 36.9 ± 0.1 | 36.9 ± 0.1 | -0.12 ± 0.08 |
| Kefir | 36.9 ± 0.1 | 36.8 ± 0.1 | 0.12 ± 0.06 |
| P-value | 0.079 | 0.419 | 0.203 |
| PO2 saturation | |||
| Placebo | 94.4 ± 0.3 | 97.0 ± 0.2 | 2.7 ± 0.3 |
| Kefir | 94.2 ± 0.4 | 95.9 0.3 | 1.8 ± 0.3 |
| P-value | 0.692 | 0.003 | 0.018 |
a Data were expressed as mean ± SEM and analyzed by unpaired Student's t-test. P < 0.05 is considered significant.
There were no significant differences between the groups in signs, symptoms, and underlying disease, except for dry cough (Table 4).
Table 4.
Signs, Symptoms, and Underlying Diseases a
| Variables | Kefir Group, No. (%) | Control Group, No. (%) | P-Value |
|---|---|---|---|
| Smoking (yes) | 10 (20) | 7 (14) | 0.595 |
| Medications (yes) | 40 (80) | 33 (66) | 0.176 |
| Dry cough (yes) | 31 (62) | 13 (26) | 0.001 |
| Productive cough (yes) | 19 (38) | 23 (46) | 0.544 |
| Coryza (yes) | 19 (38) | 19 (38) | 1.00 |
| Myalgia (yes) | 11 (22) | 6 (12) | 0.287 |
| Dyspnea (yes) | 10 (20) | 14 (28) | 0.483 |
| Chills (yes) | 10 (20) | 10 (20) | 1.00 |
| Sore throat (yes) | 19 (38) | 27 (54) | 0.160 |
| Weakness (yes) | 14 (28) | 11 (22) | 0.645 |
| Headaches (yes) | 13 (26) | 14 (28) | 1.00 |
| Fever (yes) | 11 (22) | 12 (24) | 1.00 |
| Diarrhea (yes) | 5 (10) | 3 (6) | 0.487 |
| Vomiting & nausea (yes) | 1 (2) | 0 (0) | 1.00 |
| Severity | 0.463 | ||
| Mild | 4 (8) | 7 (14) | |
| Moderate | 39 (78) | 39 (78) | |
| Severe | 7 (14) | 4 (8) | |
| Underlying disease | 0.993 | ||
| Diabetes | 11 (22) | 11 (22) | |
| Hypertension | 10 (20) | 11 (22) | |
| Cancer | 3 (6) | 3 (6) | |
| Cardiovascular | 2 (4) | 2 (4) | |
| Respiratory | 2 (4) | 2 (4) | |
| Kidney | 1 (2) | 1 (2) | |
| Liver | 1 (2) | 0 (0) | |
| Neurologic | 0 (0) | 2 (4) | |
| Others | 1 (2) | 1 (2) |
Abbreviation: BMI, body mass index.
aAll quantitative and qualitative values are mean ± SD and No. (%) and analyzed by independent-samples t-test and chi-square, respectively.
5. Discussion
Viral infection is naturally closely related to the human body's immune system. The good performance of the immune system can help the body destroy foreign microorganisms, control infection, and finally recover (24). Also, SARS-CoV-2 infection can activate innate and compatible immune responses. A fast and coordinated innate immune response is the first defensive line in front of viral infections, whereas uncontrolled innate inflammatory responses and disturbance in adaptive immune responses may result in adverse tissue injuries, both local and systemic (25). In fact, the present studies on the new coronavirus infection have shown that the host's severe and abnormal immune response is a factor in COVID-19 severity (26, 27). Also, WBC and neutrophil counts in the kefir-received group decreased but Hb, lymphocyte, and platelet increased compared to the control group. Moreover, other findings show that COVID-19 patients with the increased WBC count had three times more possibility of getting the disease compared to COVID-19 patients with a normal WBC count (28). So, using this nutrient can decrease the severity of the disease.
The CRP and ESR amounts have decreased meaningfully in the kefir-treated group compared to the control group. As known, CRP is an acute-phase protein that is synthesized by the liver and increases with inflammatory diseases. Severe patients have higher CRP and ESR levels than mild cases (28). Also, Hb increased in the kefir-treated group and decreased in the control group. It is in agreement with Lippi and Mattiuzzi's report that the hemoglobin amounts fundamentally decreased in severe cases of COVID-19 compared with mild cases (29). Platelets significantly increased in the kefir-treated group compared to the control. It has been shown that decreasing Hb is directly related to the severity of COVID-19 (30). So, it can be concluded that the consumption of kefir positively affects the recovery and treatment of COVID-19 patients.
Probiotic bacteria and bioactive compounds found in fermented products (such as kefir) have shown antiviral activity against viruses in the respiratory tract and digestive system via stimulating immune system function by increasing the toxicity of natural killer cells and increasing the production of pro-inflammatory cytokines and cytotoxic lymphocytes such as CD3+, CD16+, and CD56+ (31). Studies have also shown that foods that improve gut microbiota health strengthen the immune system and help protect against viral diseases such as COVID-19. On the other hand, it has been shown that probiotic and prebiotic foods such as kefir strengthen the intestinal microbiota and, in this way, they can boost immunity against COVID-19 (32). Also, lactic acid bacteria in kefir have many beneficial effects on human health, including the modulation of the immune system and intestinal microbiota through various biological mechanisms. Bioactive peptides and metabolic products of kefir have also shown antiviral effects on viral diseases, including COVID-19, and beneficial effects on human health (21).
5.1. Conclusions
Kefir seems to improve inflammatory factors slightly but does not have much effect on improving the symptoms of the disease.