
1. Background
Pneumonia remains a major cause of mortality among children under five years of age, particularly in low- and middle-income countries. The World Health Organization (WHO) estimates that approximately 2,000,000 children under five die each year from community-acquired pneumonia (CAP), with the majority of deaths occurring in developing countries (1, 2). According to previous studies, Streptococcus pneumoniae (pneumococcus) is responsible for 30% to 50% of pneumonia cases (3-5), while Haemophilus influenzae accounts for 10% to 30% (6). However, the role of non-typeable H. influenzae (NTHi) remains relatively underrecognized and is still considered controversial (2).
Between 2003 and 2012, the annual incidence of invasive NTHi disease was reported to be 1.6 cases per 100,000 children under five years old (2). With the global expansion of pneumococcal and Hib vaccination programs, infection patterns have shifted—particularly for Hib, which induces immunity even after a single vaccine dose (7). As a result, Hib is no longer a predominant pathogen, whereas NTHi is gradually becoming more prevalent (8). Recent studies on CAP in children have reported NTHi detection rates ranging from 4% to 26% (9). While NTHi is a well-established cause of pneumonia in adults, its role in pediatric pneumonia remains unclear and is still under debate, particularly in Vietnam (10).
2. Objectives
This study aimed to evaluate the frequency of NTHi as a causative agent in pediatric CAP and to compare the clinical and laboratory characteristics of children with NTHi-associated CAP versus those with CAP caused by other pathogens.
3. Methods
3.1. Study Design and Data Collection
This cross-sectional study investigated 336 children with community-acquired pneumonia (CAP), admitted to Can Tho Children's Hospital—the largest pediatric healthcare center in the Mekong Delta region of southern Vietnam—between June 2020 and June 2022.
The study included children aged between two months and fifteen years who were hospitalized with CAP and met the inclusion criteria. Pneumonia was clinically diagnosed based on WHO guidelines, which require symptoms such as cough or difficulty in breathing, along with at least one of the following clinical signs: Tachypnea, chest wall retraction, or abnormal lung sounds such as hypoventilation or rales (11). All patients were enrolled within 48 hours of hospital admission and had radiographically confirmed pneumonia. Exclusion criteria included hospitalization within the previous 30 days, aspiration pneumonia, or a history of drowning. Nasotracheal aspiration (NTA) samples containing more than 10 squamous epithelial cells and fewer than 25 polymorphonuclear cells per low-power field (100X) were considered of low quality and excluded (2).
The minimum required sample size was calculated using the formula:
where n = sample size, Z = 1.96 for 95% confidence level, P = estimated prevalence of H. influenzae (0.37), and d = margin of error (0.06). These parameters were based on data from Yoshida et al.'s 2010 study in Central Vietnam (12), yielding a minimum sample size of 249. To ensure adequate power and reduce selection bias, 336 consecutive eligible patients were enrolled.
The NTA was performed using a Mucus Extractor (Global Medikit Limited, New Delhi, India). Specimens were transported within 48 hours to the Vietnam Research and Development Institute of Clinical Microbiology in Ho Chi Minh City, which is certified under ISO 9001:2015, ISO 13485:2017, and WHO-GMP standards. Eight low-quality samples were excluded.
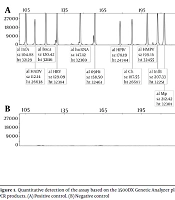
The real-time polymerase chain reaction (PCR) procedure for detecting microbiological agents involved the following steps: (1) Samples were blended with phosphate-buffered saline supplemented with N-acetyl L-cysteine; (2) nucleic acid extraction was performed using the BIO-RAD CFX96 automated system (Hercules, California, USA) (13); (3) extracted nucleic acids were subjected to real-time PCR using specific primers and TaqMan Probes (Thermo Fisher Scientific) along with the NKRNADNAprep-MAGBEAD reagent kit (Nam Khoa Company, Vietnam) to detect and quantify 70 microbial agents (Appendix 1 in the Supplementary File); a PCR result was considered positive when a single pathogen was identified in quantities greater than 105 copies/mL, a threshold previously associated with infection (14).
Demographic data—including age, sex, Hib vaccination status, pneumonia history, and nutritional status—were collected for all eligible patients. Clinical signs and laboratory data, including white blood cell (WBC) count, platelet count, and C-reactive protein (CRP) levels, were compared between children with NTHi-associated CAP and those with CAP due to other pathogens. The highest paraclinical values recorded during hospitalization were used in the analysis.
3.2. Statistical Analysis
Data were analyzed using SPSS version 18.0 for Windows (SPSS Inc., Chicago, IL, USA). Quantitative variables were presented as mean ± standard deviation (SD) or as median and interquartile range (IQR) for non-normally distributed data. Qualitative variables were summarized as frequencies and percentages. The chi-square test was used for categorical variables, while independent t-tests or the Mann-Whitney U test were used for continuous variables, depending on data distribution.
A P-value of < 0.05 was considered statistically significant. Multivariate logistic regression was employed to identify independent predictors of NTHi-associated CAP. Variables with a P-value < 0.1 in univariate analysis were included in the multivariate model. Adjusted odds ratios (ORs) with 95% confidence intervals (CIs) were reported, and statistical significance was defined as P < 0.05.
3.3. Ethical Approval
This study was conducted in accordance with ethical standards emphasizing human dignity, fairness, and welfare. Ethical approval was granted by the Ethics Committee for Biomedical Research at Can Tho University of Medicine and Pharmacy (Can Tho City, Vietnam), under approval number 208/PCT-HĐĐĐ.
4. Results
Between June 2020 and June 2022, nasotracheal aspiration (NTA) samples were collected from 344 pediatric patients diagnosed with community-acquired pneumonia (CAP) and admitted to Can Tho Children's Hospital. Of these, 336 samples met the lower respiratory tract quality criteria, while 8 were excluded due to low quality (>10 squamous epithelial cells or < 25 polymorphonuclear cells per low-power field).
Real-time PCR successfully detected pathogens in 312 out of 336 cases (92.9%). Haemophilus influenzae (all non-typeable strains, NTHi) was identified as the second most common bacterial cause of childhood CAP, with a frequency of 77/336 (22.9%), following S. pneumoniae at 222/336 (66.1%) (Figure 1).
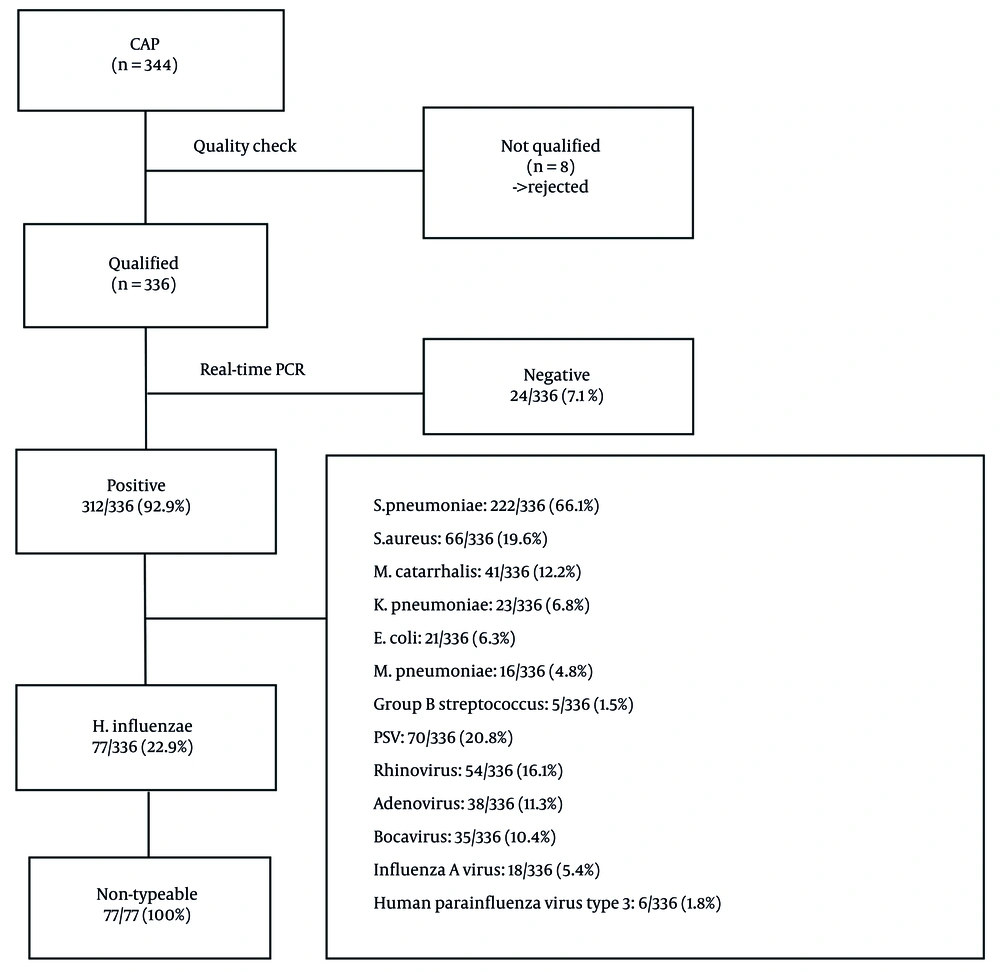
Figure 1.
Study flowchart and pathogen distribution in pediatric community-acquired pneumonia cases (abbreviations: CAP, community-acquired pneumonia; PCR, polymerase chain reaction; RSV, respiratory syncytial virus; MRSA, methicillin-resistant Staphylococcus aureus).
Enrollment and sample exclusion: Among 344 NTA samples collected, 8 were excluded due to poor quality. The remaining 336 samples were analyzed using real-time PCR.
4.1. Pathogen Detection
Streptococcus pneumoniae (66.1%, 222/336) and non-typeable H. influenzae (NTHi; 22.9%, 77/336) were the most prevalent bacterial agents. All H. influenzae isolates were non-typeable. Details of co-infections are shown in Figure 2.
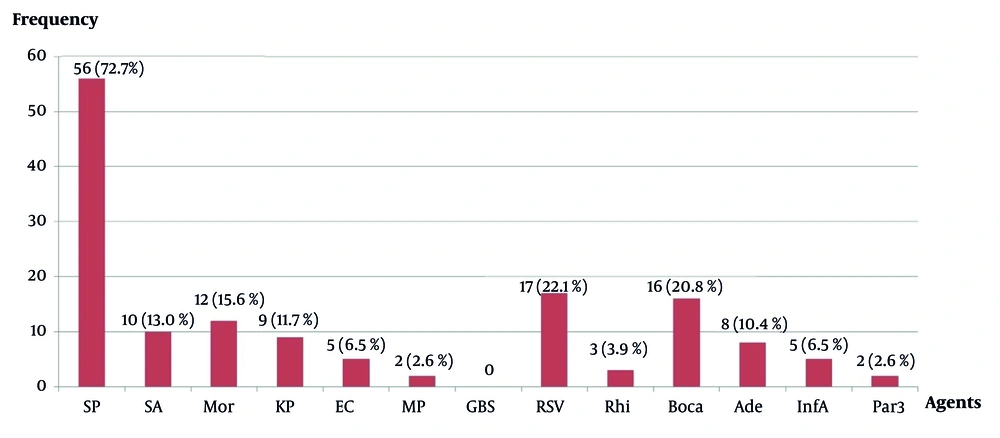
Figure 2.
Non-typeable Haemophilus influenzae co-infection with other agents (n = 77) (abbreviations: SP, Streptococcus pneumoniae; SA, Staphylococcus aureus; Mor, Moraxella catarrhalis; KP, Klebsiella pneumoniae; EC, Escherichia coli; MP, Mycoplasma pneumoniae; GBS, Group B Streptococcus; RSV, respiratory syncytial virus; Rhi, rhinovirus; Boca, bocavirus; Ade, adenovirus; InfA, influenza A virus; Par3, human parainfluenza virus type 3).
The children with CAP had a median age of 17 months. The majority were under two years old (214 cases, 63.7%), followed by those aged two to five years (102 cases, 30.4%), and only 20 children (5.9%) were older than five. The illness was more common in boys (66.7%) than girls (33.3%), with a male-to-female ratio of 2: 1. Hib conjugate vaccination had been administered to 282 of 336 children (83.9%). A total of 69.3% of children had no previous history of pneumonia, while 30.7% had experienced at least one prior episode. Children with acute malnutrition represented a significant proportion (41.7%) (Table 1).
Table 1.
Demographic Characteristics of the Patients (n=336) a
| Variables | Values |
|---|---|
| Age (y) | |
| Median, IQR (months) | 17 (10 - 30) |
| < 2 | 214 (63.7) |
| 2 - 5 | 102 (30.4) |
| > 5 | 20 (5.9) |
| Sex | |
| Male | 224 (66.7) |
| Female | 112 (33.3) |
| Hib conjugate vaccination | |
| Available | 282 (83.9) |
| Not available | 18 (5.4) |
| Not clear | 36 (10.7) |
| History of pneumonia | |
| Never | 233 (69.3) |
| Once | 47 (14.0) |
| More than once | 56 (16.7) |
| Nutritional status | |
| Obesity | 21 (6.3) |
| Overweight | 51 (15.1) |
| Normal nutrition | 124 (36.9) |
| Acute malnutrition | 140 (41.7) |
Abbreviation: Hib, Haemophilus influenzae type b
a Values are expressed as No. (%) unless otherwise indicated.
Among the 77 children diagnosed with NTHi-associated CAP, most had co-infections with other pathogens (96.1%). The most common type was bacterial co-infection (44.1%), followed by viral-bacterial co-infection (39.0%). Only 3 out of 77 children (3.9%) had a single NTHi infection (Table 2).
Table 2.
Distribution of Non-typeable Haemophilus influenzae Infection According to Co-infection – Single Infection (n = 77) a
| Variables | Values | Cumulative Percentage (%) |
|---|---|---|
| Bacterial co-infection | 34 (44.1) | 44.1 |
| Viral-Bacterial co-infection | 30 (39.0) | 83.1 |
| Viral co-infection | 10 (13.0) | 96.1 |
| Single infection | 3 (3.9) | 100 |
a Values are expressed as No. (%) unless otherwise indicated.
The most frequent co-infecting agents with NTHi were S. pneumoniae (56/77, 72.7%), followed by respiratory syncytial virus (RSV) (17/77, 22.1%), Bocavirus (16/77, 20.8%), and Moraxella catarrhalis (12/77, 15.6%) (Figure 2).
Clinically, children with NTHi-associated CAP experienced less tachypnea (81.8% vs. 90.3%) and more frequent diarrhea (20.8% vs. 12.4%) compared to those with CAP caused by other agents. They also had significantly higher white blood cell (WBC) counts (median: 15.1 G/L vs. 13.4 G/L) and C-reactive protein (CRP) levels (median: 14.9 mg/L vs. 11.0 mg/L) (P < 0.05) (Table 3).
Table 3.
Characteristics of Non-typeable Haemophilus influenzae-Associated CAP (n=77) and Other Agent-Associated CAP (n=259) a
| Variables | NTHi-Associated CAP (n = 77) | Other Agent-Associated CAP (n = 259) | P-Value |
|---|---|---|---|
| Symptoms and signs | |||
| Fever | 77 (100) | 259 (100) | NA |
| Cough | 77 (100) | 259 (100) | NA |
| Vomiting | 7 (9.1) | 24 (13.9) | 0.267 |
| Diarrhoea | 16 (20.8) | 32 (12.4) | 0.001 b |
| Tachypnea | 63 (81.8) | 234 (90.3) | 0.004 b |
| Chest indrawing | 40 (51.9) | 155 (59.8) | 0.218 |
| Accessory muscle used | 25 (32.5) | 83 (32.0) | 0.945 |
| Crackles | 68 (88.3) | 235 (90.7) | 0.531 |
| Wheezing | 42 (54.5) | 151 (58.3) | 0.558 |
| SpO2 ≤ 90% | 25 (32.5) | 83 (32.0) | 0.945 |
| WBC count (G/L) | 15.1 (10.8 - 19.3) | 13.4 (9.0 - 17.6) | 0.017 c |
| Platelet count (G/L) | 372.6 ± 119.1 | 362.1 ± 127.6 | 0.763 |
| CRP (mg/L) | 14.9 (7.6 - 45.3) | 11.0 (3.4 - 29.7) | 0.007 c |
Abbreviations: WBC, white blood cell; CRP, C-reactive protein; NA: not applicable.
a Values are expressed as mean ± SD or No. (%) unless otherwise indicated.
b Significant difference using the chi-square statistical test.
c Significant difference using the Mann-Whitney test.
In multivariate logistic regression analysis, only two independent factors were significantly associated with NTHi-associated CAP: reduced tachypnea (OR = 2.21; 95% CI: 1.07 - 4.59) and elevated WBC count (OR = 1.05; 95% CI: 1.00 - 1.10) (Table 4).
Table 4.
Multivariate Logistic Regression Analysis of Factors Associated with Non-typeable Haemophilus influenzae-Associated CAP (n = 336)
| Variables | Odds Ratio (OR) | 95% Confidence Interval (CI) | P-Value |
|---|---|---|---|
| Diarrhoea | 0.55 | 0.27 - 1.13 | 0.11 |
| Tachypnea | 2.21 | 1.07 - 4.59 | 0.033 |
| WBC count (G/L) | 1.05 | 1.00 - 1.10 | 0.042 |
| CRP (mg/L) | 1.00 | 0.99 - 1.01 | 0.61 |
5. Discussion
Between June 2020 and June 2022, 344 nasotracheal aspiration (NTA) samples were collected from pediatric CAP patients at Can Tho Children’s Hospital. Of these, 336 passed quality control and were included in the analysis. Most patients (63.7%) were under two years of age—considered the most vulnerable group to CAP globally (15, 16). Real-time PCR detected respiratory pathogens in 92.9% (312/336) of the samples, demonstrating superior sensitivity compared to traditional cultures. Non-typeable H. influenzae was identified as the second most common pathogen (22.9%, 77/336), following S. pneumoniae (66.1%, 222/336).
According to Global Burden of Disease (GBD) models, bacterial infections—especially S. pneumoniae and H. influenzae type b (Hib)—account for approximately 64% of pneumonia-related deaths in children under five (17). A study from Israel reported that 25% of NTHi infections presented as pneumonia (3). Since 1998, the WHO has recommended the global implementation of Hib conjugate vaccination (18). Following widespread use, pathogen trends have shifted, particularly with Hib, due to its ability to induce immunity even after a single vaccine dose (19, 20). As a result, Hib infections have declined, while NTHi has become increasingly recognized as a significant pathogen. Recent studies suggest the 10-valent pneumococcal vaccine may offer partial protection against NTHi, although definitive evidence is still lacking (6, 21). This potential has laid the groundwork for future vaccine development.
In Vietnam, the Hib vaccine was introduced into the national immunization program in 2010, while the pneumococcal vaccine remains a service-based option. In our study, 83.9% of children had received the Hib vaccine, correlating with the prominence of S. pneumoniae and NTHi as the leading causative agents.
Microbiological co-infection has gained increasing attention in recent years (5, 22, 23). In this study, 96.1% of NTHi-associated CAP cases involved co-infections, primarily bacterial (44.1%), followed by viral-bacterial combinations (39.0%). Non-typeable H. influenzae was most commonly co-infected with S. pneumoniae (72.7%), aligning with existing literature that identifies these pathogens as the primary CAP agents (24). Due to the high effectiveness of the Hib vaccine, NTHi now predominates in H. influenzae co-infections (25). Respiratory syncytial virus was the most common viral co-infecting agent (22.1%), consistent with prior findings (4). Notably, only 3.9% (3/77) of children had a single NTHi infection.
The NTHi infections are more commonly seen in children with underlying conditions such as immunodeficiency or chronic respiratory disease and are rarely reported in otherwise healthy individuals (19). A study from Germany described by Falade et al. found that 62% of NTHi infections were non-acquired (7). In another study which analyzed 250 children with recurrent or unresponsive pneumonia, up to 51% were associated with NTHi (1). An Australian study identified nearly 20 different genotypes of NTHi, reflecting its considerable strain diversity (21).
Although generally less invasive than Hib, some NTHi strains can cause serious illness in neonates and children with comorbidities (6). In this study, children with NTHi-associated CAP had significantly less tachypnea compared to those with other CAP pathogens (81.8% vs. 90.3%, P = 0.004). Recent studies indicate that childhood pneumonia often lacks distinctive physical signs (26). In Vietnam, pneumonia most consistently presents with fever and cough (100%). The NTHi infections were associated with a higher rate of diarrhea (20.8%, P = 0.001). Laboratory markers such as white blood cell (WBC) count and C-reactive protein (CRP) levels are widely used to predict severity and distinguish bacterial from viral infections (27, 28). In our cohort, NTHi-associated CAP was associated with elevated WBC and CRP values compared to other causes.
Multivariate logistic regression identified two independent factors significantly associated with NTHi-related CAP: Reduced tachypnea (adjusted OR = 2.21; 95% CI: 1.07 - 4.59) and elevated WBC count (adjusted OR = 1.05; 95% CI: 1.00 - 1.10), supporting the bacterial etiology and frequent co-infection profile of NTHi.
One limitation of this study is that data were collected from a single center—Can Tho Children’s Hospital—which may limit the generalizability of the findings to other regions with different pathogen distributions and vaccine coverage. Additionally, the clinical impact of co-infections was not analyzed in detail and will be the subject of future investigations.
5.1. Conclusions
The NTHi has replaced Hib as a leading cause of CAP in children. Clinical features such as reduced tachypnea and elevated WBC counts should prompt consideration of NTHi-associated CAP.