1. Background
Advances in micro-electromechanical systems have made the massive use of isoinertial accelerometer units (IAUs) possible in multiple fields, including the measurement of physical activity level (1), motor tasks (2), motor pathologies (2), movement detection (3), motor patterns (4, 5), and sports strategies (6-10). In sports and sport-rehabilitation, one of the most common uses for IAU is jumping assessment. In this sense, IAU currently obtains signals from low cost and easy-transport devices, such as smartphones (5, 11). This technology has demonstrated reliability and validity against photoelectric and force platform systems during vertical jumps (6-9). However, the signal noise (artefacts) generated during biological signals collection with IAU could drastically affect the variability of mechanical outputs obtained from these signals, which is an issue that has not been adequately addressed by the sport science literature. However, bias around 7.2% (8) or overestimated jumping height around 7 cm (6) using accelerometry-based systems is known.
To reduce signal noise or artefacts, a Butterworth filter is commonly used (12, 13). Noise is a source of dispersion, where signals that are insufficiently treated could increase the variability of outputs by non-random error or differences in participants. Currently, during a countermovement jump, IAU can estimate work and power by simple and double integration of the accelerometry signal in accordance with Linthorne’s math (14). When the area under the curve by the sum of multiple trapezoidal areas is estimated, the velocity and position in function of time are obtained by being multiplied by the force signal to obtain the work and power parameters of the jump. The work and power before the flight phase of a countermovement jump (i.e. unweight and propulsion phases) are two relevant mechanical outputs used to assess the efficiency of musculoskeletal performance and training adaptations (15, 16). To adequately assess work and power is critical to find adequate parameters of signal filtering to control the instability of outputs by the uncontrolled variability developed by the noise. Research advancements in this field may be of paramount importance to practitioners and scientists involved in rehabilitation, fitness, and sport-related contexts.
2. Objectives
The objective of this study is to determine the most appropriate (stable) cut-off low pass Butterworth filter parameters for unweight and propulsion phases to treat signals from countermovement jump. The null hypothesis of the study is that there will be no difference between frequencies bands of filters.
3. Methods
3.1. Design and Setting
This cross-sectional study was performed during the health fair “2a Feria Elije Vivir Sano y Sustentable UC,” first basic data such as age, weight, height, and body mass index was measured by the same physical therapist, followed by countermovement jump tests.
Participants performed a 15-min cycle ergometer (Ergoline Gmbh, Bitz, Germany) warm-up and then performed several sub-maximal countermovement jumps until achieving the correct technique, implicating (i) initial bipedal position; (ii) upper limbs over iliac crests; and (iii) vertical ground reaction force generated after the jump with the morphology described by Bosco et al. (17); this included the unweight, propulsive, flight and landing phases, collected with a force platform (Bertec Corporation, OH, USA) embedded at ground level. The accelerometry signals were obtained from an iPhone IV (Apple Inc., Cupertino, CA, USA) attached at the sacrum, as previously described (9, 18). A trained specialist performed jump assessments. Subjects wore their usual athletic shoes during testing. Three maximal vertical jumps were allowed, with 3 minutes of rest between attempts.
3.2. Samples and Sampling
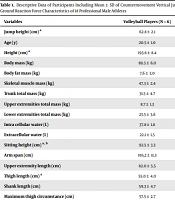
Twenty-seven recreational athletes, 16 healthy college females and 11 healthy college males (Table 1) were selected after considering the inclusion and exclusion criteria of the study. The inclusion criteria were: (i) participant aged between 18 and 25 years old; (ii) performed physical activity at least three times per week for 30 minutes over the previous 6 months; (iii) body mass index between 18.5 and 24.5 m/kg2; and iv) recreational athletes. The exclusion criteria were: (i) history or presence of orthopedic and/or neurologic pathology; (ii) not having slept at least 8 hours over the last two days; (iii) not under medical treatment; and (iv) not under medication or alcohol effects. The exclusion criteria were assessed by the same physician. Each participant signed a written informed consent generated according to the Helsinki declaration. The informed consent was approved by the IRB of the Pontificia Universidad Catolica de Chile.
Table 1
. Characteristics of Participants
| Parameters | Values, Mean ± SD |
|---|---|
| Age, (y) | 20.5 ± 2.0 |
| Height, (m) | 1.72 ± 0.06 |
| Weight, (kg) | 65.1 ± 10.3 |
| BMI, (kg/m2) | 21.9 ± 2.2 |
| Flight time, (s) | 0.43 ± 0.07 |
| Jump height, (cm) | 23.1 ± 7.7 |
Abbreviation: BMI, body mass index.
3.3. Codes of Ethics
Information about the purposes of the study was given to the participants, and they were asked to sign the written informed consent approved by the ethics committee of the health fair, “2a Feria Elije Vivir Sano y Sustentable UC.” The informed consent was generated according to the Helsinki principles.
3.4. Data Collection
The isoinertial signal was obtained from a LIS331DL (STMicroelectronics, USA) accelerometer of iPhone IV (Apple Inc., Cupertino, CA, USA), which had a nominal resolution of 0.018 g and sample rate of 100 Hz. The accelerometry signal captured the orthogonal signals x, y, and z, being oriented to the length, width, and normal-axis of the smartphone, respectively. The isoinertial signal was obtained as the square root of sum of the axis squares as the Euclidean distance (Figure 1).
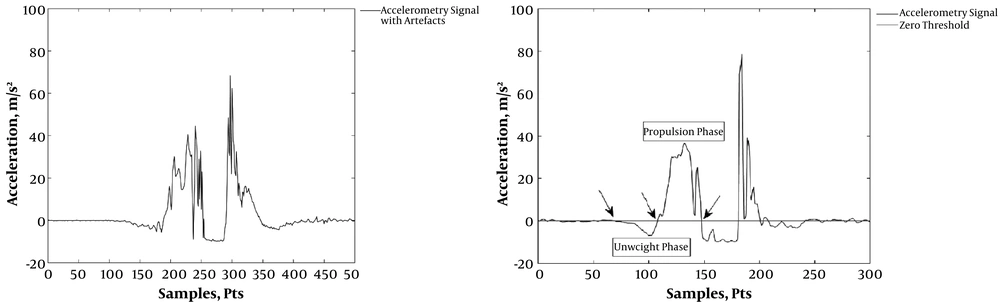
Figure 1.
Isoinertial accelerometry signal obtained from iPhone IV. A, Typical accelerometry raw signal obtained at sacrum during a countermovement jump; the signal contains multiple artefacts (noise). B, Unweight and propulsion phase detection. The intersection between zero threshold and accelerometry signal are showed by arrows.
The raw and filtered isoinertial acceleration signals with cut-off parameters 1 to 20 (Figure 1) of each participant were used to obtain the simple and double integral for unweight and propulsion phase of the countermovement jump through the trapezoidal integral method. The type of filter used for this study was an infinite impulse response low pass Butterworth filter of second degree. Additionally, the flight time and height were calculated using the flight method (14) to describe the sample of the study (Table 1). All estimations were obtained by a custom algorithm based on Linthorne (14) equations, written by CD in MATLAB 2016 software (The Mathworks, Inc., Natick, MA, USA).
3.5. Data Analysis
Descriptive data were reported as mean ± standard deviation. The assumption of normal distribution and homoscedasticity was corroborated using Shapiro-Wilk and Levene’s tests, respectively. One-way ANOVA with repeated measures for frequency bands was performed, with a post-hoc F < 0.05 Bonferronis’ multicomparison.
To choose an adequate filter band suiting the raw signal (noised signal), accounted and individual variability criteria from the level of similitude between signals were considered. For the accounted variability, the Pearson correlation coefficients were obtained selecting the cut-off parameters with very high correlation, i.e. 80 to 90% from correlation coefficients. This means that signals filtered lower than 80% of accounted variability are over noise attenuated with respect to the raw signal and the signals with higher than 90% of accounted variability are very poorly noise attenuated. The individual weights of variance in the simple and double integration during unweight and propulsion phases lower than 5% were considered with two standard deviations relative to normalized distribution with mean zero. Finally, the z-score of simple and double integration during unweight and propulsion phases in function of cut-off filter parameters were generated to see the dispersion to a zero mean of the data.
The correlation coefficients were interpreted according to Munro (19): very low, 0.0 to 0.25; low, 0.26 to 0.49; moderate, 0.50 to 0.69; high, 0.70 to 0.89; very high, 0.90 to 1.0. All analyses were performed using MATLAB 2016 software (The Mathworks, Inc., Natick, MA, USA).
4. Results
The frequency bands in 1 - 7 Hz showed statistical differences with respect to each other with P < 0.001 (Figure 2). This shows the major variance between the band frequencies 1 - 7 Hz versus 8 - 20 Hz. Here the data dispersion of simple and double integrals during the unweight and propulsion phases of the countermovement jump described a region of great dispersion in 1 - 7 Hz, and described a region of divergence (variance increment) after 14 Hz. This generated a stable region when 8 - 13 Hz was chosen (Figure 2).
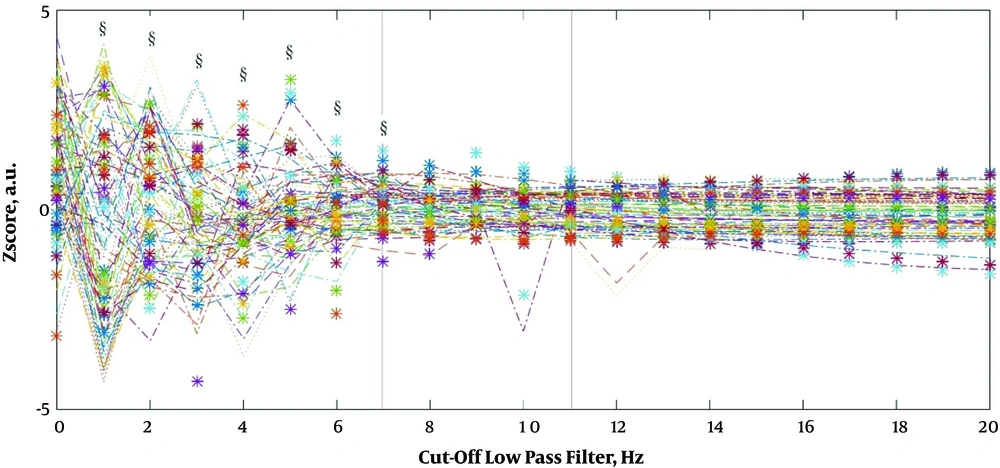
Figure 2.
Dispersion data of simple and double integral during unweight and propulsion phases of countermovement jump obtained from isoinertial accelerometry signals at sacrum level. In -.- line the simple integration of unweight phase; in * the simple integration of propulsion phase; in . . . line the double integration of the unweight phase; and in - - line the double integration of propulsion phase. § P < 0.001 for multiple comparison with respect to the rest of band frequencies.
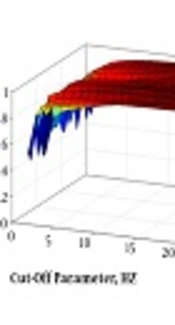
The cut-off low pass interval 8 - 13 Hz generated the 80.8 - 94.5% of accounted variance and individual weight of simple and double integration lower than 5%. The Pearson correlation coefficients between raw and filter signals by cut-off parameter areas are summarized in Figure 3. This shows the relative stabilization of the signal after 7 Hz without significant temporal and amplitude changes with respect to the raw signal, and shows the progressive poor treatment of the noise after 14 Hz (divergence region), where a perfect match (r = 1.00) with the raw noised signal is obtained with 20 Hz.
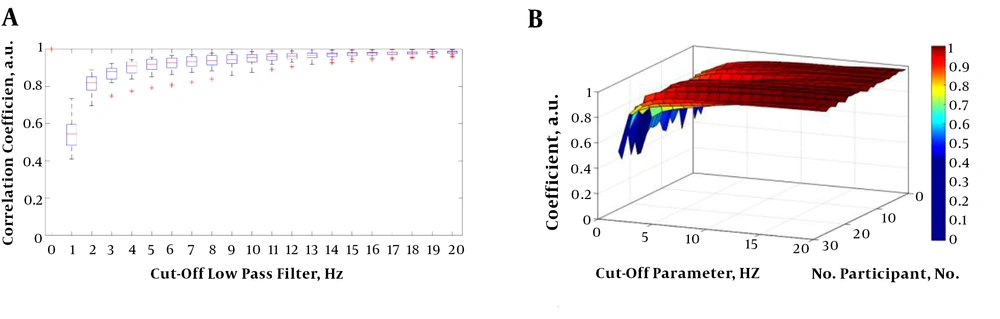
Figure 3.
A, Box plot of correlation coefficient obtained between each cut-off parameter with respect to raw signal on isoinertial accelerometry signal. The reference raw signal is shown in coordinate (0, 1). B, Tridimensional behavior of cut-off parameters in each participant respect the raw signal.
Finally, the variance analysis to select the most stable cut-off filtering parameters is shown in Figure 4.
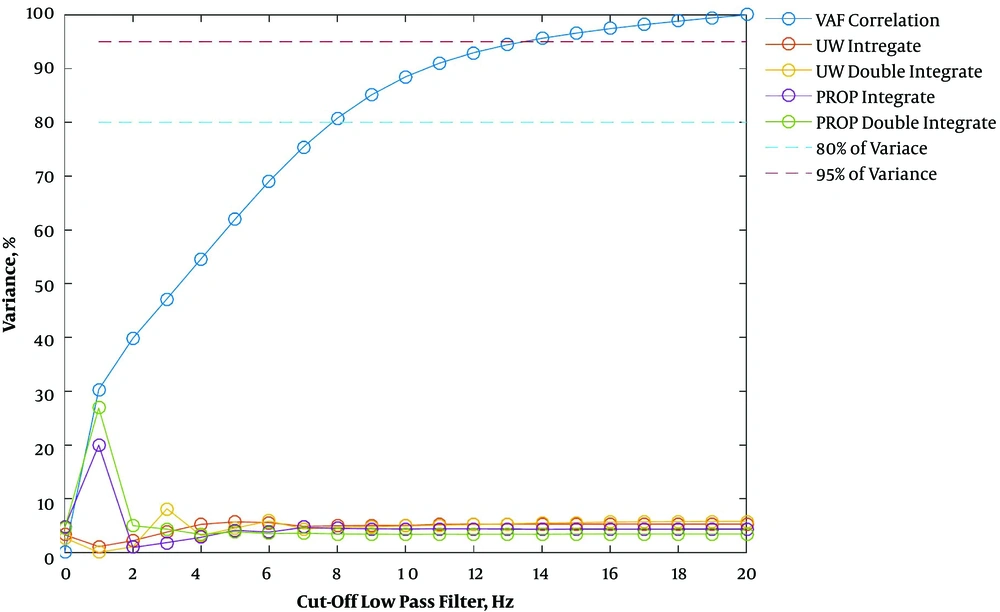
Figure 4.
Variance graph of simple integral, double integral, and accounted variance of correlation coefficients during unweight and propulsion phases obtained from isoinertial accelerometry signals at sacrum level.
5. Discussion
The objective of this study was to determine the most appropriate (stable) cut-off low pass Butterworth filter parameters for unweight and propulsion phases to treat signals from countermovement jump. The main finding is that the most stable variance for mechanical outputs is 8 - 13 Hz using a second order Butterworth low pass filter for signals from an IAU used at the sacrum level during a countermovement jump. To the best of our knowledge, this is a novel finding.
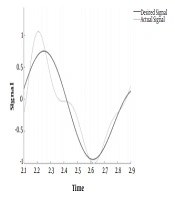
The behavior of parameters of the Butterworth filter in countermovement jump for simple and double integration in unweight and propulsion phases suggests that when an excessive increase in the parameter, i.e. 20 Hz of cut-off is set, an under-filtering effect could be generated, resulting in a signal with poor treatment of the noise, such as the raw signal experimented during the acquisition affecting the mechanical work and power output. In contrast, when an excessive lower parameter is set, i.e. 1 Hz, an over-filtering effect could be generated, creating a temporal and amplified distortion in the signal with respect to the raw signal (Figure 5), which also affects the mechanical work and power output. As a consequence, a major variability in mechanical output is created with lower and higher parameters; the normalized (z-score) distribution of data shows (Figure 2) the greatest range of variability of mechanical outputs at lower parameters and a relative increase in the range of variability for higher parameters with respect to the central frequency band.
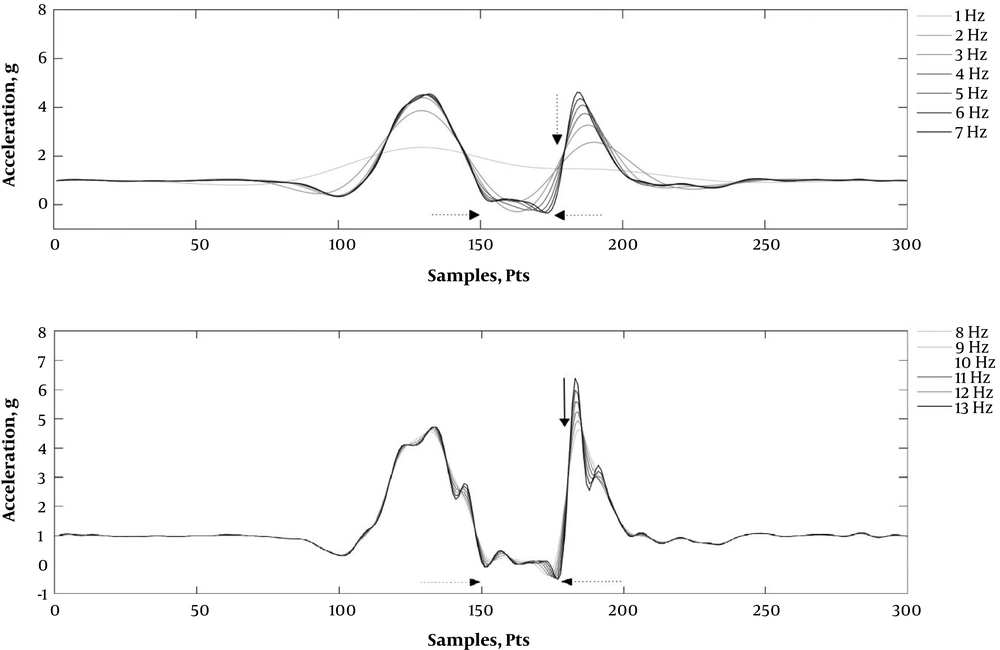
Figure 5.
Filter effect. A, Filter effect from 1 - 7 Hz: the horizontal shows the time distortion and the vertical shows the amplitude distortion. B, Filter effect from 8 - 13 Hertz: the horizontal raw shows the time distortion and the vertical raw shows the amplitude distortion.
To choose a stable filtered region for isoinertial accelerometry signals with lower variance, the criteria of very high correlation with values of 80 - 90% and individual weights lower than 5% were used, obtaining a central band of 8 - 13 Hz. This suggests that the convergence to obtain the lowest range of variance in mechanical outputs obtained from isoinertial accelerometry signals will be found using a cut-off parameter in this frequency band, avoiding the under and over-filtering effects. Our findings regarding filtering were very close to the cut-off of parameter used by McGinnis et al. (20) who filtered their signals with 15 Hz; however, a great number of jumps obtained with an accelerometer did not consider this kind of parameter, adding variance to their results.
Adequate treatment of accelerometry-related signals during sport and rehabilitation tasks needs to be considered with utmost care in order to allow an adequate assessment of results and to reduce error during performance assessment (6, 8). For example, regarding the measurement of the physical activity level, avoiding frequencies over 5 Hz when the sampling frequency is 30 Hz could overestimate the level of physical activity (21). Of practical relevance, the current findings may help to choose adequate parameters of filtering to treat isoinertial accelerometry signals (i.e. signals acquired from smartphone) to create training apps. This finding may help to reduce the errors given by the device (sensors) and not by the performance of the subject during a jump task. This error affects the mechanical variables work and power, which are, used to plan physical interventions. Therefore, we recommend using the frequency band found for sport and sport-rehabilitation contexts.
Although it has several strengths, the current study tested only one type of filter degree, i.e. low pass Butterworth filter of second degree. Moreover, the effect of filter and sample frequency was not considered in this study. Another source of signal contamination could be the resonance phenomena associated with the attachment of the smartphone.
In conclusion, an 8 - 13 Hz cut-off low pass filter is more appropriate to treat isoinertial accelerometry signals during jumping.