
1. Background
Among different factors that exist in workplaces, such as humidity, temperature, limited workplace, inappropriate light, noise, and dust, light is of crucial importance (1). Light, generally and specifically, is one of humans' basic physical and mental needs (2). In addition to maintaining health, this factor provides more desirable and pleasant conditions for people, and it also can create relaxation and increase outcomes in different residential, official, and industrial environments (3). Quantitative components of light such as source and corrected color temperature (CCT) are important (4, 5); "recommendation of occupational exposure limits (2016 - 2017)". Light recognition depends on the intensity, and its quality depends on the color temperature. Investigations show that different amounts of light and CCT, as two important parameters in light, create various mental and physical effects on humans (6). In addition to physiological effects, studies indicate that exposure to light surfaces with different sources and CCT can influence people's consciousness, conception, and performance (7). If the CCT is higher than 4000 K, it is cold light; if it is lower than 3000 K, it is warm light (8, 9). Corrected color temperature as a factor has an effective role in visual ergonomic parameters consistent with the functional characteristics of the person in the workplace (10). Studies reveal that CCT and light sources during working hours can influence people's consciousness, performance, and recovery (11). Some studies have shown that visual fatigue and discomfort caused by light sources can influence the body and cause pressure on the nervous system (12). Duff examined compressed fluorescent lamps used in residential areas (regarding light and color temperature) are significant health and safety aspects (13). Munch et al., emphasizing the importance of that, found that in light with a fluorescent source and lighting conditions with the temperature of 6500 Kelvin (K), the highest consciousness level, satisfaction, welfare, and visual comfort as well as immediate reaction in activities was resulted. However, fluorescent, as well as positive effects on mood and consciousness, can cause detrimental effects on mental performance. Therefore, light source and color temperature in designing artificial light, especially with fluorescent sources, is very important to satisfy visual or nonvisual requirements (14). According to Chellappa et al., indoors with desirable light can increase employees' comfort, productivity, health, and welfare (15). Lighting can make an indoor environment graceful, and also, for a learning environment, proper lighting, with the right illuminance and CCT level, can make that space pleasant and improve the mood status (16). Although some Studies, such as Knez, have demonstrated the impact of illuminance on human mood (17) and visual performance, little research has focused on the impact of the combination of these two key aspects of indoor lighting on students (18).
2. Objectives
The issue of whether CCT and light sources can act as mood inducers remain controversial and require more robust evidence, the present study aimed to investigate the effect of source (LED, fluorescent) and CCT (300, 4000 K) on mood and vision (acuity and color recognition) of students of medical universities of Tehran.
3. Methods
3.1. Participants
The present study is a quasi-experimental and within-subject study. The population of this study consisted of male and female students of Tehran and the University of Social and Welfare Rehabilitation Sciences. The sample included 20 subjects that were estimated with first-type error (0.05) and test power (0.08) based on the available non-probability sampling method (19). The inclusion criteria included 20 - 30 years old people without color blindness and visual impairments. Exclusion criteria included discomfort or any problems during the test. A stop bang score and Epworth score were used to assess the sleepiness scale, regular sleep, and sleep disorder before entering the study. A STOP-BANG score of 2 or less indicates low risk, whereas a score of 5 or higher indicates a high risk of moderate or severe obstructive sleep apnea (OSA). Score 3 or 4 to evaluate how probable they are to have OSA. So participants with scores of 2 or less entered the test.
Participants were selected from all medical students by census and interviewed by the research team via email or contact number. Then, people who were not color blind and had 10/10 vision, did not have any type of eye and head surgery, and were in the age range of 20 to 30 years on the profile of mood states (POMS) test (lower scores are expressive of people with more stable mood profiles) were joined to the study. Exclusion criteria included discomfort or any problems during the examination. The final number was selected from the selected candidates. Participants, after 5 times participations have got the reward.
3.2. Materials
The test has done in a room setting with the dimensions of 3*3 m2 with cold and warm color LED and fluorescent lamps (36 & 20 watts) at two color temperatures of 3000 K and 4000 K And a day with sunlight. It has covered by a curtain in sunlight (Figure 1). 500 lux on a working surface at 30 degrees. Visual acuity with FrACT, Snellen visual acuity chart, POMS, color blindness, and Ishihara's test was examined. Two kinds of visual acuity tests are used software-based and physical.
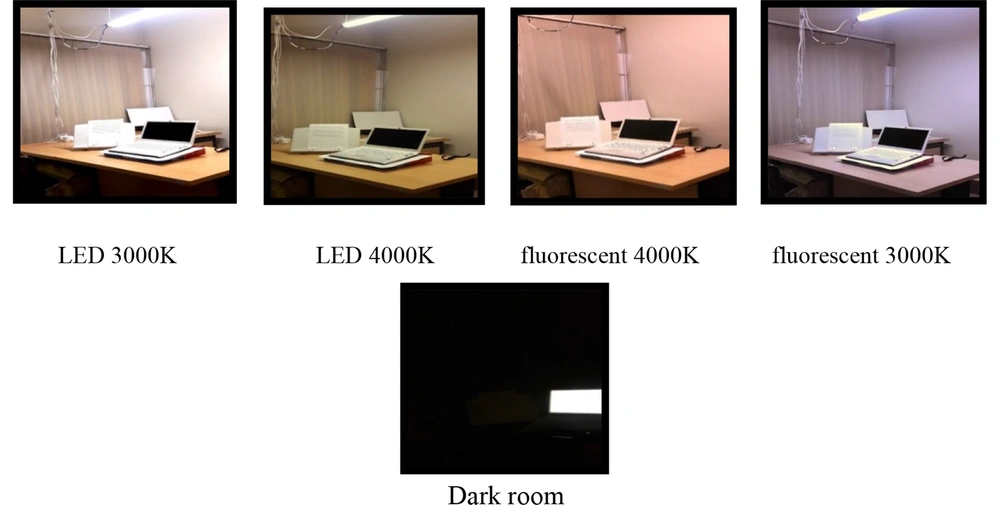
Figure 1.
Different rooms' artificial light
3.3. Procedure
Color blindness: Ishihara's test ensured no color blindness, and the Snellen chart was used for visual examination (10.10). Profile of mood states: In this study, the mood states of students, as the first test, were administered before exposure to light. In this regard, before entering the room, the person gives numbers to his or her mood states from 0 to 4 (0-not at all, 1-to some extent, 2-average, 3-pretty much, 4-too much) by filling out a scale. This scale includes 6 subscales (stress, depression, anger, tiredness, dizziness, and power). The total score can be 0 - 200, where those between 24 and 177 have normal mood states (20). The validity and reliability of this scale were confirmed by Vaez Mousavi and Samandar in Iran (21). From the questions related to each subscale, a score is assigned to the selected option, and finally, 6 results from mood states before the study (outside the laboratory) and 6 subscales from mood states after the study (in the laboratory and under the lamp) for each type of light (each day with a different light, 5 times in 5 consecutive days, and 5 times after the entrance) will be obtained. Snellen visual acuity chart: The Snellen scale is an example of a test to measure visual accuracy. This test includes a white paper where times English letters of different sizes and thicknesses with black color are written on it. The subjects were asked to read these letters with one eye from a distance of 2.8 m. The smallest letters that the person can, as well as the fixed distance, determine the subject's ability in terms of accuracy and vision. Hashemi et al. (22) in Iran confirmed this test's validity. In this test, according to the formula, the chart was located at a distance of 2.8 m from the person on the wall due to spatial limitations. For scoring, the person read the letters from up to down loudly, and the researcher recorded the errors. This was done separately for every 5 lighting conditions. Visual acuity with FrcAT: When selecting the volunteers, this software was used in the same computer with the same angle and distance of 0.65 m that is proposed by the software, and according to the final score of the software (0.78) that indicates normal and full vision, subjects were selected. Letters C and 9 are observed at a distance of 45° from each other. The software indicates the letter C 18 times in one of the 9 directions from 6 letters; the person easily reads one. The sound of this software is turned off during the test (23), and the person presses the directions on the keyboard toward the semi-open side of the observed letter from the screen. Finally, a score was indicated by FrACT, and the score under different lighting circumstances was recorded (24). This software was created by Michael (1985). So far, this software has been used in many studies, and the last published study was conducted by Bach and Schafer (25) (Figure 2).
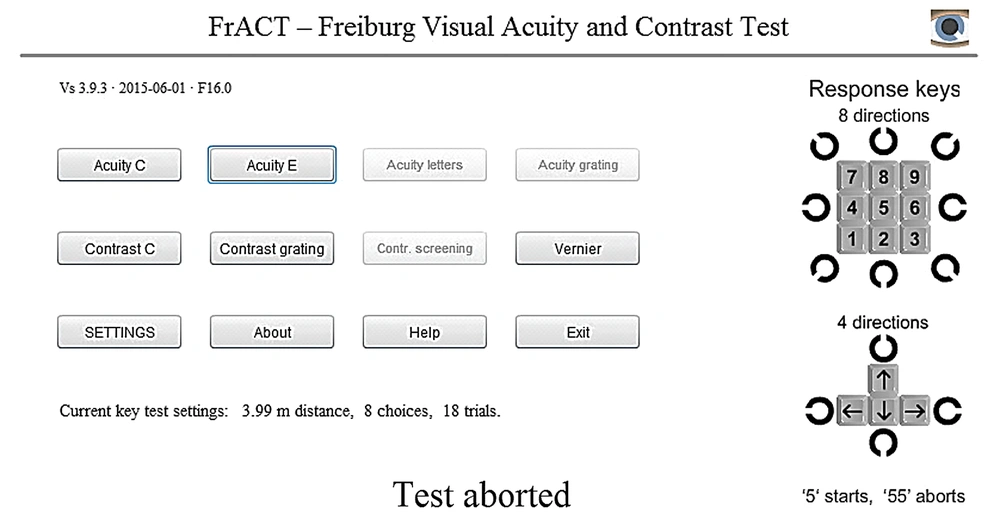
Figure 2.
FrACT test software
Scoring: A score between 0 and 0.780 was obtained from the software and recorded by the researcher. For this purpose, this was done separately for each person under 5 different conditions, and data was entered SPSS and analyzed by one-way ANOVA and Greenhouse-Geisser.
4. Results
The average age of participants was 23.20 ± (3.05), and the percentage of participants showed below (Figure 3).
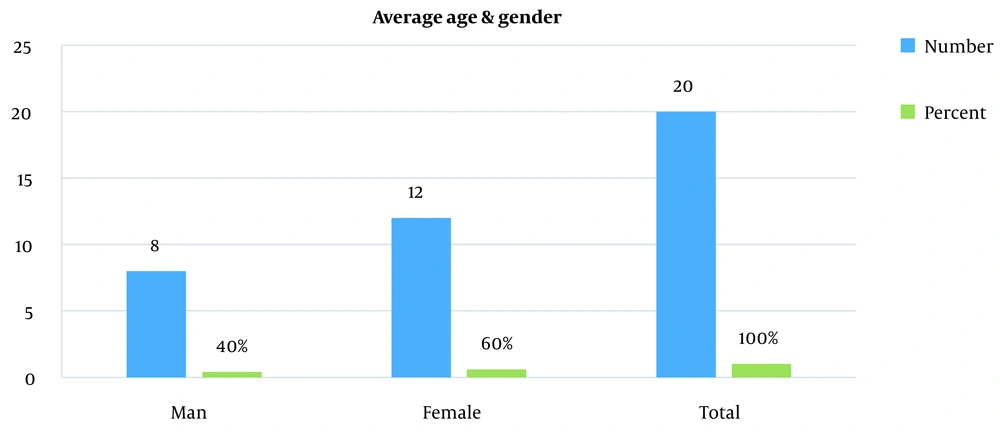
Figure 3.
Average age and gender
The average score of the tension subscale under daylight was -4.55, with and standard deviation (SD) of 2.70; the depression subscale was -3.45, with and standard deviation of 2.37; the anger subscale was -1.6 and a standard deviation of 2.30; power subscale was -4.10 and standard deviation of 0.58, fatigue subscale was -2.85, and standard deviation of 2.32 and dizziness subscale was -1.95 and standard deviation of 1.58 (Table 1).
Table 1.
The Average Score of 6 Subscales Under Daylight, LED, Fluorescent a
| Subscale and Group | Mean ± SD |
|---|---|
| Tension | |
| 1 | -4.55 ± 2.70 |
| 2 | 1. 80 ± 1.28 |
| 3 | -2.45 ± 1.95 |
| 4 | 3.4 ± 3.74 |
| 5 | 0.75 ± 3.38 |
| Depression | |
| 1 | -3.45 ± 2.37 |
| 2 | 1.90 ± 1.74 |
| 3 | -2.95 ± 2.16 |
| 4 | 3.55 ± 0.99 |
| 5 | -1.15 ± 2.85 |
| Anger | |
| 1 | -1.6 ± 2.30 |
| 2 | 2.15 ± 2.99 |
| 3 | -1.15 ± 2.85 |
| 4 | 2.25 ± 3.10 |
| 5 | -0.65 ± 1.08 |
| Power | |
| 1 | 4.10 ± 0.584 |
| 2 | 1.95 ± 0.583 |
| 3 | 1.50 ± 0.569 |
| 4 | 5 ± 0.62 |
| 5 | 1.65 ± 0.708 |
| Fatigue | |
| 1 | -2.85 ± 2.32 |
| 2 | 0.85 ± 2.30 |
| 3 | -2.35 ± 2.13 |
| 4 | 2.75 ± 2.35 |
| 5 | 2 ± 1.74 |
| Dizziness | |
| 1 | -1.95 ± 1.583 |
| 2 | 0.45 ± 2.064 |
| 3 | -2.25 ± 1.681 |
| 4 | 2.40 ± 1.142 |
| 5 | 1.25 ± 1.773 |
Abbreviation: SD, standard deviation.
a Daylight, LED 3000 K, LED 4000 K, fluorescent 3000 K, fluorescent 4000 K named 1 to 5.
The results of one-way ANOVA showed that average subscales of stress, depression, anger, power, fatigue, and dizziness are different at least in two lighting conditions (Table 2).
Table 2.
Average of Mood Subscales Under Different Conditions
| Subscale | Mauchly’s Test of Sphericity | Degrees of Freedom | F Factor | Mean Squared | Sig | |
|---|---|---|---|---|---|---|
| Statistics | P-Value | |||||
| Tension a | 0.45 | 0.127 | 4 | - | 209.235 | 0.001 < |
| Depression b | 0.343 | 0.029 | 2.888 | 40.962 | 258.021 | 0.001 < |
| Anger b | 0.225 | 0.002 | 2.085 | 14.774 | 98.311 | 0.001 < |
| Power a | 0.415 | 0.084 | 4 | - | 51.285 | 0.001 < |
| Fatigue b | 0.323 | 0.021 | 3.024 | 21.061 | 154.345 | 0.001 < |
| Dizziness a | 0.509 | 0.229 | 4 | - | 73.240 | 0.001 < |
a One-way ANOVA was used for analysis.
b Greenhouse-Geisser was used for analysis.
According to the results, the means of subscales were compared under different conditions. The results showed that a significant difference exists between the average score of stress subscale under daylight with LED 3000 K and 4000 K and fluorescent 3000 K and 4000 K significant A significant difference exists between LED 3000 K and LED 4000 K, but no difference exists between fluorescent. A significant difference exists between LED & fluorescent 4000 K and fluorescent 3000 K and 4000 K (Table 3).
Table 3.
Six Subscales of Mood Means Compared Under 5 Conditions
| Subscale | Group 1 | Group 2 | Standard Deviation | P-Value |
|---|---|---|---|---|
| Tension | Daylight | LED 3000 K | 1.54 | 0.001 > |
| LED 4000 K | 1.053 | 0.004 | ||
| Fluorescent 3000 K | 0.64 | 0.001 > | ||
| Fluorescent 4000 K | 0.76 | 0.001 > | ||
| LED 3000 K | LED 4000 K | 0.88 | 0.001 > | |
| Fluorescent 3000 K | 0.88 | 0.078 | ||
| Fluorescent 4000 K | 0.64 | 0.25 | ||
| LED 4000 K | Fluorescent 3000 K | 0.8 | 0.001 > | |
| Fluorescent 4000 K | 0.91 | 0.001 | ||
| Fluorescent 3000 K | Fluorescent 4000 K | 1.22 | 0.044 | |
| Depression | Daylight | LED 3000 K | 0.658 | 0.001 > |
| LED 4000 K | 0.635 | 0.44 | ||
| Fluorescent 3000 K | 0.628 | 0.001 > | ||
| Fluorescent 4000 K | 0.865 | 0.015 | ||
| LED 3000 K | LED 4000 K | 0.464 | 0.001 > | |
| Fluorescent 3000 K | 0.449 | 0.002 | ||
| Fluorescent 4000 K | 0.738 | 0.001 | ||
| LED 4000 K | Fluorescent 3000 K | 0.427 | 0.001 | |
| Fluorescent 4000 K | 0.878 | 0.055 | ||
| Fluorescent 3000 K | Fluorescent 4000 K | 0.637 | > 0.001 | |
| Anger | Daylight | LED 3000 K | 0.721 | > 0.001 |
| LED 4000 K | 0.769 | 0.65 | ||
| Fluorescent 3000 K | 0.734 | 0.001 | ||
| Fluorescent 4000 K | 0.651 | 0.16 | ||
| LED 3000 K | LED 4000 K | 0.74 | > 0.001 | |
| Fluorescent 3000 K | 0.25 | 0.69 | ||
| Fluorescent 4000 K | 0.702 | > 0.001 | ||
| LED 4000 K | Fluorescent 3000 K | 0.769 | > 0.001 | |
| Fluorescent 4000 K | 0.613 | 0.42 | ||
| Fluorescent 3000 K | Fluorescent 4000 K | 0.721 | > 0.001 | |
| Power | Daylight | LED 3000 K | 0.719 | 0.008 |
| LED 4000 K | 0.762 | 0.003 | ||
| Fluorescent 3000 K | 0.836 | 0.295 | ||
| Fluorescent 4000 K | 0.78 | 0.005 | ||
| LED 3000 K | LED 4000 K | 0.545 | 0.419 | |
| Fluorescent 3000 K | 0.776 | 0.001 | ||
| Fluorescent 4000 K | 0.465 | 0.527 | ||
| LED 4000 K | Fluorescent 3000 K | 0.881 | 0.001 | |
| Fluorescent 4000 K | 0.455 | 0.745 | ||
| Fluorescent 3000 K | Fluorescent 4000 K | 0.868 | 0.001 | |
| Fatigue | Daylight | LED 3000 K | 0.633 | > 0.001 |
| LED 3000 K | LED 4000 K | 0.69 | 0.478 | |
| LED 4000 K | Fluorescent 3000 K | 0.832 | > 0.001 | |
| Fluorescent 3000 K | Fluorescent 4000 K | 0.591 | 0.166 | |
| Dizziness | Daylight | Led 3000 K | 0.455 | > 0.001 |
| LED 3000 K | LED 4000 K | 0.378 | 0.437 | |
| LED 4000 K | Fluorescent 3000 K | 0.499 | > 0.001 | |
| Fluorescent 3000 K | Fluorescent 4000 K | 0.546 | 0.001 |
The results of visual acuity analysis in the Snellen chart showed that by investigating the probability, the average error in 5 lighting conditions showed no significant difference. Also, the analysis of visual acuity in FrACT with the probability of (P < 0.001) showed that at least two mean values are different (Table 4).
Table 4.
Comparison of Visual Acuity Comparison, Software-Based (FrACT) and Snellen Chart
| Visual Acuity | Mauchly’s Test of Sphericity | Degrees of Freedom | F Factor | Mean Squared | Sig | |
|---|---|---|---|---|---|---|
| Statistics | P-Value | |||||
| Software a | 0.0 | 0.117 | 4 | - | 0.0 | < 0.001 |
| Snellen chart b | 0.318 | 0.019 | 2.573 | 1.019 | 0.443 | 0.384 |
a One-way ANOVA was used for analysis.
b Greenhouse-Geisser was used for analysis.
A pairwise comparison of visual acuity based on the software method showed that a significant difference existed between visual acuity obtained from FrACT under daylight with LED 3000 K and 4000 K and fluorescent 4000 K and 3000 K.
Pairwise comparison of visual acuity based on the software method showed that no significant difference existed between visual acuity obtained from FrACT under LED 3000 K with LED 4000 K and fluorescent 4000 K and 3000 K and LED 4000 K with fluorescent 4000 K and 3000 K and fluorescent 3000 K with fluorescent 4000 K. The results of the color recognition analysis average correct responses to Ishihara paper lighting conditions showed no significant difference (P < 0.05) (Table 5).
Table 5.
Means Compared Under Different Color Recognition Conditions
| Color Recognition | Mauchly’s Sphericity Test | df | F Factor | Mean's Squared | P-Value | |
|---|---|---|---|---|---|---|
| Statistic | Sig | |||||
| Software a | 0.663 | 0.624 | 4 | 1.049 | 0.225 | 0.388 |
a One-way ANOVA was used for analysis.
5. Discussion
The findings showed that decreased stress in daylight was higher than in four artificial sources (P < 0.001). Kilic and Hasirci showed that the employment of sunlight in the library could increase students' interest and positively influence their participation (26). Sunlight creates positive behavioral and physiological changes (27).
In this regard, Sami Abdelaziz Mahmoud et al. found that sunlight effectively increases cognitive performance, health improvement, and mental welfare (28). Mayhoub and Rabboh pointed to the achievement of pleasant mental feelings and decreased stress due to exposure to the sun (29). The results of the present study showed that decreased depression under daylight is higher than four artificial sources, but compared with LED with a color temperature of 4000 K, no significant difference was observed (P > 0.05). Shin et al. (30) showed that exposure to daylight could improve mental processes such as happiness, mood, and consciousness and decrease stress levels. Kaida et al. (31) believe that sunlight is an effective strategy for decreasing depression and improving mood states. According to the findings by Ekstrom and Beaven (32), daylight, compared with artificial light, has a more stable impact on happiness and consciousness; according to the findings of this study, anger levels at high color temperatures decreased, and at low color, temperatures decreased. Ekstrom and Beaven (32) found that exposure to high-color light causes neural stability and decreases anger. According to the findings by Munch et al. (14), in light of a fluorescent source and lighting conditions with a temperature of 6500 K, the highest welfare and comfort levels resulted in performing the related activities. According to Kaida et al. (31), exposure to daylight enhances a positive sensational-emotional state. The power level to perform activities under daylight is higher than in artificial light. Fluorescent in the lower age range activates this feeling better, making it suitable for children. de Kort and Smolders stated that increased light intensity creates more energy and limits reaction time (7) Knez found that exposure to high-frequency light causes more readiness for problem-solving (33).
Decreased fatigue in LED 4000 K is higher than in LED 3000 K. This result was similar in fluorescent. In other words, fatigue in higher color temperatures decreased more. The results of a study by Hawes et al. (34) showed that the higher the color temperature of light sources, the lower mental fatigue will exist, which is consistent with the present study's findings. Canazei et al. (35) found that the mental fatigue rate in fluorescent is higher than in LED, accompanied by a slower response. A study by de Kort and Smolders (7) indicates that fatigue levels while exposed to daylight during the morning are rarely reported.
Sithravel et al. found that 1000 K during the morning and afternoon helps people to confound fatigue and enhance consciousness during the day. On the other hand, daylight with high power can create more physiological energy and arousal compared with low intensity (36). According to the findings of this study, decreased dizziness under LED with a color temperature of 4000 K was higher than in daylight. LED at 4000 K caused more dizziness than the other three light sources. Smolders and de Kort showed that the white color and the source could increase consciousness and decrease dizziness (37). Lee et al. found that those exposed to high color temperatures rarely feel dizzy and are more cheerful and happy (38). The present study showed that high color temperatures in LED and fluorescent sources could improve vision if other environmental and lighting conditions are stable (P < 0.05). LED lamps, unlike fluorescent lamps, can be effective for those with visual impairments, which is evident in high color (39). However, in this study, visual acuity from FrACT due to the color proximity of four light sources showed no significant difference between fluorescent and LED. The results of the color recognition test indicated that healthy participants in this study did not affect by the light source and color temperature, and no significant difference existed between average and correct responses to Ishihara papers. Studies that investigate the effect of color on feelings should ensure the visual integrity of people in this environment (40).
5.1. Conclusions
Compared with artificial sources, daylight in different subscales of mood states and visual acuity positively affects activities, but it does not influence color recognition. Among artificial sources, two light sources (LED and fluorescent) with a color temperature of 4000 K compared with 3000 K and among LED and fluorescent with the same LED colors improved the mood state of people, but the light source did not influence visual acuity and color recognition. The results showed that the employment of sunlight and artificial LED light with a color temperature significantly impacts pupils' moods. Because mood can be influenced by every country's environmental and cultural factors and affect behavior and other individual functions, this issue is probably important in choosing the right source for specific training locations. For the first time, this study was conducted in Iran to improve lighting conditions as one of the important environmental factors affecting students' mood and vision at TUMS and USWR universities of medical sciences. The employed artificial light was taken from color temperatures of 3000 and 4000 K and used in two popular sources, LED and fluorescent.
5.2. Limitations
The number of participants, since every person should attend 5 times and persuading participants to attend every single day to order the lighting equipment from other countries and postpone the time of the project
5.3. Suggestions
Other environmental factors were the same for all participants.
Future studies could choose a wide range of ages and numbers of people in various fields. And also, the CTs was so close to each other seems too difficult to distinguish. Try to test new lighting technology simultaneous is broadly classified mainly into four types of lighting; incandescent, fluorescent, halogen, LED (light emitting diode).