
1. Background
Technological advancements and developments in information communication have transformed the nature of work at both organizational and industry levels. A shift has occurred from predominantly physical labor to work characterized by mental and cognitive demands (1). In recent years, robots have emerged as essential components for attaining competitiveness in manufacturing, particularly when they can collaborate with humans within a shared workspace and foster a collaborative partnership. The current scenario emphasizes a collaborative environment where robots and humans can work together and interact seamlessly (2).
Human-robot interaction (HRI), an interdisciplinary field encompassing robotics, data science, psychology, and cognitive science, has gained prominence within the context of the Fourth Industrial Revolution. Fostering effective human-machine interaction, characterized by reliable relationships and seamless communication, is crucial for navigating this era of technological advancement and facilitating user skill acquisition (3). Robots can assist humans by relieving them of physically demanding tasks, carrying heavy loads, and conducting repetitive tasks. Most applications in the industrial domain refer to assembly processes, where robots are responsible for tasks that require high precision or cause repetitive strain injuries when done manually, such as carrying heavy objects (4).
Robot integration often necessitates workforce adaptation, requiring workers to relearn tasks and adjust to new workflows. This challenge is exacerbated by the prevalent nature of repetitive tasks and the demanding work environments in industrial settings, characterized by factors such as noise, hazards, dim lighting, time pressure, supervision, and performance monitoring (5, 6). Consequently, human factors, including mental stress induced by prolonged interaction with robots, must be carefully considered and integrated into the planning and design of robotic applications in industrial settings (7).
The term "mental workload (MWL)" describes the amount of cognitive effort required by a person or user to complete one or more tasks (8). Different researchers define MWL as the measure of cognitive resources expended during task execution within a specified timeframe, used to forecast individual or system performance (9, 10). Mental workload is a critical determinant of task performance (11) and is a key factor considered in the development and assessment of complex human-machine interfaces (12). There is broad consensus among researchers about the multifaceted nature of mental burden, which includes both individual effort and attention (13, 14). Mental workload assessment typically employs a combination of subjective, performance-based, and physiological measures (15).
Physiological measures serve as natural indicators of MWL, as increased cognitive demand necessitates greater resource allocation (16). A variety of physiological measures, including electrocardiography (ECG), eye movement, electroencephalography (EEG), respiration, and electromyography (EMG), can be employed to assess MWL. For example, since the brain is the organ responsible for information processing and decision-making, MWL that is cognitively demanding should directly affect brain functions and be associated with electrical activities (17).
The EEG is a non-invasive technique used to capture and record the brain's electrical activity in response to stimuli and behavioral tasks (18). Cognitive theories posit a profound neural basis for emotions, implicating specific cortical and subcortical brain regions in the processing of primary emotional states. These neural correlates of emotion are differentiated from the brain's general electrical and metabolic functions (19). To elucidate the relationship between neural activity and observed voltage patterns, frequency band analysis is commonly employed, with alpha (8 - 12.5 Hz), theta (4 - 8 Hz), and beta (12.5 - 30 Hz) bands representing key spectral features associated with various cognitive and neural processes (20). Previous studies have indicated that the frontal and parietal bands are associated with workload levels (21, 22).
The integration of EEG technology into the assembly line workforce presents significant challenges. The EEG power indicates the level of synchronous neuronal activity. Klimesch's research suggests that EEG power is not simply a linear indicator of cognitive function but rather exhibits a more intricate and nonlinear relationship with cognitive and memory performance (23). The study found a significant correlation between MWL and EEG power in the alpha and theta frequency bands. It is suggested that alpha power is correlated with changes in MWL due to its association with arousal levels, idle states, and cortical inhibition (24).
In a study conducted by Diaz-Piedra et al. on army combat drivers, it was concluded that the theta band is a well-established indicator of cognitive workload (CWL). Increases in theta power within the frontal and occipital regions are directly correlated with task difficulty (25). Aksu et al. conducted a study involving 15 participants where they employed EEG and eye tracking for assessing MWL. They concluded that as task difficulty increased, alpha power exhibited a differential pattern: It rose in the frontal regions while decreasing in the temporal, parietal, and occipital regions (26).
Industrial tasks often involve dynamic and unpredictable elements. Research is needed to explore how MWL changes in response to these dynamic conditions, particularly in high ecological validity task designs. While industrial ergonomics research has extensively examined MWL in human-computer interaction scenarios, it has largely overlooked tasks that require simultaneous motor and cognitive demands. Particularly within the domain of HRI, studies that combine movement and cognition assessments are conspicuously absent.
2. Objectives
As different professions experience various types of human error resulting from mental fatigue and the development of robotic systems, the importance of human interaction and collaboration with these systems is critical. Quantifying MWL for workplace fatigue planning and management can potentially reduce the impact of human error. Therefore, this study seeks to measure the cognitive load experienced by human operators within simulated industrial settings. The research will investigate the impact of integrating a robotic assistant into the workflow, with a specific focus on how this technology influences the cognitive demands placed on the operator.
3. Methods
3.1. Participants
In this study, 17 male participants aged between 25 and 35 years (mean ± SD: 30.82 ± 2.35) were recruited from Tehran University of Medical Sciences. There was a required variability in participants’ educational backgrounds, ranging from postgraduate to PhD as the highest degree, and in visual-spatial intelligence. Although the relatively small sample size of seventeen participants restricts the generalizability of findings, the in-depth analysis of individual data offers valuable insights into the studied phenomena and establishes a solid foundation for future research with larger cohorts.
Participants were carefully screened to exclude individuals with visual or neurological impairments and were all right-handed novices to this experimental paradigm. The present study was approved by the Ethical Committee of Tehran University of Medical Sciences (IR.TUMS.SPH.REC.1401.173). Informed consent was obtained from all individuals.
3.2. Task
The study design includes one independent variable: The robotic task, which was manipulated by having participants perform the task at three levels of difficulty — low workload, medium workload, and high workload. The defined task involves participants performing a simulated task using a pre-designed and built robotic arm controlled remotely through manual controllers, as shown in Figure 1.
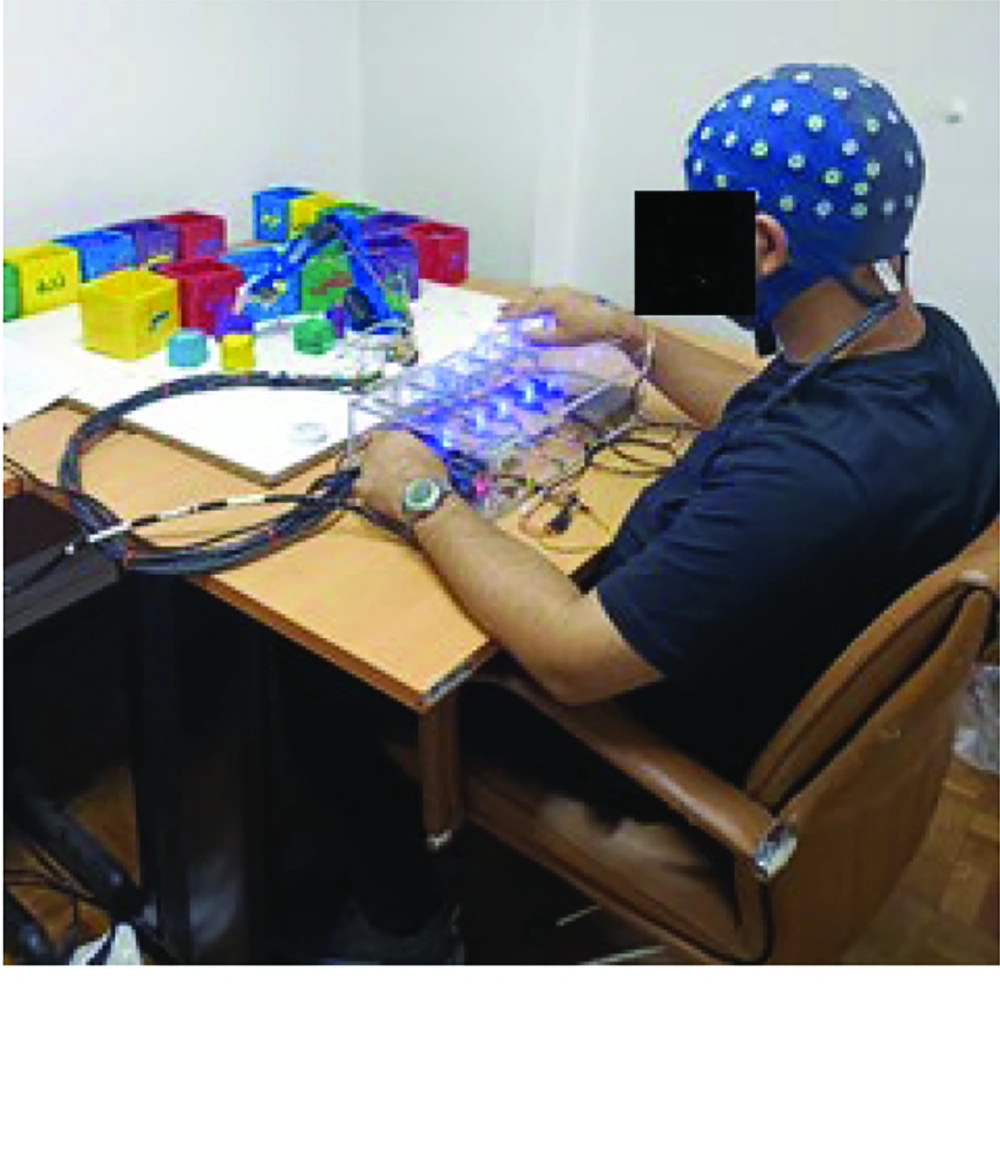
Figure 1.
Participant wearing the single electrode electroencephalography (EEG) device conducting an experiment.
A robotic arm with 5 degrees of freedom and an AVR microcontroller was utilized to execute the HRI task. The robotic arm is equipped with a gripper that receives motion commands from manual controllers (joysticks). Through these commands, it can manipulate objects of sizes proportional to the gripper's surface. The maximum radius of motion for the robotic arm is 60 centimeters.
The simulated task is designed to have high ecological validity, requiring participants to process visual and spatial information, mirroring real-world industrial robot operation. To enhance ecological validity, the task incorporated both motor and cognitive components. Three levels of CWL (low, medium, and high) were established by manipulating task complexity. The maximum duration for each task block was set at 10 minutes.
To balance and neutralize the learning effect and order effect, each participant randomly selected one of the six predefined sequences or conditions and performed the robotic task. The conclusion of each block was determined through a trigger installed in the robotic framework.
Working memory load was manipulated by requiring participants to concurrently memorize a series of visual stimuli, including industry-related images and two-digit numbers, while performing the robotic task. The number of stimuli was systematically varied across three conditions to induce varying levels of cognitive demand: Low (2 stimuli), medium (5 stimuli), and high (7 stimuli).
The initial task involved manipulating cubes with embedded industrial images and numbers. To increase cognitive load, the task incorporated a Stroop-like interference effect by mismatching cube colors, written words, and box colors. Three levels of difficulty were introduced: Color-matching, color-word matching, and color-word-color matching. To enhance ecological validity, industrial sounds were played concurrently during task execution.
The task conditions for the robotic task in the medium and high levels were similar to the low level, with the difference being that the number of industrial shapes and digit numbers attached to the cubes increased to 5 and 7, respectively.
3.3. Research Design and Procedure
A repeated-measures design was employed, with each participant completing tasks at three cognitive load levels. Prior to the main experiment, participants provided informed consent, underwent pre-testing, and received training on the robotic arm. A baseline resting state measurement was collected before each experimental block. Participants engaged in each task condition for 10 minutes, followed by a debriefing session. The experimental setup during the robotic assembly task is depicted in Figure 2.
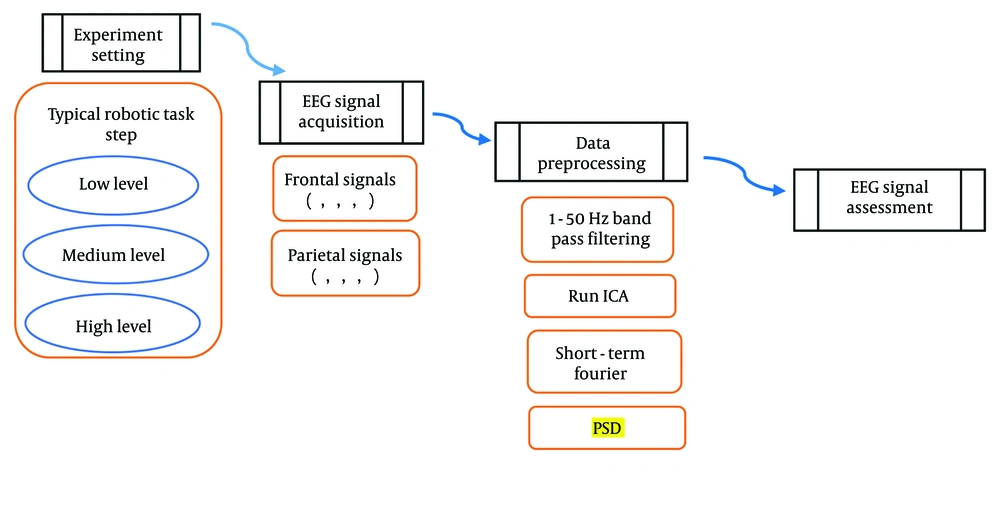
Figure 2.
Study protocol of robotic task
3.4. Stroop Method
The Stroop color word test is a cognitive assessment that evaluates an individual's ability to manage conflicting information. By presenting words printed in incongruent colors, the test induces interference between automatic and controlled processing. This incongruency demands increased cognitive effort from participants. Imposing a time constraint on responses further amplifies task difficulty (27).
To increase the cognitive engagement of the participants, boxes designed for cube placement were configured according to the Stroop effect paradigm. At the low level, participants were required to match the color of the cubes with the color of the box's front face and perform the necessary movements. At the medium level, the cubes had to be moved based on the written color on the box. At the high level, the cube color needed to correspond to the background color of the text on the box.
3.5. Data Acquisition and Measurement
The EEG data were acquired at a 500 Hz sampling rate using a 64-channel dry Ag/AgCl electrode cap (64-channel EEG system - eego™mylab, ANT Neuro, Netherlands) conforming to the International 10-20 system. Two additional electrodes were placed on the left and right mastoid processes for subsequent offline re-referencing (Figure 3). Ground and reference electrode impedances were maintained below 5 kΩ.
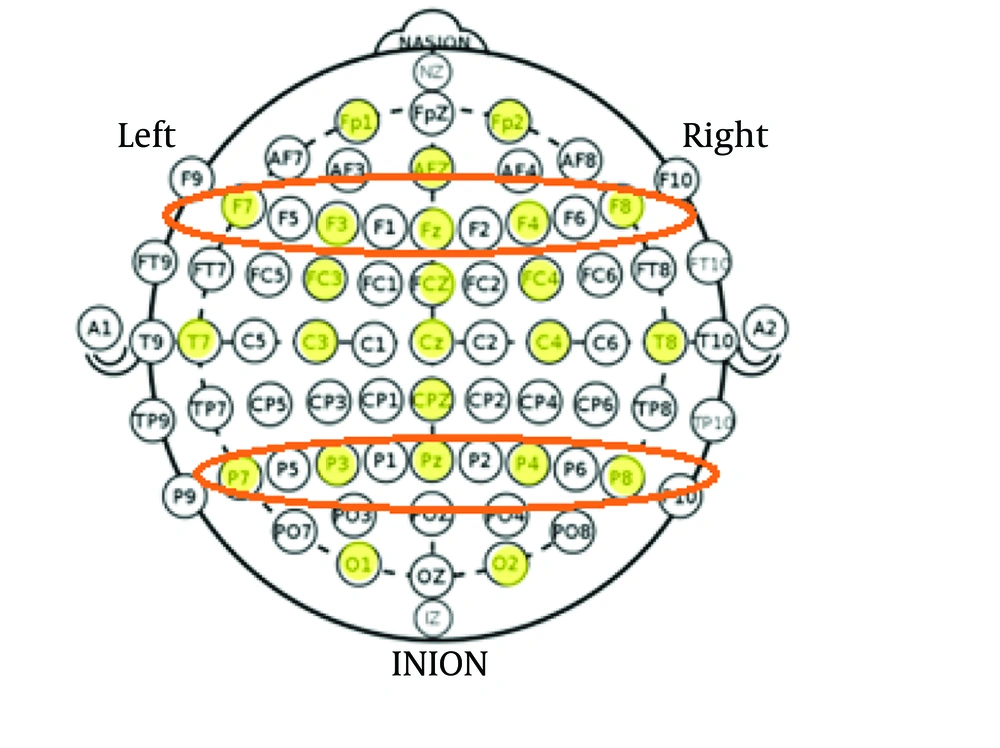
Figure 3.
Arrangement of the electrodes used in data acquisition as a single electrode
Raw EEG data underwent offline preprocessing using EEGLAB (28). The EEG preprocessing involves a series of techniques designed to enhance the quality and interpretability of raw EEG data. This is a critical step due to the pervasive presence of noise in scalp-recorded EEG signals, stemming from sources such as movement artifacts, powerline interference, and ocular activity. By effectively removing these artifacts, EEG preprocessing improves the spatial information of neural activity and prepares the data for subsequent analysis.
In our study, a bandpass filter (0.5 - 80 Hz) was applied to mitigate noise, including DC drift, powerline interference, and muscle artifacts. Epoch extraction was followed by manual rejection of contaminated segments. Independent component analysis (ICA) was utilized to decompose the EEG signal into independent components, with subsequent removal of components related to eye blinks and other artifacts.
The acquired signals were analyzed in single-channel (or single-electrode) data. A spatial and frequency analysis was performed on the EEG data, focusing on the absolute power considering the frontal and parietal electrodes (F3, F4, F7, F8, Fz, P3, P4, P7, P8, Pz) as shown in Figure 3.
Participants were recruited using a convenience sampling method. Following a pre-screening process, individuals who met the inclusion criteria were included in the final study phase. Repeated measures ANOVA models were employed, treating load condition as a within-subjects factor. For degrees of freedom where Mauchly's test revealed a breach of the assumption of sphericity, Greenhouse-Geisser estimations were used. Partial eta squared was used to report effect sizes. Holm-adjusted and P-values (< 0.05) were used for pairwise comparisons between load conditions.
4. Results
All participants were male. The mean age of the participants was 30.82 years (SD = 2.35), with an age range of 25 to 35 years. Tables 1 and 2 provide a summary of the qualitative and quantitative demographic characteristics of the participants.
Table 1.
Descriptive Statistic of Quantitative Demographics Data
| Variables | Min - Max | Mean ± SD |
|---|---|---|
| Age | 26 - 35 | 30.82 ± 2.35 |
| Visual acuity/right eye | 8 - 10 | 9.64 ± 0.78 |
| Visual acuity/left eye | 8 - 10 | 9.82 ± 0.25 |
Table 2.
Descriptive Statistics of Qualitative Demographics Data
| Variables | No. (%) |
|---|---|
| Education level | |
| Post graduate | 2 (11.8) |
| Ph.D. | 15 (88.2) |
| Marital status | |
| Married | 7 (41.2) |
| Single | 10 (58.8) |
| Medical history (disease) | |
| Yes | 2 (11.8) |
| No | 15 (88.2) |
For each brain rhythm analyzed, a two-way repeated-measures ANOVA was conducted with 24 electrodes and three levels of task load as within-subject factors. Given the established association between frontal electrodes and theta band activity, and parietal electrodes and alpha band activity in previous research, subsequent analyses focused on a subset of 10 electrodes (F3, F4, F7, F8, Fz, P3, P4, P7, P8, Pz) centered within these respective brain regions.
The results of the study revealed a significant increase in the maximal power of theta and alpha waves in the frontal lobe (F3, Fz, F4) during the robotic task. Additionally, the maximal power of alpha, beta, and gamma waves in the parietal lobe (P3, P4, Pz) showed significant differences across the three task load conditions. Specifically, alpha power in the designated channels exhibited a decreasing trend, while beta, gamma, and theta power in the determined channels showed an increasing trend as the task load progressed through the three predetermined levels (Tables 3 and 4).
Table 3.
Electroencephalography Absolute Power Measured at Different Task Levels for a Specific Set of Channels a
| Brain Wave (Regions) and Channels | Low | Medium | High | P-Value | ηp2 | Pholm b |
|---|---|---|---|---|---|---|
| Theta (frontal) | ||||||
| F3 | 15.59 ± 0.55 | 19.22 ± 0.46 | 21.86 ± 0.46 | 0.0000 | 0.975 | P1= 3.7861E-12; P2 = 6.6851E-16; P3 = 1.3371E-10 |
| F4 | 15.92 ± 0.6 | 19.49 ± 0.58 | 21.93 ± 0.5 | 0.0000 | 0.963 | P1 = 4.1906E-11; P2 = 1.9112E-14; P3 = 5.0737E-9 |
| F7 | 16.39 ± 0.54 | 16.34 ± 0.38 | 16.61 ± 0.37 | 0.2 | - | - |
| F8 | 16.44 ± 0.6 | 16.41 ± 0.4 | 16.41 ± 0.49 | 0.8 | - | - |
| Fz | 15.6 ± 0.37 | 19.42 ± 0.54 | 22 ± 0.53 | 0.0001 | 0.988 | P1 = 3.867E-14; P2 = 7.8737E-19; P3 = 3.2343E-13 |
| Alpha (parietal) | ||||||
| P3 | 11.25 ± 0.51 | 9.11 ± 0.38 | 7 ± 0.77 | 0.0002 | 0.937 | P1 = 6.9468E-11; P2 = 3.097E-12; P3 = 2.2435E-7 |
| P4 | 11.36 ± 0.43 | 9.11 ± 0.47 | 7.28 ± 0.5 | 0.0003 | 0.948 | P1 = 1.2573E-10; P2 = 5.457E-13; P3 = 5.8784E-8 |
| P7 | 13.27 ± 0.48 | 13.36 ± 0.62 | 13.21 ± 0.41 | 0.6 | - | - |
| P8 | 13.11 ± 0.42 | 13.15 ± 0.45 | 13.47 ± 0.53 | 0.07 | - | - |
| Pz | 11.31 ± 0.49 | 9.11 ± 0.51 | 7.15 ± 0.54 | 0.00007 | 0.959 | P1 = 3.9762E-10; P2 = 3.7379E-13; P3 = 4.8679E-11 |
| Alpha (frontal) | ||||||
| F3 | 11.13 ± 0.43 | 9.07 ± 0.42 | 7.13 ± 0.67 | 0.0002 | 0.938 | P1 = 7.0232E-12; P2 = 1.2355E-12; P3 = 9.149E-8 |
| F4 | 11.25 ± 0.57 | 9 ± 0.43 | 7.08 ± 0.61 | 0.0001 | 0.933 | P1 = 4.3172E-9; P2 = 5.7815E-12; P3 = 8.5047E-10 |
| F7 | 13.37 ± 0.54 | 13.35 ± 0.5 | 13.15 ± 0.5 | 0.28 | - | - |
| F8 | 13.49 ± 0.4 | 13.51 ± 0.48 | 13.43 ± 0.53 | 0.39 | - | - |
| Fz | 11.07 ± 0.44 | 9.09 ± 0.34 | 7.32 ± 0.4 | 0.0001 | 0.953 | P1 = 9.7632E-10; P2 = 5.458E-14; P3 = 2.434E-10 |
a Values are expressed as mean ± SD
b P1, low to medium; P2, low to high; P3, medium to high.
Table 4.
Electroencephalography Absolute Power Measured at Different Task Levels for a Specific Set of Channels a
| Brain Wave (Regions) and Channels | Low | Medium | High | P-Value | ηp2 | Pholm b |
|---|---|---|---|---|---|---|
| Beta (Parietal) | ||||||
| P3 | 10.73 ± 0.51 | 13.45 ± 0.57 | 16.85 ± 0.36 | 0.0005 | 0.973 | P1 = 2.8383E-10; P2 = 1.7455E-17; P3 = 2.9694E-12 |
| P4 | 10.58 ± 0.48 | 13.45 ± 0.31 | 16.8 ± 0.64 | 0.0002 | 0.976 | P1 = 5.2999E-13; P2 = 7.3577E- 17; P3 = 2.0943E-11 |
| P7 | 12.61 ± 0.57 | 12.37 ± 0.53 | 12.43 ± 0.5 | 0.2 | - | - |
| P8 | 12.32 ± 0.39 | 12.52 ± 0.51 | 12.48 ± 0.43 | 0.43 | - | - |
| Pz | 10.7 ± 0.57 | 13.37 ± 0.45 | 16.79 ± 0.47 | 0.0003 | 0.976 | P1 = 9.0472E-11; P2 = 8.6309E-17; P3 = 2.7439E-13 |
| Gamma (parietal) | ||||||
| P3 | 10.84 ± 0.59 | 13.58 ± 0.58 | 16.74 ± 0.38 | 0.0001 | 0.974 | P1 = 1.7269E-10; P2 = 2.0546E-16; P3 =2.7259E-13 |
| P4 | 10.77 ± 0.58 | 13.75 ± 0.37 | 16.68 ± 0.62 | 0.0002 | 0.967 | P1 = 4.2864E-11; P2 = 2.8998E-16; P3 = 1.8809E-10 |
| P7 | 10.7 ± 0.49 | 10.83 ± 0.5 | 10.81 ± 0.47 | 0.6 | - | - |
| P8 | 10.74 ± 0.64 | 10.7 ± 0.38 | 10.61 ± 0.56 | 0.8 | - | - |
| Pz | 10.54 ± 0.48 | 13.43 ± 0.44 | 16.62 ± 0.56 | 0.0001 | 0.973 | P1 = 1.5129E-12; P2 = 1.7475E-15; P3 = 5.3886E-12 |
a Values are expressed as mean ± SD.
b P1, low to medium; P2, low to high; P3, medium to high.
A two-way repeated-measures ANOVA was conducted to examine theta, alpha, beta, and gamma oscillatory activity in the frontal and parietal cortices and related electrodes as a function of varying cognitive demands during a robotic task. Post-hoc analysis revealed a significant difference between low and medium, medium and low, and also between low and high cognitive load concerning all four frequency bands.
For theta in the frontal region, channel F3 [F(2,32) = 614.78, P < 0.001, ηp2 = 0.975], channel F4 [F(2,32) = 412.31, P < 0.001, ηp2 = 0.963], and channel Fz [F(2,32) = 1281.86, P < 0.001, ηp2 = 0.988] showed significant differences. Regarding alpha band power, channel P3 [F(2,32) = 236.44, P < 0.001, ηp2 = 0.937], channel P4 [F(2,32) = 290.41, P < 0.001, ηp2 = 0.948], and channel Pz [F(2,32) = 369.58, P < 0.001, ηp2 = 0.959] indicated significant differences between the load conditions. This significance for alpha band power in the frontal region for channels P3, P4, and Pz was [F(1.48,23.8) = 240.64, P < 0.001, ηp2 = 0.938], [F(1.63,26.17) = 240.64, P < 0.001, ηp2 = 0.933], and [F(1.88,30.15) = 324.273, P < 0.001, ηp2 = 0.953], respectively.
One of the most notable findings of our study demonstrates a significant relationship between varying workload levels and changes in parietal beta and gamma band power. The main effects of the gamma band were observed in channel P3 [F(2,32) = 594.84, P < 0.001, ηp2 = 0.974], channel P4 [F(2,32) = 473.87, P < 0.001, ηp2 = 0.967], and channel Pz [F(2,32) = 582.81, P < 0.001, ηp2 = 0.973]. For the beta band, significant effects were found in channel P3 [F(2,32) = 587.58, P < 0.001, ηp2 = 0.973], channel P4 [F(2,32) = 646.8, P < 0.001, ηp2 = 0.976], and channel Pz [F(2,32) = 654.69, P < 0.001, ηp2 = 0.976].
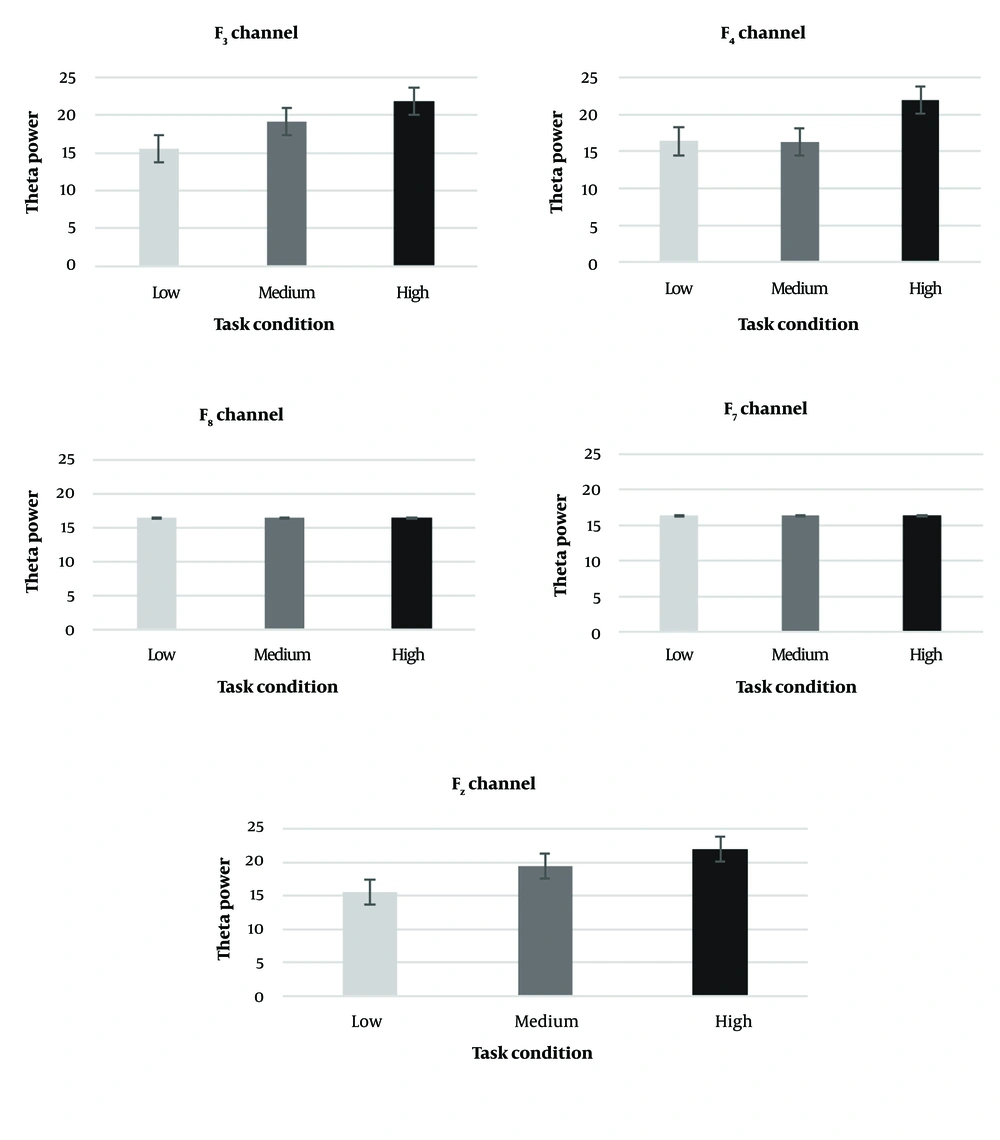
Figure 4.
Mean theta band power per frontal channel for all subjects
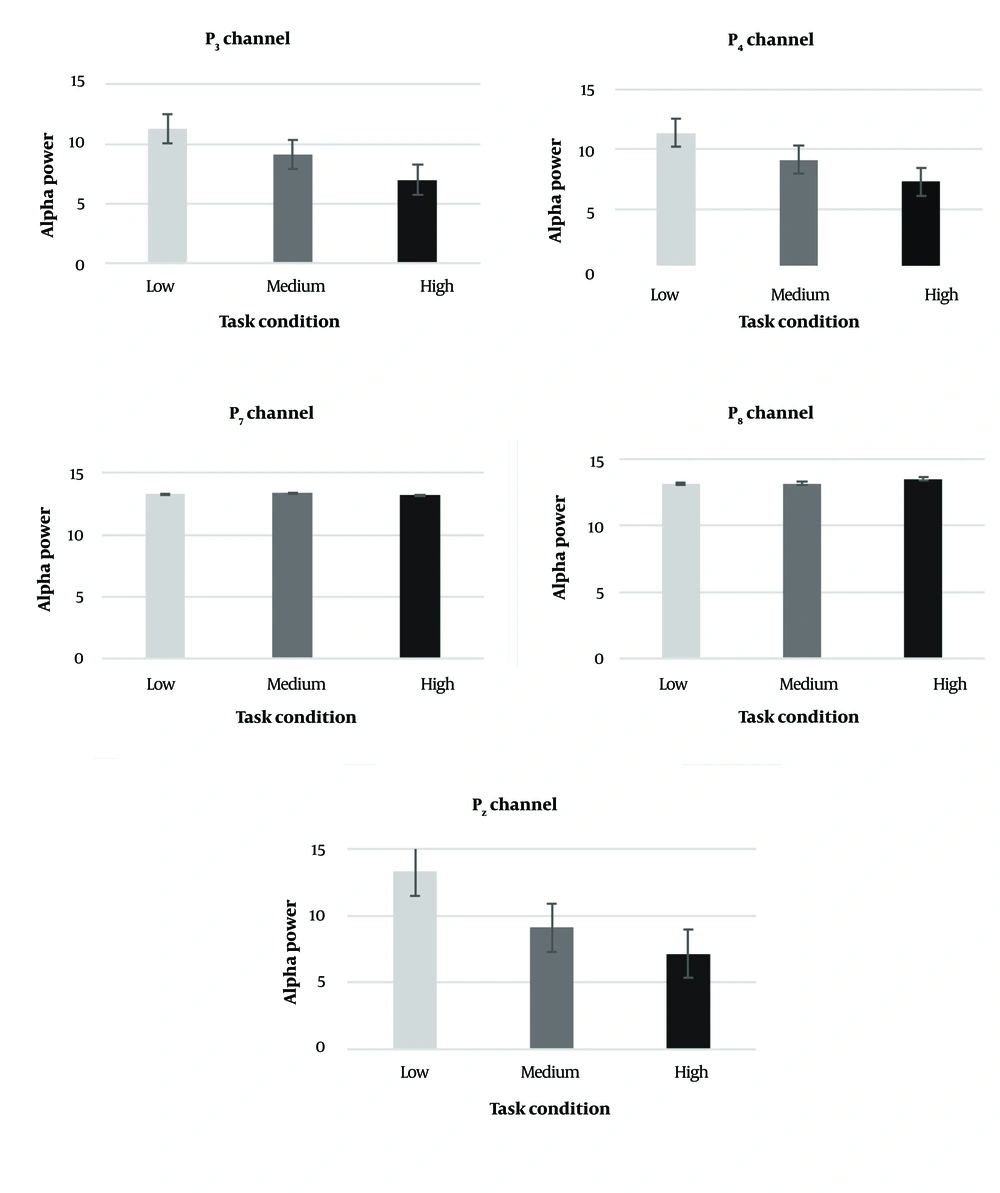
Figure 5.
Mean alpha band power per parietal channel for all subjects
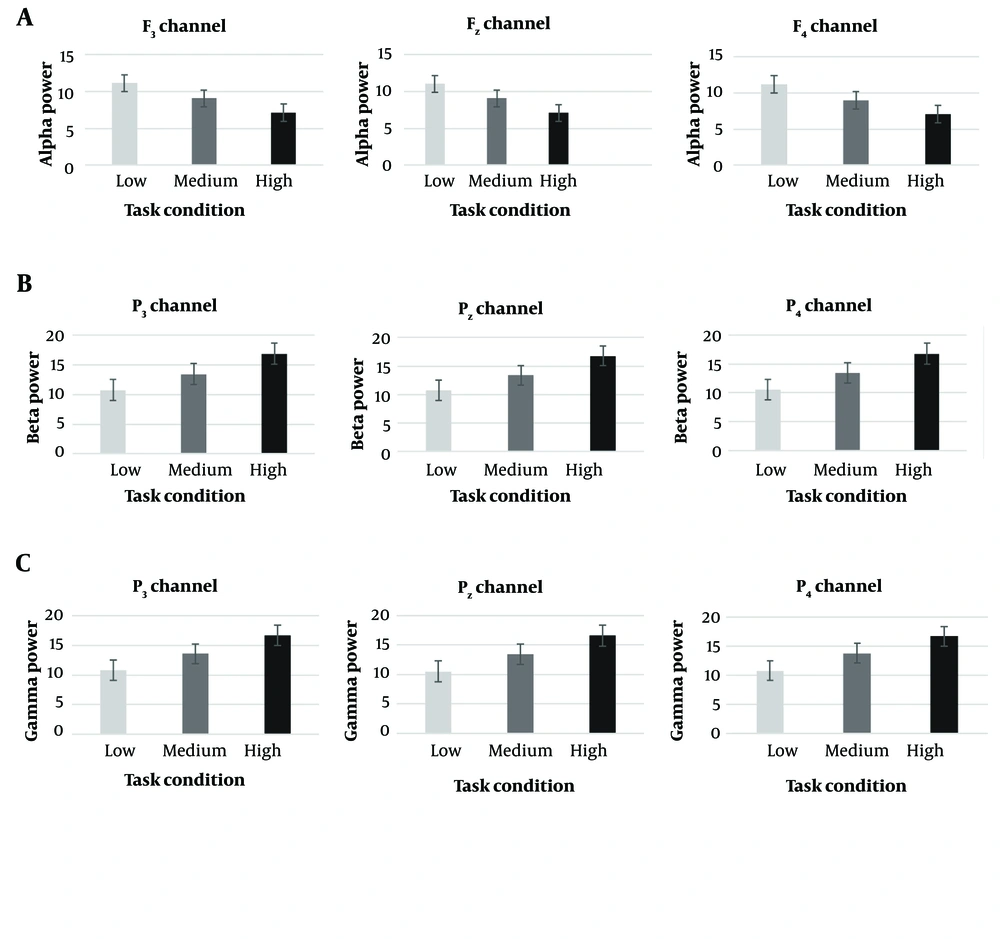
Figure 6.
Changes in alpha, beta, and gamma band power within the selected channels. The figure illustrates only those channels that demonstrated statistically significant differences between the three task load conditions. F7, F8, P7, and P8 channels didn’t show any significant differences in frequency bands.
5. Discussion
Objective assessment of MWL, particularly using physiological measures, is well-established in fields such as surgery, aviation, and driving. However, industrial operators interacting with automated systems have received less attention. With the rise of robotics, HRI in industrial settings is increasingly common. The primary objective of this analysis was to extend the scope of research in industrial HRI by concentrating on human MWL and to further advance the development of efficient and safe human-robot interface workstations.
The CWL, or MWL as synonymously mentioned above, is a fundamental concept in the field of HRI workstations. Despite its long history of study, establishing robust evaluation methods for CWL remains a challenge. The EEG, given its accessibility, has become a popular choice for investigating CWL-related cognitive processes (29). This study employs EEG to evaluate the MWL in a simulated human-robot industrial task. Employing EEG devices to assess workers' cognitive abilities offers a promising avenue for examining the MWL associated with robotic tasks and the transitions between them. This approach provides a valuable tool for understanding the cognitive demands of HRIs and optimizing task design to minimize cognitive load.
Based on previous research, three potential explanations for the inconsistent findings were hypothesized. First, the workload manipulations employed in prior studies may have been insufficient to induce significant changes in neural activity or may have reached a saturation point. Second, individual differences in baseline brain activity, task-related cognitive strategies (including attention allocation and working memory utilization), and performance levels might have obscured systematic relationships between CWL and EEG spectral power. Third, considering the growing use of robotic assistants in simulated industrial contexts, it is proposed that cognitive demand may arise as a consequence of HRI.
Theta band power in the frontal cortex is susceptible to increasing CWL. Higher task demands correlate with elevated theta activity in this region. Given the established link between frontal theta and cognitive processes such as working memory and executive function, these findings suggest that theta power may serve as a Neural Index of the brain's effort to manage and manipulate information under demanding conditions (30). A prevailing consensus in the literature suggests that elevated CWL is often accompanied by increased theta band power during ecologically valid tasks (31). However, a more in-depth examination of the empirical evidence revealed inconsistent findings regarding the relationship between CWL and theta and alpha band oscillations (32). In contrast, laboratory-based studies have demonstrated more consistent associations between theta and alpha band frequency modulations and cognitive processes such as working memory and attention (33).
In our study, the experimental findings revealed a statistically significant relationship between theta and alpha band activity in the F3, F4, and Fz channels and fluctuations in workers' mental load. Furthermore, distinct patterns were observed in the alpha, beta, and gamma bands of the P3, P4, and Pz channels during task transitions from low to high, supporting the association between cognition and the parietal region, which is in line with the study results of Klimesch, Roux and Uhlhaas (33, 34).
The observed effect sizes, as measured by partial eta-squared (ηp2), were large, indicating that cognitive load had a considerable impact on EEG activity in frontal and parietal regions. Specifically, theta power in frontal regions and alpha, beta, and gamma power in parietal regions were significantly influenced by the varying levels of task demand. Alpha brainwave power exhibits a negative correlation with CWL; as task demands increase, alpha power tends to decrease (35, 36). In our study, as the workload increased from low to high, a decrease in alpha band power was observed at the P3, P4, and Pz electrodes.
In contrast with our results, John et al., who worked on cognitive complexity during unexpected robot interaction under different MWL states in a physical human-robot collaboration, reported an increase in central alpha and beta power with increasing cognitive load (37). Traditionally associated with a state of wakeful relaxation, alpha desynchronization is a well-documented neural correlate of cognitive engagement (33, 38).
To bolster the ecological validity of our research, future investigations will be conducted in authentic HRI settings. While laboratory experiments can impose stringent restrictions on participant behavior to mitigate the influence of artifacts on EEG recordings, such constraints are infeasible in real-world work environments. Consequently, the presence of artifacts in EEG data collected in naturalistic settings presents significant challenges for data analysis. Recent investigations have emphasized the potential of particular EEG device configurations to reduce the impact of artifacts and noise stemming from physical movement. For instance, Hwang et al. employed an ear canal EEG system, a technology known for its resilience to artifacts generated by physical movement (39).
This study sought to enhance our understanding of the fluctuations in CWL experienced by industrial robot operators during simulated tasks. Power spectral density (PSD) was utilized to extract valuable insights from the participants' brain activity while they performed tasks of varying complexity. The EEG spectral power, particularly within the alpha and theta frequency bands, is a reliable indicator of human MWL. These frequency bands exhibit dynamic changes in response to fluctuating cognitive demands (3).
Future work can extend the current EEG studies to better understand the evolution of workload. This study conducted a series of measures utilizing a highly simulated remote robotic control environment to systematically investigate the cognitive demands associated with industrial automation. By employing a comparative analysis of multiple physiological measures, it is anticipated that a more nuanced understanding of the factors contributing to MWL in industrial operators will be achieved.
Finally, the overarching benefit of this research lies in enhancing the safety of operators and workers in industrial settings. By gaining a deeper understanding of the CWL experienced by robot operators during different tasks, training programs can be optimized. This optimization can also be considered for designing assistive robots and refining systems to foster successful outcomes.