


1. Background
2. Objectives
3. Methods
3.1. Study Design, Period, and Setting
3.2. Inclusion Criteria
3.3. Exclusion Criteria
3.4. Sample Size Calculation
3.5. Outcome Measures
3.5.1. Demographical and Clinical Parameters
3.5.2. Clinical Examinations
3.5.3. Chronic Pulpitis
3.5.4. Dental Caries
3.5.5. Periapical Disease
3.5.6. Severity of Dental Diseases and Disorders
3.6. Statistical Analyses
3.7. Ethics Approval and Consent to Participate
4. Results
4.1. Study Population
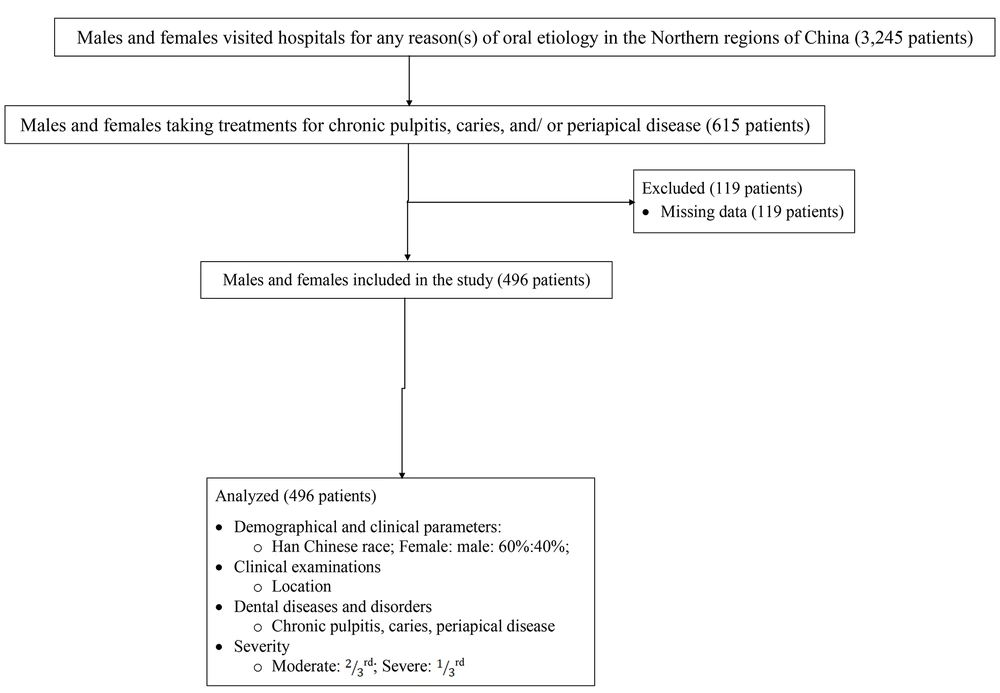
The flow diagram of the cross-sectional study
4.2. Demographical and Clinical Parameters
| Parameters | Study Population |
|---|---|
| Numbers of patients | 496 |
| Gender | |
| Male | 196 (40) |
| Female | 300 (60) |
| Age (y) | |
| Median (Q3 - Q1) | 61 (62 - 55) |
| ≥ 60 | 328 (66) |
| < 60 | 168 (34) |
| Ethnicity | |
| Han Chinese | 457 (92) |
| Mongolian | 34 (7) |
| Tibetan | 5 (1) |
| Dental issue (location) | |
| The mandibular teeth of dentistry | 295 (59) |
| The upper side of dentistry | 201 (41) |
| Dental diseases and disorders | |
| Chronic pulpitis | 301 (61) |
| Dental caries | 250 (50) |
| Periapical disease | 151 (30) |
| Subjects/diseases | |
| Chronic pulpitis | 100 |
| Dental caries | 83 |
| Periapical disease | 50 |
| Residential area of the Northern regions of China | |
| Rural | 275 (55) |
| Urban or suburban | 221 (45) |
Abbreviations: Q3, third quartile; Q1, first quartile.
a Values are expressed as No. (%) unless otherwise indicated.
b Patients may have one or more dental diseases and/or disorders.
| Parameters and Severity of Dental Diseases and Disorders | Study Population (N= 496) |
|---|---|
| Male | |
| Moderate | 118 (24) |
| Severe | 78 (16) |
| Female | |
| Moderate | 139 (28) |
| Severe | 161 (32) |
| Age (≥ 60 y) | |
| Moderate | 143 (29) |
| Severe | 185 (37) |
| Age (< 60 y) | |
| Moderate | 100 (20) |
| Severe | 68 (14) |
| The mandibular teeth of dentistry | |
| Moderate | 179 (36) |
| Severe | 116 (23) |
| The upper side of dentistry | |
| Moderate | 150 (30) |
| Severe | 51 (11) |
a Values are expressed as No. (%).
b The severity of dental diseases and disorders is classified by clinicians from adult dentistry and the department of endodontics.
c The international guidelines were used for the assessment of severity.
| Dental Diseases and Disorders and Severity | Study Population (N = 496) |
|---|---|
| Chronic pulpitis | |
| Moderate | 182 (37) |
| Severe | 119 (24) |
| Dental caries | |
| Moderate | 148 (30) |
| Severe | 102 (20) |
| Periapical disease | |
| Moderate | 101 (20) |
| Severe | 49 (10) |
a Values are expressed as No. (%).
b The severity of dental diseases and disorders is classified by clinicians from adult dentistry and the department of endodontics.
c Moderate caries: Superficial caries, severe caries: Deep caries.
d The international guidelines were used for the assessment of severity.
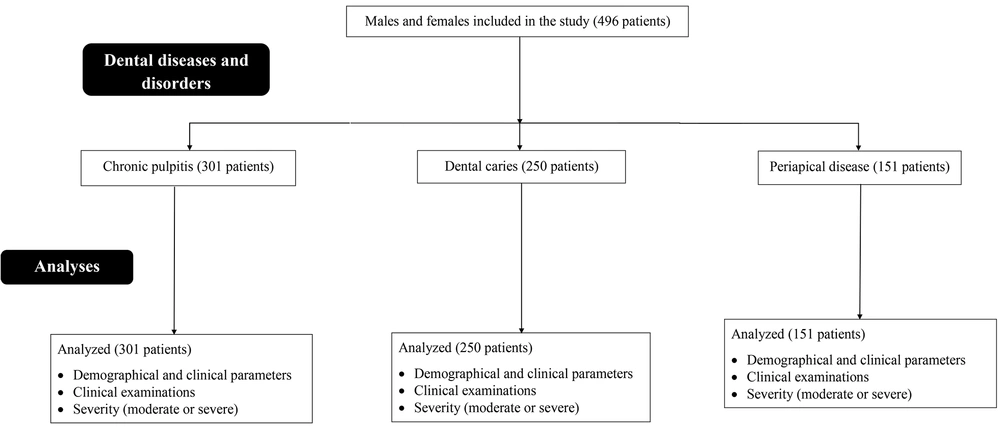
The study chart according to dental diseases and disorders. The international guidelines were used for the assessment of severity.
4.3. Relationship Between Demographical Parameters and Clinical Examination Results
| Parameters | OR | 95% CI | P-Value |
|---|---|---|---|
| Gender (female vs. male) | 1.4561 | 1.1124 - 1.6411 | 0.041 |
| Age (≥ 60, y vs. < 60, y) | 1.6452 | 1.2241 - 1.8521 | 0.045 |
| Ethnicity (Han Chinese vs. others) | 0.5412 | 0.4123 - 0.6123 | 0.6123 |
| Dental issue (mandibular teeth of dentistry vs. upper side of dentistry) | 1.8952 | 1.4581 - 2.0211 | 0.046 |
| Residential area (rural vs. urban or suburban) | 0.6145 | 0.5142 - 0.7123 | 0.9854 |
Abbreviations: OR, odd ratio; CI, confidence interval.
a Multivariate analysis (logistic regression analysis).
b An odd ratio of more than 1 and a P-value less than 0.05 were considered significant.
5. Discussion
| Studies | Population of Dental Caries in the Study Population (%) |
|---|---|
| Current study | 50 |
| Retrospective study on the Mexican population | 84.07 |
| CNOHEV 1983 | 56 |
| CNOHEV 1995 | 60.53 |
| CNOHEV 2005 | 50.34 |
| CNOHEV 2015 | 62.13 |
| Survey on oral health status of Chinese residents | 68.98 |
| Case series on North American population | 59.18 |
| Cross-sectional study on the Indian population | 26 |
| Meta-analyses on mainland China: Evidence from 1980 to 2018 | 52 |
Abbreviation: CNOHEV, Chinese National Oral Health Epidemiological Investigations.
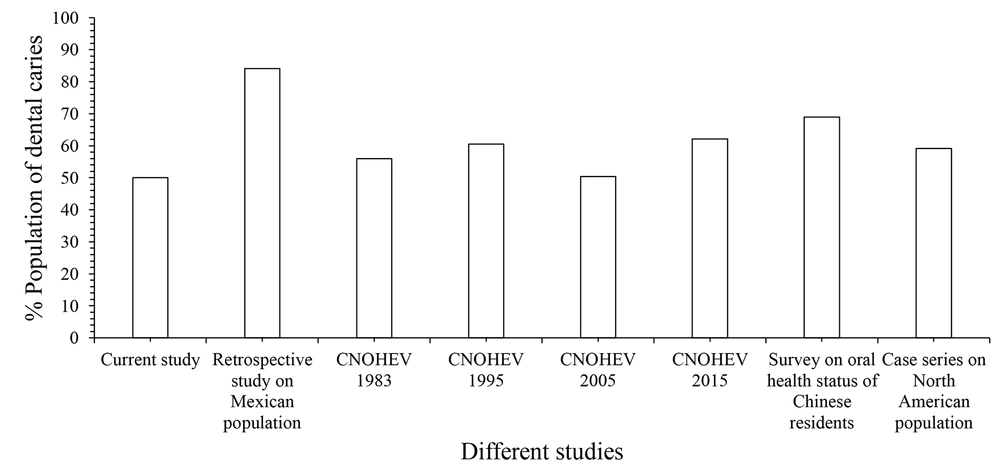
Graphical presentation of the population percentage of dental caries for different studies. CNOHEV, Chinese National Oral Health Epidemiological Investigations.
| Study | Published Year | Study Population | Sample Size (N, Teeth) | Age Range (y) |
|---|---|---|---|---|
| Retrospective study Perez et al. (1) | 2023 | Mexican | 683 | (0 to > 60) |
| Cross-sectional study Almeida et al. (2) | 2021 | Brazilian | 2,500 | 10 > to > 80 |
| Case series Scavo et al. (4) | 2011 | North America | 975 | 7 - 86 |
| Meta-analysis Janakiram et al. (8) | 2020 | Indian | 92,219 | Adults |
| Retrospective study Zhang et al. (12) | 2022 | Sichuan, Nanchong region of China | 537,878 | 3 - 74 |
| Case series Survey Si et al. (18) | 2019 | 31 provinces, cities, and autonomous regions of China except Hong Kong, Macao, and Taiwan | 172,425 | 3 - 75 |
| Cross-sectional study Liu et al. (20) | 2015 | Northeast China | 1,188 | 35 - 74 |
| Cross-sectional study Sadeghivand et al. (21) | 2023 | Tabriz, East Azerbaijan province, Iran | 300 | 37 ± 8.89 |
| Cross-sectional study Rambabu and Koneru (23) | 2018 | Indian | 1,800 | 2 |
| Survey Abrahamian et al. (24) | 2022 | Spanish | 174 | All age |

