1. Background
The impacts of climate change on public health were published in the intergovernmental panel on climate change (IPCC) 2014 report (climate change 2014: impact, adaptation, and vulnerability). Climate change affects the social and environmental determinants of health. The potential health impacts caused by global climate change include temperature-related illness and death, extreme weather-related health effects, air pollution-related health effects, waterborne and food borne diseases, vector-borne and rodent-borne diseases, food and water shortages, and population displacement (1, 2). Extreme weather events, heat waves, and air pollution are linked to adverse specific health effects on cardiovascular and respiratory systems (3-6). There is a complex interaction among air pollution, weather, and human health outcomes (7). Future air pollution-related morbidity under climate change projection may be of interest for studying the effect of climate change on air quality and the potential health effects (8-10). Predicting the future health impacts of air pollution due to climate change is a complicated phenomenon that requires a multidisciplinary approach (3, 7). This is feasible by simulation and mathematical modeling. Until now, predicting the future regional health impacts of climate change and air pollution is one of the key research gaps and furthermore needs innovative approaches (8, 11).
Recently, climate change projection, air pollution, and their health consequences are widely studied (8, 9, 12). The majority of such studies focused on O3-and PM2-5-related health outcomes at global or regional level. Changes in climate and air pollution emissions affect future air quality. Both air pollutants and climate variables have different health impacts, and hence, most of the projections are driven by climate change scenarios and/or future air pollution emissions (8, 9, 13-15). According to the findings by Szyszkowicz et al. in Canada, statistically, air pollution had important effect on ED visits for headache and migraine (16).
To understand future changes in climate, general circulation models (GCMs) are used by researchers and climate experts. Since 1992, IPCC task group on data and scenario support for impact analysis (TGICA) produced climate change scenarios and released in their assessments reports (AR). Latest sets of these scenarios are known as representative concentration pathways (RCPs) (17). They were used in the assessment report five (AR5). RCP8.5, RCP6, RCP4.5, and RCP2.6 (RCP3) are pathways that are common reference points in climate change studies (17, 18). These scenarios can be used to project future climates based on various GCM outputs. GCMs have a coarse spatial resolution, which can create problems to simulate some regional or local applications. Statistical downscaling and regional modeling are the most popular regionalization techniques used in impact assessment studies.
Statistical downscaling is a technique that can produce high-resolution climate data and requires identification of the statistical relationship between regional or local climate variables and GCM outputs (as predictors). Then, the abovementioned relationships are used in GCM experimental outputs to project future climate pattern at the regional or local level under RCP scenarios.
Stochastic weather generators (WGs) are computer models that produce synthetic daily or sub-daily time series and the resolution is based on statistical characteristics of the historical climate at the regional or local level. LARS-WG is one of these WGs (19).
Since 1990, several studies are conducted to determine the interaction among climate condition, air quality, and their health consequences. The correlation between air quality and hospital admission due to chronic and accrue respiratory and cardiovascular diseases are released by some researches (20). Air Q2.2.3 is used to find excess cases of the cardiovascular and respiratory mortality (21). Most of the linear and nonlinear statistical methods applied to various applications include multiple linear regression, principal component analysis, empirical orthogonal component analysis, independent component analysis, cluster analysis, land use regression, fine resolution atmosphere, multi-pollutant exchange, stochastic, and artificial neural networks (ANNs). Several studies applied ANNs to forecast and predict the concentration of one or more air pollutants over an area, as well as to identify health consequences. The researchers also demonstrated the advantages and disadvantages of the ANN method. At the beginning of the current study, an algorithm was developed and tested to improve the performance and solve the limitations of the ANN technique (22). MLP is also used to investigate environmental problems (23). Both air pollution episodes and extreme weather events are two environmental stressors.
2. Objectives
The current study mainly aimed at simulating the climate change impact on emergency medical services (EMS) clients caused due to air pollution to estimate the EMS clients’ trends in cardiovascular and respiratory morbidity by the year 2050 and also to forecast short time number of clients. It is necessary to support the efforts to mitigate and prevent the response to the impact of climate change on public health in large cities.
3. Methods
3.1. Study Area and Data
The current study was conducted in Tehran, Iran (35°41′N, 51°25′E), situated at an altitude of 1000 - 1800 m above the sea-level. In this megacity about 5521 out of all 47,284 mortality cases were due to air pollution in 2010 (24). The daily average and three-day moving average of meteorological variables (maximum temperature, minimum temperature, precipitation, wind speed, and relative humidity), air pollutants (carbon monoxide, ozone, nitrogen dioxide, sulfide dioxide, and particular matter < 10, 2.5 µm in diameter), air quality index, and stability class were used as model inputs. Current day and 1, 3, 5, and 7 days after EMS clients with cardiovascular and respiratory problems were selected as model outputs. To select the best combination of these inputs and outputs, a process was designed and tested to preprocess and optimize the data model. This step was published in a previous article (22) and described the best combination of air pollutants and weather variables that were most likely to influence the quantification of EMS clients with cardiovascular and respiratory symptoms.
To quantify the specific health impacts of future air quality, the primary framework that integrated data from 1- recorded air pollutant concentrations and observed meteorological variables in the study area (regional weather data and air pollution data), 2- GCM outputs for grid box within which the study area is located (simulated or modeled, historical and future, weather datasets), and 3- the number of EMS clients with respiratory and cardiovascular problems was used.
3.2. Projecting Future Climate Patterns, Climate, and Air Pollution Scenario
In the current study, two of the RCP scenarios, RCP8-5and RCP2.6, which assume a relatively high and low future pathway, respectively, were selected. Ten GCM climate model outputs (USA NASA-GISS-E2-H, UK HadGEM2-ES, South Korea HadGEM2-AO, Norway NorESM1-M, Japan MIROC-ESM, Germany MPI-ESM-LR, France IPSL-CM5A-LR, Canada CanESM2, Beijing BCC-CSM1.1, and Australia CSIRO-Mk3.6.0) were used to project the future climate. In the current study, change factor method was used. Furthermore, statistical downscaling approach was applied to downscale daily outputs from the selected GCMs for the study area (25). The latest version of LARS-WG version 5-5, which is one of the successful downscaling tools, was applied to project high-resolution climate condition in the study area (19). The process of generating local-scale daily climate data was performed in three steps as follows:
A. Site analysis or model calibration: thirty-year observed daily weather data (1976 - 2005, recorded daily in Mehrabad synoptic station) were analyzed to determine their statistical characteristics. The Kolmogorov-Smirnov (K-S), t test, and F test were applied to compare the probability distributions, mean values, and standard deviation (19).
B. Model validation: By comparing the statistical characteristics of the observed and synthetic weather series, generated by the WG, the presence of any statistically significant difference was determined among the parameters (19).
C. Generation of future weather data: LARS-WG is usually adopted to regionalize or statistically downscale the conditioning of the parameters on GCM outputs as predictors. The final version of LARS-WG was not incorporated into the new set of climate scenarios released in the IPCC-AR5. However, the current study intended to use the new set of phase 5 of the coupled model inter-comparison project (CMIP5) released in the IPCC-AR5 (26).Thus, the RCP scenario fills were produced by comparison of the observed climate data in the study area, and the GCM outputs were then applied on the LARS scenario fill to calibrate it to generate future weather data.
The climate model outputs were downloaded from the IPCC-data distribution center (DDC) site, which were historical experiments (1976 - 2005) and future experiments (2020 - 2049). The future experiments consisted of four RCP scenarios termed as RCP8-5, RCP6, RCP4.5, and RCP2.6. However, the current study selected RCP8-5 and RCP2.6. ArcGIS10.2 was used to display Net-CDF (network common data form) files. Furthermore, all these variables were transferred to Excel.
The monthly averages of all groups (historical and future) were calculated separately. Then, the abovementioned information of the two selected groups was compared. Finally, future daily meteorological variables were generated or simulated within the LARS-WG application. Validation of these outputs was performed again.
3.3. Simulation
To simulate the climate change impacts on EMS clients caused due to air pollution, ANN was applied. Neural network is a powerful computational data-driven model that can capture and represent a linear and nonlinear complex input or output relationship (27-30). Multilayer perceptron (MLP) known as a supervised learning network is the most commonly used neural network model. MLP can create models that correctly map from input to output using historical data; therefore, the model can then be used to produce the output when the desired output is unknown. The primary advantages of MLPs are that they are easy to use and can approximate any input or output map. The key disadvantages are that they train slowly and require extensive training data. The software package Neuro-Solutions for Excel, version 5.05 (Neuro-Dimension, Inc. Gainesville, FL, USA, Neuro-Solutions Getting Started Manual Version 5) was used to develop the NN model. Neuro-Solutions are an icon-based simulation environment for neuro-computing (www.nd.com). Thirty-year (during 1996 - 2005) observed climate and air pollution datasets were tagged as inputs in an ANN and the number of EMS clients with cardiovascular and respiratory problems were tagged as desired in an ANN model for training, cross-validation, and testing.
MLPs were selected to create a neural network. MLPs are layered feed forward network models that are typically trained with static back propagation. After randomization of the datasets and 60% of daily 30-year 16 inputs, 10 outputs of the abovementioned datasets were applied for training, 15% for cross-validation, and 25% for testing the network. A genetic algorithm (GA) was used to optimize the NN (22, 29). The trial-and-error approach was applied to develop and setup an appropriate neural network structure. Mean square error (MSE), root mean square error (RMSE), coefficient of determination (R2), correlation coefficient (r), normalized mean square error (NMESE), and mean absolute error (MAE) were the six primary model performance statistics used to assess the accuracy of the estimate (31). Finally, the projected climate and air pollution datasets were applied in the optimized ANN to estimate the future (2020 - 2050) trends of EMS clients under the two RCP scenarios.
4. Results
To generate local-scale daily climate data, 30 years of observed weather data (1976 - 2005) in the study area site were analyzed to compute site parameters using LARS-WG. The parameter file was applied to generate synthetic daily weather data in Mehrabad site, the observed and synthetic data were compared, and then the WG was calibrated. LARS-WG was used a scenario file to determine how the WG parameter values could be perturbed. Changes in the average values of monthly P, Tmax and Tmin between the 1976 - 2005 baseline period and 2020 - 2050 future period were derived from the output of GCMs for grid box within which Mehrabad is located. In this regard, two RCP scenario files (RCP2.6and RCP8.5) were applied to generate future daily weather data by LARS-WG. The downscaled monthly mean values of P, Tmax and Tmin under RCP2.6 and RCP8.5 were plotted versus the historical amounts and are shown in Figure 1. It could be concluded that, overall, RCP2.6 and RCP8.5 predict a wetter and warmer climate in the current study area by the year 2050.
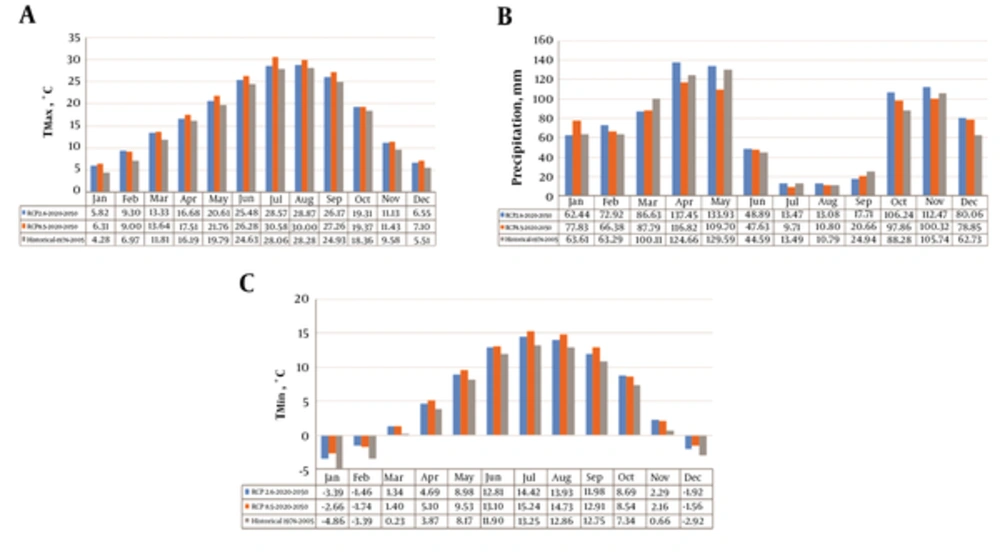
Figure 1.
Future monthly mean of A, precipitation (p); B, maximum temperature (Tmax.); C, minimum temperature (Tmin)
To simulate the impacts of climate change on EMS clients with cardiovascular and respiratory issues caused due to air pollution, a feed forward MLP type of ANN was applied. The trial-and-error approach was used to create a network and training multiple times while varying any one of the network parameters to search for the optimum network. To protect against overtraining, cross-validation was conducted as well, and the network performance was tested. The topology of the optimized NN is shown in Figure 2. This figure shows that the number of hidden layers is one, Tan Axon sets as the layer’s transfer function and Momentum as learning rule, and also GA checkboxes are used to determine the parameters. The average final MSEs were 0.035 and 0.02 with standard deviations of 3.9E-05 and 0.0001, respectively for training and cross-validation. This resulted in 15 epochs for learning and four epochs for cross-validation approaches.
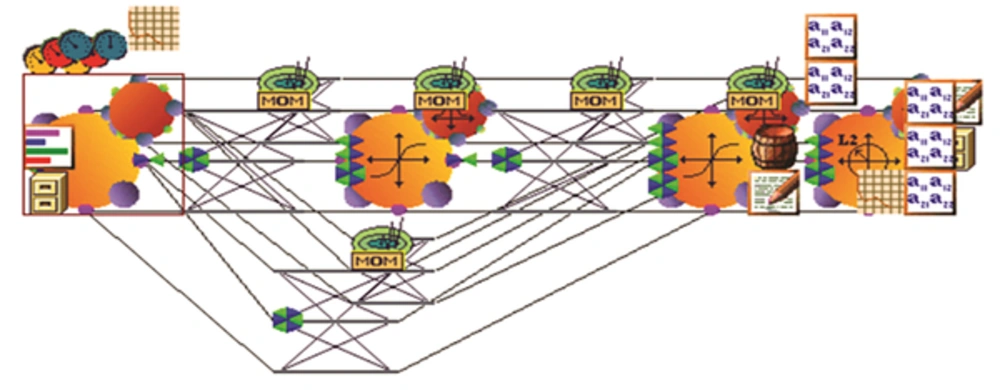
Figure 2.
Optimized ANN structure for simulation in the study
To determine the underlying relationships between the inputs and outputs, as well as to improve the network performance, sensitivity analyses were performed. Sensitivity analysis of the mean of inputs showed that EMS clients with cardiovascular problems were more sensitive to three-day moving average SO2, three-day moving average NO2, and Tmax and Tmin; furthermore, EMS clients with respiratory problems were more sensitive to three-day moving average wind speed (WS), Tmax, and precipitation (P). The results of these parameters are summarized in Table 1, which shows a measure of the relative importance among the inputs (predictors) that calculates the variation in the target variables with the variation of inputs.
Table 1.
Results of Sensitivity About the Mean of Each of Predictors
| Sensitivity | Cardiovascular | Respiratory |
|---|---|---|
| Tmax | 0.53190158 | 0.232535115 |
| 3-day moving average Tmax | 0.336387868 | 1.144083461 |
| Tmin | 0.115081212 | 0.120029121 |
| 3-day moving average Tmin | 0.979074374 | 0.257855563 |
| Precipitation | 0.355735772 | 0.190726985 |
| 3-day moving average Precipitation | 0.449601238 | 0.619868614 |
| 3-day moving average wind speed | 0.028363058 | 4.472595579 |
| Humidity | 0.242542928 | 0.030085166 |
| 3-day moving average Hu | 0.240278173 | 0.326288843 |
| 3-day moving average CO | 0.081577202 | 0.195392013 |
| 3-day moving average O3 | 0.51373712 | 0.182691071 |
| 3-day moving average NO2 | 1.024564819 | 0.004833397 |
| 3-day moving average SO2 | 2.263323925 | 0.257004889 |
| 3-day moving average PM10 | 0.229622641 | 0.169582589 |
| PM2.5 | 0.148106034 | 0.044413066 |
| 3-day moving average AQI | 0.124022738 | 0.107803453 |
To estimate the future trend of EMS clients, the projected scenario’s datasets were applied on the optimized NN data-driven model. These datasets contain daily values of climate variables and air pollutants for 30 years (2020 - 2049). The trends of the EMS clients with cardiovascular and respiratory problems for the years 2020 - 2050 under the two scenarios (RCP2.6 and RCP8.5) are shown in Figure 3.
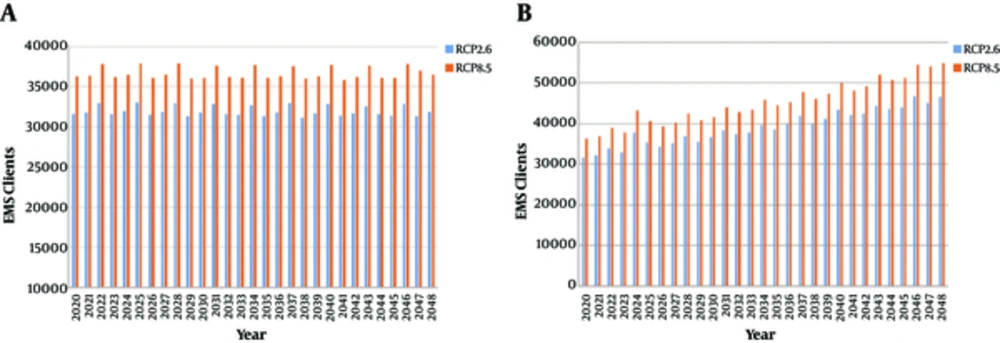
Figure 3.
Trend of A, respiratory; B, c EMS clients by 2049
It can be concluded that both problems increase by the year 2050 and cardiovascular problems further increase under the RCP8.5. Further cardiovascular problems occur in summer and winter.
Simulated monthly averages of respiratory and cardiovascular EMS clients under the two RCP scenarios are shown in Figure 4. Further cardiovascular problems occur in summer and winter.
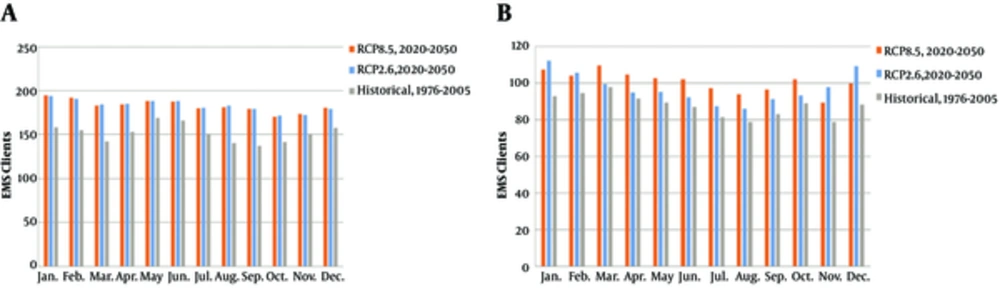
Figure 4.
Monthly average of A, respiratory and B, cardiovascular EMS clients
Monthly averages of respiratory and cardiovascular EMS clients are shown in Figure 4. The least emergency respiratory clients are in warmer months (June, July, and August) and further in December, January, and February under RCP2.6.
5. Discussion
Several studies applied ANNs to predict the concentration or emission of one or more air pollutants in an area (9, 27, 28, 30-34). They applied various methodologies to forecast future air pollution conditions, as well as climate change impacts on air quality. They focused on this issue and investigated it as an open problem. Recently, studies are conducted to project future air pollution-related mortality or morbidity under a changing climate, although each of them has limitations (8). GCMs or regional climate models are used to project future air pollutant levels and their health consequences (35). GCMs or regional climate models (RCMs) are used to project future air pollutant levels and their health impacts by researchers. They closely examined the uncertainties in this project and investigated projection on a regional scale, in addition to using multiple models to reduce these uncertainties (8). In the current study, 10 GCM experimental outputs were applied and compared with the 30-year recorded meteorological values. Dynamical or statistical high-resolution downscaling technique was used to estimate health consequences caused due to air pollutants (13). In the current study, statistical downscaling was performed using LARS WGs to analyze and project future climate pattern under two RCP (2.6 and 8.5) scenarios. Furthermore, in the current study, LARS-WG was calibrated for these new scenarios to generate future climate patterns.
Data-driven models such as ANNs were used to simulate air pollutant concentrations and their health outcomes (28, 31, 33, 36, 37). Thomas and Jacko developed a multivariate regression and ANN model to forecast PM2.5 and CO around an expressway (Borman). They applied the wind speed, wind direction (transformed in to wind direction Index), pressure, temperature, and the speed of the vehicles as inputs and CO and PM2.5 as targets. By stepwise regression, they found that the wind speed, wind direction, and temperature did not improve the model performance. MLP ANNS was used by the MATLAB software. The current study investigated both the regression and ANNS successfully used to forecast air pollution episodes. They can be improved by including more input variables. However, ANNS had a better performance than regression due to the ability to model nonlinearity (38). In another study, three standard MLP, time- lagged feed- forward, recurrent ANNs and Bayesian ANNs were developed by Solaman et al. for ground-level ozone concentration forecasting in Hamilton, Canada. SR, TMax, WS, W direction, RH, dry-bulb temperature, and vapor pressure were meteorological variables for the ozone forecasting. They showed that all of these models could effectively forecast the ozone concentration (31). Diaz-Robles et al. compared the applicability of autoregressive integrated moving average (ARIMA), multi-linear regression (MLR), and ANNS separately and in combination with air quality forecasting in emergency situations and found that a combination of the ARIMA-ANNS model was more accurate to forecast pre emergency air pollution episodes (39). Moustris et al. used the MLP feed forward ANNS to forecast the maximum daily value of NO2, CO, SO2, and O3 in Athens, Greece. They compared seven structures of ANNS and found that it was necessary to increase the input to obtain reliable forecasts (28). Noori et al. tested principal component analysis (PCA) and GT to assess the effect of input variables on support vector machine (SVM) to predict stream flow. They reported that preprocessing the inputs with both PCA and GT methods improved the SVM performance (40). Inal developed MLP type ANNS with nine meteorological items and nine air pollutants to predict ozone in Istanbul, Turkey and compared its performance with nonlinear regression, but found no significant difference between the two methods (27). In this field, GA is applied to optimize the ANN topology (29, 41). The researchers applied GA only to optimize NN architecture, but in the current study, gamma statistic and GA were used to preprocess and optimize the data-driven model and determine the best combination of predictors. This could prevent the over-fitting of NN. In the first stage of the current study, an algorithm was developed to improve the capability of this technique to simulate the health effect of air pollution, published earlier (22). Moreover, optimizing the file parameters, process elements in input/hidden/output layer, transferring or learning functions using GA were performed in the second stage of the current study. The MLP type of NN was used to develop the data-driven model to forecast the short-time effects of weather variables on air pollution or predict the emergency department visit for respiratory symptoms. The researchers setup their NN with one to eight hidden layer(s) and loaded a maximum of eight weather and air pollutant variables; furthermore, these variables should optimize the MSE to about 0.04 (28, 33, 37, 41). In the current study, more predictors were considered to simulate future trend of two desired outputs and develop a simpler model with one hidden layer, realizing MSE of about 0.035 in training and 0.02 in cross-validation. However, the eliminated inputs had a low effect.
Bibi et al. demonstrated that emergency department visits were sensitive to temperature, humidity, barometric pressure, SO2, and NO2 (37). Moreover, dependence of air quality on meteorological variables was assessed by −, =, +, and ++ signs (2). In the current study, sensitivity values of current day and three-day moving average values of each of the inputs on the prediction of EMS clients with cardiovascular or respiratory problems were determined (Figure 3). Annual or monthly trends of EMS clients with cardiovascular and respiratory problems depended on changes and interactions of air pollutant levels and meteorological conditions (Figures 3 and 4).
5.1. Conclusions
Results of the current study demonstrated a warmer and wetter climate pattern in the studied area by 2050, by projecting the future climate using outputs from GCMs under the RCP2.6 and RCP8.5 scenarios using statistical downscaling. LARS-WG is an efficient tool to generate, analyze, and compare between synthetic and observed climate variables. Estimation of the future (2020 - 2050) trend of EMS clients with cardiovascular and respiratory symptoms using the feedforward MLP type ANN indicated an increase in these annual trends under both RCP scenarios, although further increase is under the RCP8.5 for cardiovascular problems and the least increase is under RCP2.6 for respiratory problems.
Sensitivity analysis of the mean of predictors demonstrated more efficient climate and air pollution variables that were different for EMS clients with cardiovascular and respiratory problems.
ANN is an executive tool for the simulation of the impacts of climate change and air pollution on public health to estimate future trends of related morbidity and to forecast short-term cases across the world. Tools and algorithms applied in the current study can be used for early warning in emergency air pollution condition. Moreover, these findings can apply for emergency response planning in the future.
5.2. Limitations of the Study
- Lack of international classification of diseases (ICD) in EMS records.
- Mehrabad station had upper atmospheric surface level data between five other stations. Therefore, the current study used just this station’s data to calculate the stability class.