
1. Background
In the last few decades, pesticide contamination of water resources has emerged as a worldwide ecological concern. These compounds also have been detected in surface water and in bed sediments that its documents are available. Their concentration in aqueous sources is very variable and much higher concentrations of them have been reported in the effluents of farmlands.
Organophosphorus pesticides are the most common pesticides in the world. Unfortunately, their uncontrolled consumption in many parts of the world has contributed to their overabundance in the environment (1, 2). The pesticides used in agriculture can find a way into the surface water bodies through irrigation and precipitation which results in pollution of these waters (3). One of these pesticides is Malathion [(2dimethoxyphosphorothioyl) sulfanyl], which is a frequently used pesticide. The pesticides are widely used to increase the productivity of agricultural products as well as to control the diseases transmitted by arthropods (4). Organophosphorus pesticides such as Malathion are considered a serious threat to human health due to their effects on the cholinesterase activity and central nervous system disorder (5). Malathion may persist in water with a half-life of months or even years. The World Health Organization (WHO) has set the pesticide in drinking water at 0.1 µg L-1 (6).
Malathion has a high solubility in water and its removal by conventional treatment processes such as sand filtration and coagulation is a really difficult process (7). Results from the previous studies indicate that in order to eliminate these pesticides, various methods such as photocatalytic degradation (8), biological oxidation (9), advanced oxidation processes (AOPs) (10), and adsorption (11, 12) have been employed. Among these techniques, adsorption process is a desirable method to remove pesticides. The adsorption technique is known for its simplicity, reliability, safety, and low costs that is an economical and effective method, and also a friendly environmental process (13-15).
The silica compounds are a desirable adsorbent because of the ability of their surface functional groups to adsorb target pollutants (16, 17). Diatomite soil, also called biosilica, is a porous biodegradable silica stone containing 87.0% - 91.0% silicon dioxide. Because of high surface area and active-surface agents, the biosilica is a suitable adsorbent for adsorbing contaminants from water solution (18, 19). Among the various adsorbents, nanostructured adsorbents have attracted the attention of researchers as a result of their vast surface area and their very active surface sites rather than large adsorbents (20, 21). One of the well-known nanostructures is magnetite nanoparticles that have been used owing to its surface area, and its ability in combination with other adsorbents in the synthesis process of nanoparticles (22, 23). In addition, the main advantage of magnetite nanoparticles is to be easily separated from aqueous solutions by an external magnetic field. However, its adsorption capacity and selectivity are not satisfactory, and also has shown to have poor stability in acidic conditions (13). One of the great problems in the use of nano-sized adsorbents is the separation and recycling of the adsorbents. In order to achieve this objective is to fix the adsorbent material inside another material. Polymeric compounds such as chitosan and alginate are the most widely used materials and they are suitable for stabilizing nanoparticles. Among the various polymers, alginate is considered an important category of organic matter. Alginate has unique properties such as environmental compatibility, low cost and non-reactivity in the adsorbent composition (14, 24). However, using sodium alginate/biosilicate/magnetite (SABM) nanocomposite for removal of Malathion has not been reported in the literature.
2. Objectives
The purpose of this study was to determine the efficiency of SABM nanocomposite in the removal of Malathion from aqueous environments. The possible impact of several parameters such as contact time, pH, initial Malathion concentration, temperature, and adsorbent dosage on the sorption process were investigated. The Langmuir and Freundlich adsorption isotherm was used to evaluate the adsorption capacity of SABM.
3. Methods
3.1. Chemicals
In this study, sodium hydroxide (NaOH), hydrochloric acid (HCl), acetic acid (CH3CO2H), ferric chloride (FeCl3.6H2O), ferrous sulfate (FeSO4.7H2O), sodium triphosphate (Na5P3O10), ammonia solution, and sodium alginate were from Merck and Diatomite was from Sigma Aldrich. Also, Malathion, 95.0% of active ingredient was purchased from Sigma Aldrich. To make solutions needed by the experiments, deionized water was used.
3.2. Preparation of Adsorbent
There are two main steps in preparation of the adsorbent used in this study. First, making magnetite nanoparticles. Second, preparing the nanocomposite of SABM. These two steps are explained in the following.
3.3. Preparation of Magnetite Nanoparticles
A chemical coprecipitation method was used to prepare the magnetite nanoparticles. In this method, FeSO4.7H2O and FeCl3.6H2 were first dissolved in a 1:1 ratio with a concentration of 3.2 M in the deionized water. The mixture was stirred in the presence of nitrogen gas at 80°C for 30 minutes. Then the ammonia solution with a purity of 25.0% was added to the mixture to reach the pH 10, and again it was washed under nitrogen gas for 60 minutes. The resulted magnetite nanoparticles were separated from the solution using a magnet, and then it was washed several times with ethanol and deionized water. The washed nanoparticles were dried at 70°C for 24 hours (25).
3.4. Preparation of Sodium Alginate/Biosilicate/Magnetite Nanocomposite Adsorbent
To prepare the nanocomposite, first 1 g of sodium alginate was added to 100 mL of acetic acid solution (1 M) and mixed for 2 hours. Then 1g of biosilicate and 1g of magnetite were added to the solution, and that was stirred by a stirrer at a fixed speed. To remove all bubbles in the solution and to obtain a no-bubble mixture, the resulting mixture was placed under a stable situation for 10 hours. In the next, a 100 mL mixture of NaOH (15.0%) and ethanol (95.0%) with ratio of 4:1 was prepared, and then the mixed solution of sodium alginate/biosilicate/magnetite was added to the mixture using a droplet, and then the solution was stored for 24 hours to form granular particles. Then the granular particles were washed with distilled water and dried at the ambient temperature to reach a constant weight. Finally, the dried mixture was chopped and then it was passed through a sieve to obtain the nanocomposite in a proper size (26). In the following, sodium alginate/biosilicate/magnetite nanocomposite adsorbent was signified by abbreviation of SABM adsorbent.
3.5. Characterization of SABM Adsorbent
A scanning electron microscope (SEM, Jeol ModelJsm-T330) with equipped an X-ray energy spectroscopy (EDX) under vacuum stable was used to determine the surface morphology and composition of the prepared SABM adsorbent. The crystal structure and purity of the SABM adsorbent particles in this work were characterized by X-ray diffraction (XRD) patterns, which were obtained on a Bruker D8 Advance X-ray diffractometer with Cu Kα radiation. The diffraction images were recorded at 40 mA and 40 kV in the 2θ range of 10° - 80°. Also, to recognize the SABM adsorbent functional groups involved in the adsorption process, it was used a Fourier transform infrared (FTIR) adsorption spectrophotometer (JASCO, FT/IR-6300Japan) using KBr disc method. The FTIR adsorption spectra were recorded in the range of 400 to 4000 cm-1.
3.6. The pH at Point Zero Charge (pHzpc)
To determine pH at zero pH point (pHZPC) of the SABM adsorbent, the following steps were conducted. At first of all, a sufficient amount of 0.1 M NaNO3 solution was spilled into 250 mL flacks and their pH was adjusted between 2 and 11 by either 1 M HCl or NaOH. The whole volume of the solution in each flask was reached to 100 mL by adding NaNO3 solution of the same known concentration; meanwhile, the initial pH values of the solutions were accurately recorded. In the next step, 0.15 g of SABM adsorbent was added to each of the flasks and placed on a shaker at 200 rpm for 24 hours. Finally, the SABM adsorbent was separated from the suspensions, and then the pH values of the solution (final pH) were recorded. The pHZPC was obtained by plotting the initial pH values versus the final pH values (27).
3.7. Adsorption Experiments
This study was conducted in a batch system as a factor at the time. The effect of parameters, including contact time, initial pH values of the solution, SABM adsorbent dose, initial concentration of Malathion, and temperature of the solution was investigated on the adsorption of Malathion onto the SABM adsorbent. Also, adsorption kinetics and isotherms were studied.
The experiments were carried out in the following steps. In the first stage of experiments, a 100 mL suspension, including Malathion (5.0 mg L-1) and SABM adsorbent (0.5, 1, 1, 2 and 2.5 g L-1) were spilled into the 250 mL conical flasks and initial pH values were adjusted at 3, 5, 7, 9 and 11 using NaOH and HCl solution, and then it was placed on the thermoshaker at 200 rpm and 25°C, to shake for 120 minutes. The pH was measured with a pH meter (Aqua lytic (AL15)). To investigate Malathion concentration effect, the experiments were carried out at various concentrations (5, 25, 50 and 100 mgL-1) at pH 7 and SABM adsorbent dose 2 gL-1 at 25°C. Finely, effect of temperature on the adsorption process was carried out at various temperatures of solution (25, 35 and 40°C) and pH 7, adsorbent dose 2 gL-1 and Malathion concentration 5 mgL-1. The temperature was adjusted by incubator shaker.
3.8. Analysis
At the end of each experiment, a magnet was used to remove the SABM adsorbent from the suspension, (1.3 T), and then the residual of Malathion in the solution was measured with a UV-Vis spectrophotometer (DR 6000) at λmax of 236 nm. The removal efficiency of the adsorption process was calculated using Equation 1.
Where C0 and Ct are initial and final concentrations of Malathion, respectively.
The adsorption capacity was also calculated using Equation 2.
Where C0, Ct, V, and m, are initial concentration and the final concentration of Malathion, the volume of solution (L) and the mass of adsorbent particles (g), respectively.
4. Results and Discussions
4.1. Characterization of Adsorbent
The scanning electron micrographs of SABM, sodium alginate, biosilica, and magnetic are shown in Figure 1. As shown in Figure 1D, the porosity of the SABM adsorbents is much more than other adsorbents. Such porosity level enhances the capacity and efficiency of Malathion adsorption onto SABM adsorbents. The elemental analysis of the adsorbent composition of SABM is shown in Figure 2. As can be seen, sodium, oxygen, iron, silica and aluminum presence in adsorbent structure. Moreover, the results revealed that silica can prevent the oxidation of iron nanoparticles by acid, which has been used in the process of adsorbent synthesis. These findings point out the suitable composition of the materials applied to the synthesis of SABM.
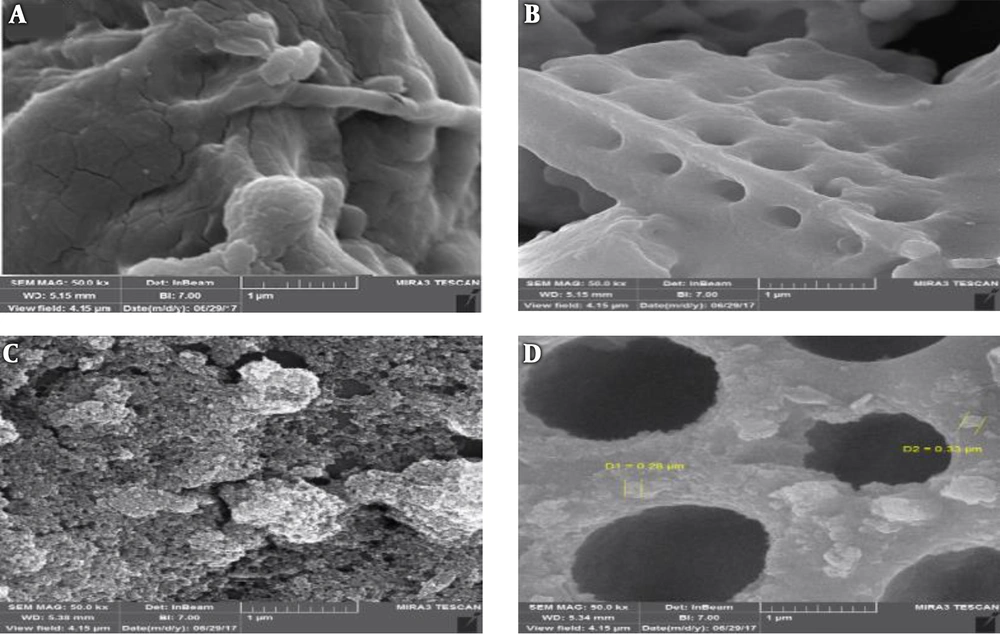
Figure 1.
SEM of adsorbent particles, A, sodium alginate, B, biosilica, C, magnetic, and D, SABM is shown
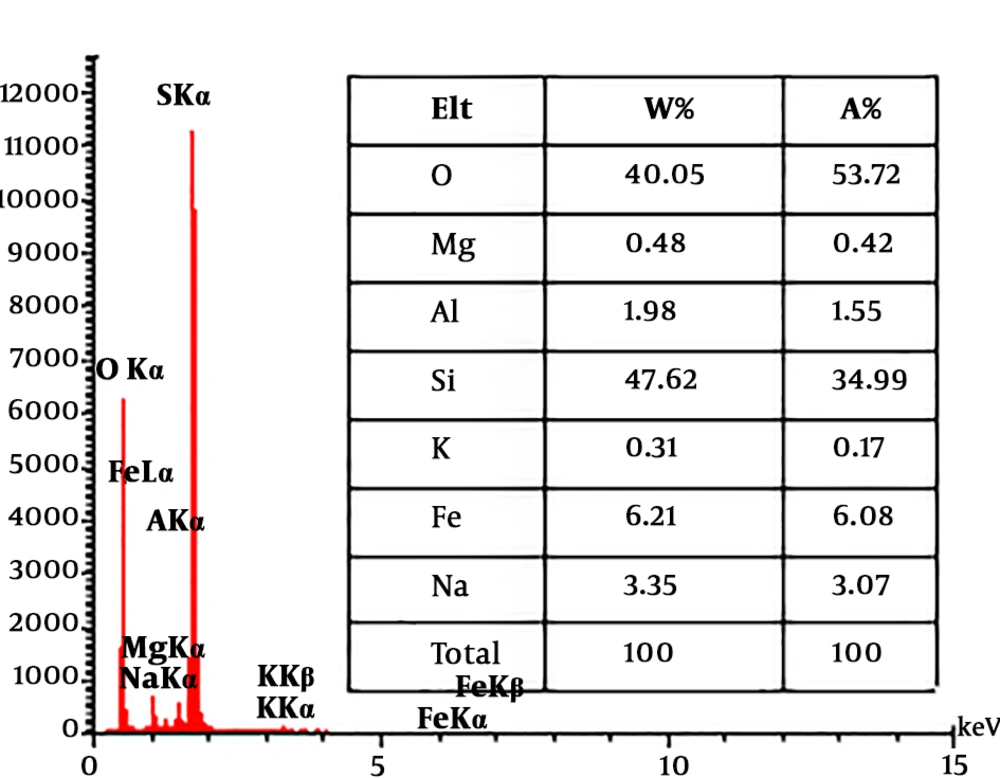
Figure 2.
EDX analytical results of SABM are shown
The XRD pattern of SABM is shown in Figure 3. In the magnetite pattern, the deflected peaks at the 2θ of 30.6, 36.04, 43.6, 54.2, 57.6, and 63.25 which are related to the crystalline plates (220, 311, 400, 422, 511, and 440) and they agree with the Fe3O4 cubic phase JCPDS (card No. 19-0629) (22). Also, there are some peaks in the SABM pattern indicating the presence of Fe3O4 in the SABM compound. As can be seen in Figure 3, the peaks obtained for the biosilica are in accordance with the pure silica phase (JCPDS ICDD File Card # 00-001-0647), and are quite obvious in the SABM pattern. Moreover, as shown in Figure 3 the intensity of the peaks in the composite SABM is reduced to the Fe3O4 and biosilica which can be related to the combination of these two substances with alginate because alginate have amorphous nature and it affects the pattern of SABM (26). FTIR spectroscopy is a powerful, well-developed method to determine the structure and identification of chemical species. It is mainly used to identify organic compounds because of the complexity of their spectra (5). The FTIR spectroscopy is a powerful, well-developed method to determine the structure and identification of chemical species. It is mainly used to identify organic compounds because of the complexity of their spectra (28). The FTIR spectrum of sodium alginate, magnetite, biosilica and SABM (before and after the adsorption of Malathion onto the SABM) is depicted in Figure 4. It’s shown that some obvious changes take place in the spectrum of SABM in comparison with the pristine sodium alginate spectrum and bare magnetite. Also, considering Figure 4, the bands 1626 and 1453 are carboxylic anions (COO-). Owing to the polysaccharide property of the alginate, the band 1093 (C-O-C asymmetric traction) is visible. The strong and broadband 3442 is related to the stretching vibration of O-H groups (18). As known (Figure 4) in the magnetite spectrum, four major peaks are considerable. The 3450 band relates to the stretching vibration of O-H groups and the other three bands (635, 582 and 474) relate to the Fe-O vibrational bands (22). Comparison between the two spectra of the SABM adsorbent (before and after the adsorption of Malathion showed that the intensity of peaks at 3422, 2924, 2366, 627, 1453, 1093, 793, 627, and 454 was reduced after the adsorption of Malathion on the SABM, which indicated the impact of these functional groups on the adsorption process and confirmed that the magnetite nanoparticles were successfully coated with sodium alginate.
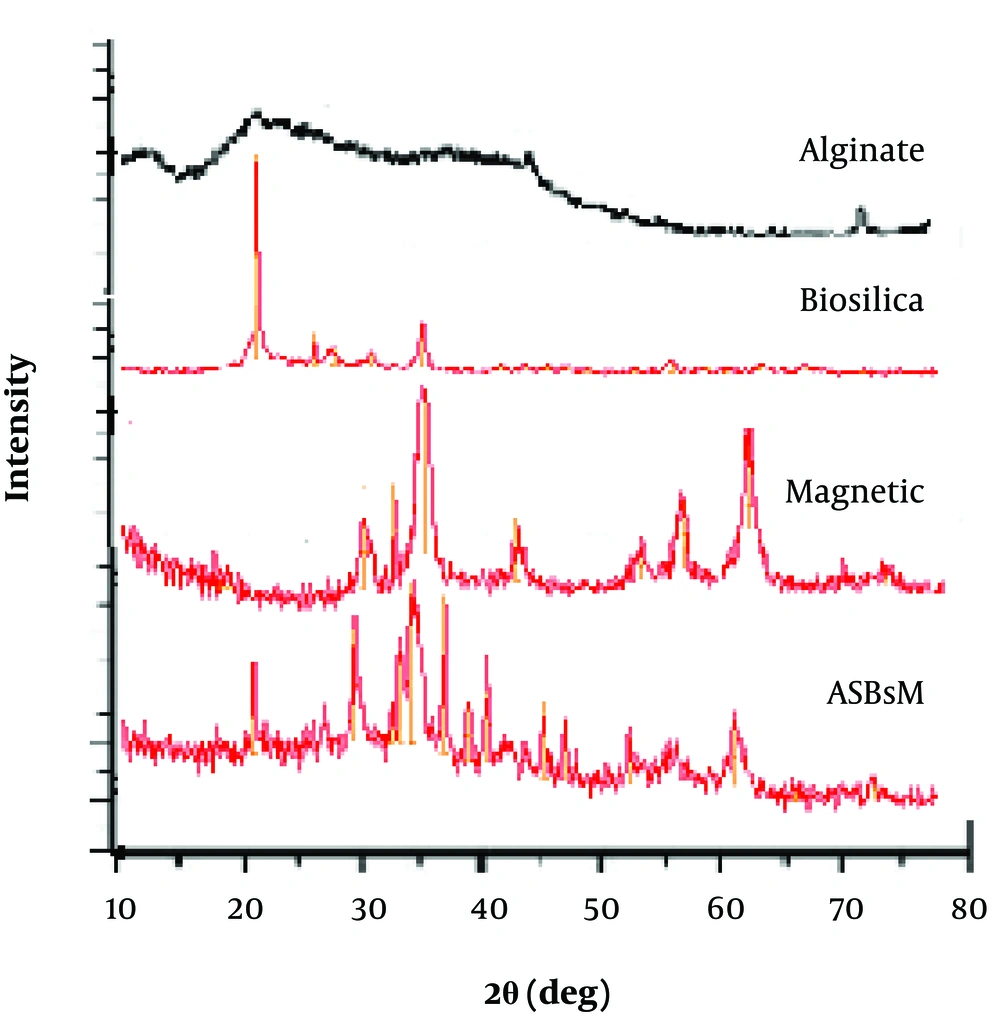
Figure 3.
XRD results of SABM are shown
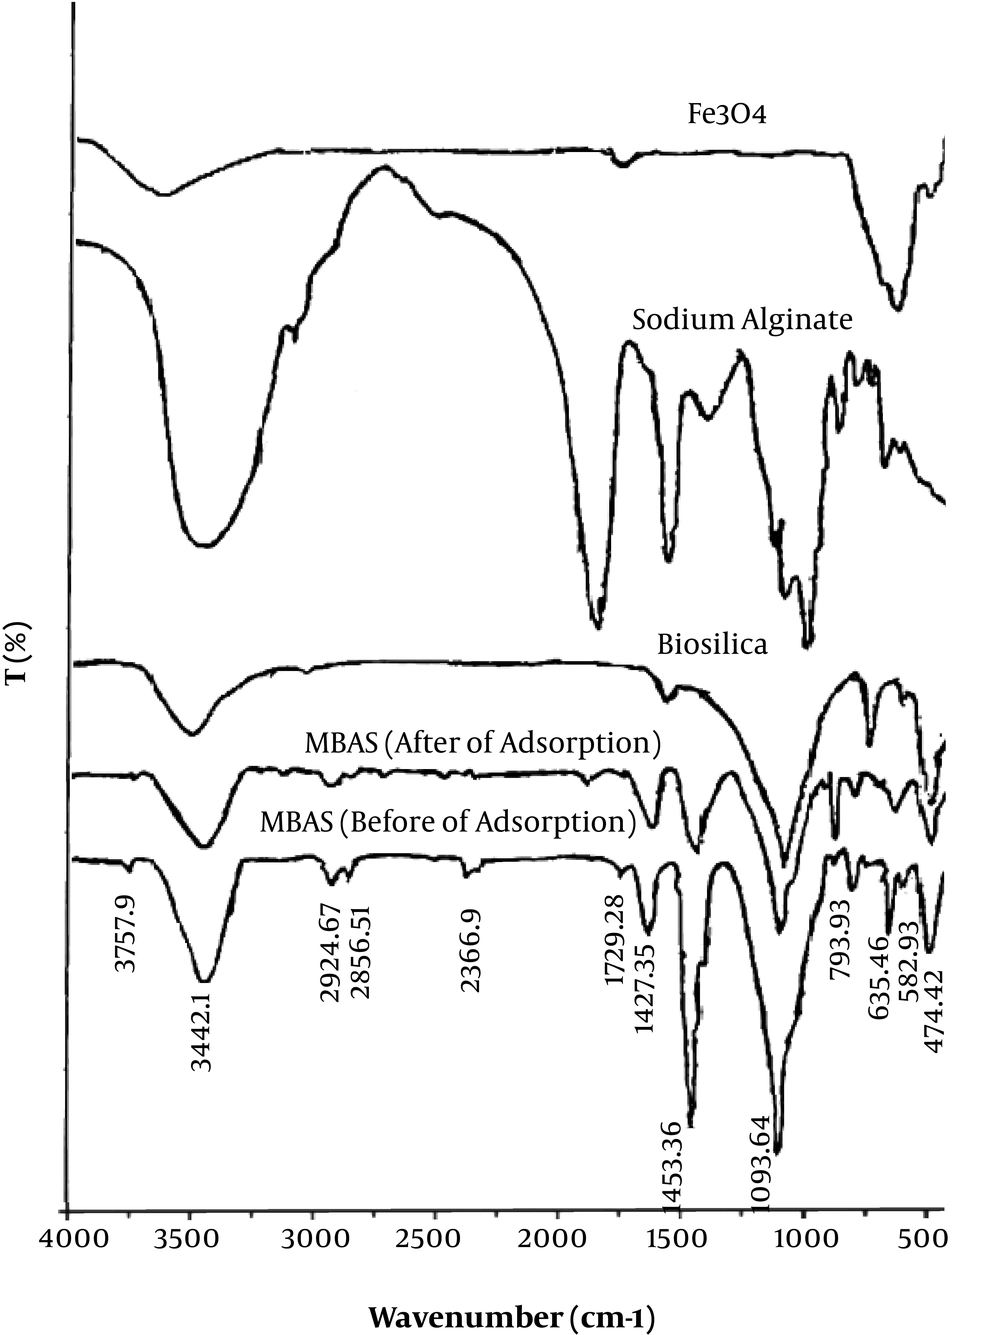
Figure 4.
FTIR spectra of sodium alginate, magnetite, biosilica, and SABM are shown
4.2. Effect of Contact Time
To investigate the adsorption behavior depended on time, the adsorption process was carried out at a determined statue for 4 hours. Figure 5 shows the result of the contact time effect on the adsorption process. As shown in Figure 5, the Malathion removal efficiency was increased immediately within 10 minutes (20.0%), then it was observed a stable pattern in the removal efficiency until 120 minutes, where the equilibrium was established and the removal efficiency was 92.1%.
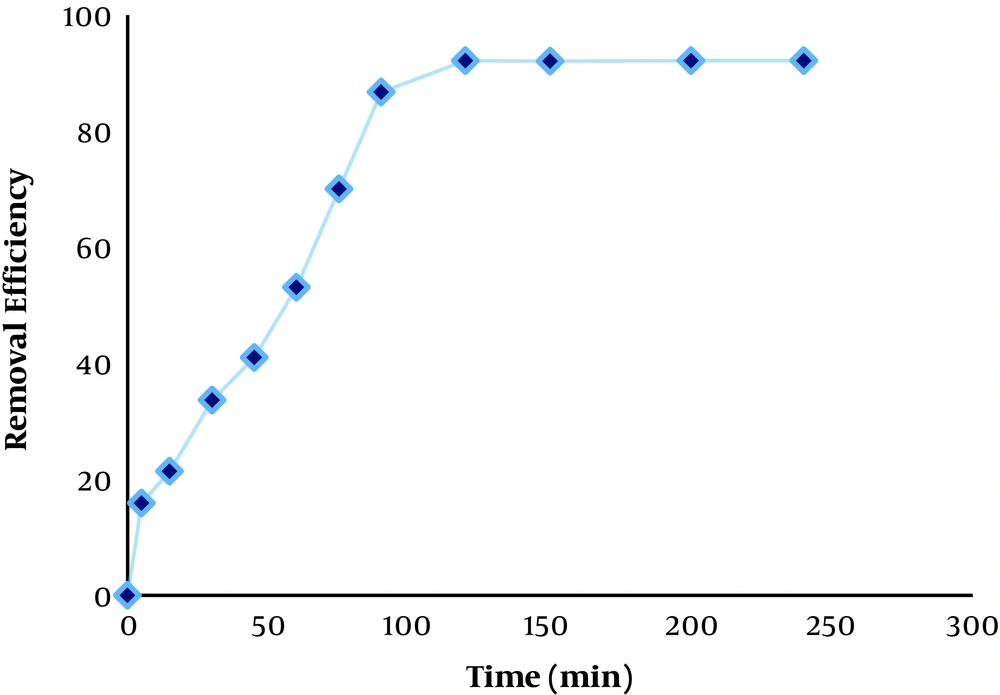
Figure 5.
Effect of contact time is shown
4.3. Effect of pH
The effect of pH values on the removal of Malathion by the SABM adsorbent is shown in Figure 6A, where pH values were (3, 5, 7, 9, and 11), adsorbent dose was 1 g L-1, concentration of Malathion was 5 mg L-1, and temperature was 25°C at contact times 120 minutes. As can be seen, the highest removal efficiency of Malathion occurred at pH 7 and the lowest removal was at pH 11 (Figure 6). With an increase of pH from 3 to 7, the removal efficiency of Malathion has increased, but the removal efficiency has decreased with increasing pH from 7 to 9 and 11, respectively. In a previous study, a similar result has been reported by Kumar et al. (29) and by Zhang et al. (30) on the removal of Malathion by using both agricultural and commercial adsorbents. Concerning the effect of pH on the adsorption process, it is believed that determining pHZPC is important in the justification of the obtained results. Based on Figure 6B, pHZPCof SABM adsorbent was in 9.6. When the pH value is higher the pHZPC, the charge of adsorbent is negative and when it is lower the pHZPC, the charge of adsorbent is positive (15). Owing to the presence of electronegative centers (S and P) on the Malathion structure, and the SABM adsorbent pHZPC (9.6) (30), the Malathion can be adsorbed onto the SABM adsorbent at the acidic and natural pH best of alkaline pH values.
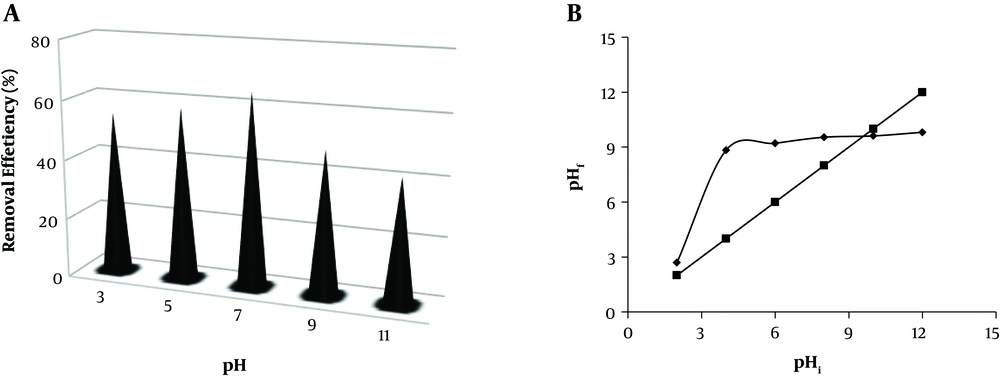
Figure 6.
Effects of pH on the removal of Malathion from the SABM (A) and pHZPC (B) are shown
4.4. Effect of the Adsorbent Dose
Effect of various doses of adsorbent (0.5, 1, 1.5, 2, and 2.5 g L-1) in the Malathion adsorption onto the SABM adsorbent was shown in Figure 7A, where pH and concentration of Malathion were 7 and 5 mg L-1 and temperature was 25°C, respectively. As can be seen in Figure 7A, an increase in the SABM dose enhanced removal efficiency where the lowest and highest removal efficiency are in the SABM dose 0.5 and 2.5 g L-1, respectively. In a past study, a similar result has been observed by (7, 29). It is obvious that with increasing mass of adsorbent, the active site to adsorb pollutant increased that led to an increase in the removal efficiency of Malathion onto the SABM adsorbent (27).
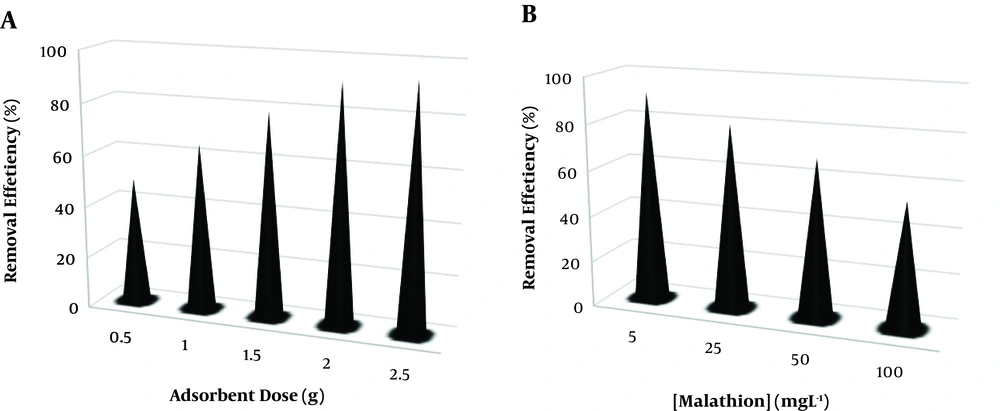
Figure 7.
Effects of absorbent dose (A) and initial concentration of Malathion (B) on the removal of Malathion from the SABM are shown
4.5. Effect of the Initial Concentration of Malathion
One of the most important and influential factors in the adsorption process is the initial concentration of pollutants. Therefore, the effect of the initial different concentrations (5, 25, 50, and 100 mgL-1) of Malathion on the removal efficiency of the adsorption process was investigated, as pH and SABM dose were 7 and 2 g L-1 and temperature was 25°C, respectively, and the results were presented as Figure 7B. As can be seen in Figure 7B, when the Malathion initial concentration increased from 5 to 100 mg L-1, removal efficiency of Malathion decreased from 92.1% to 45.5%. This result agreed with the previous study by Kumar et al. (29) by which the Malathion was adsorbed onto the both agricultural and synthetic adsorbents. This phenomenon occurred because of a constant dose of SABM in contrast to the increased concentration of Malathion that reduced removal efficiency of the adsorption process. With an increase in the Malathion concentration, the active sites and surface area of the SABM become inadequate (29).
4.6. The Effect of Temperature
The results of the temperature effects on the removal efficiency of Malathion by SABM adsorbent are shown in Figure 8A. As can be seen, an increase in the temperature led to an increase in the adsorption of Malathion Figure 8A. The highest removal efficiency of Malathion is at 45°C (85.0%) and the lowest of it is at 25°C (92.0%). Hence, it can be explained by this fact that the adsorption process was endothermic in nature. This phenomenon can occur due to an increase in the displacement from the solubility phase of the molecules and their penetration within the pores of the SABM adsorbent (31, 32).
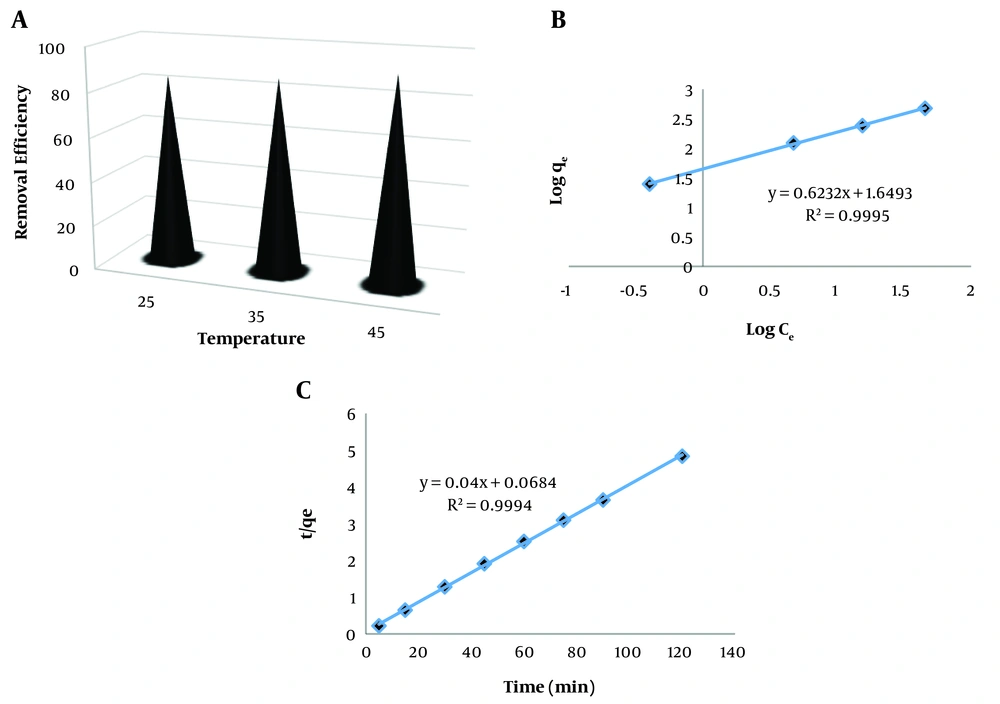
Figure 8.
Effects of temperature (A), isotherm of Longmuir (B), and pseudo-second kinetic (C) adsorption of Malathion onto the SABM are represented
4.7. Isotherm of Adsorption
To investigate the distribution of adsorbated molecules onto the adsorbent in equilibrium, the adsorption isotherm was employed. In this study, the relationship between the concentration of Malathion in solution and its adsorbed amount were determined by the Freundlich and Langmuir isotherms (15, 31).
The Langmuir isotherm model declares that the distribution of solute molecules onto the adsorbent surface has a monolayer pattern. As a solute molecule attaches to the active site placed on the adsorbent, no further adsorption can occur at that site (32, 33). The linear form of Langmuir isotherm model is expressed via Equation 3:
Separation factor (RL), which is a dimensionless parameter, is defined via Equation 4:
Where Langmuir constants (Ce, qe, qm, and Ka) are attributed to the equilibrium concentration of Malathionin solution (mg L-1), amount of adsorbed Malathion (mg g-1), maximum monolayer adsorption capacity (mg L-1) and energy of adsorption (L mg-1), respectively, are calculated from plat of Ce/qe versus Ce (15, 34). In Table 1, the results of Langmuir constants in modeling SABM adsorbent were presented calculated. With plotting Ce/qe versus Ce for Langmuir isotherm model, not provided here, it appears that this isotherm model has a poor coefficient of determination (R2 = 0.852) in fit of the adsorption process. As can be seen in Table 1, Langmuir constants qm, RL, and Ka are 36.76 (mg g-1), 0.011 and 17.24 (L mg-1), respectively. This qm for SABM adsorbent was higher than what was reported in the previous study by Darvishi Cheshmeh Soltani et al. (26) conducted in desorption of a textile dye using bio-silica/chitosan nanocomposite. Also, a study of Malathion removal by agricultural and commercial adsorbents that was carried out by Kumar et al. (29), showed a qm = 25 (mg g-1) which is lower than what reported in this study. The comparison of qm of SABM for Malathion removal with the other similar nanomaterial sorbents under similar experimental conditions is shown in Table 2. In this study, RL (dimensionless parameter) that indicates relative volatility in vapor-liquid equilibrium with a range between 0 and 1 for a favorable equilibrium (15), is at the favorable range. Therefore, it can be concluded that adsorption of Malathion onto the SABM adsorbent had a good favorable equilibrium.
Table 1.
Freundlich, Langmuir and Temkin Isotherm Parameters for the Adsorption of Malathion onto SABM Adsorbent
| Langmuir Isotherm | Freundlich Isotherm | Temkin Isotherm | |||||||
|---|---|---|---|---|---|---|---|---|---|
| R2 | Ka (L mg-1) | RL | qm (mg g-1) | R2 | n | Kf | R2 | kt (L mg-1) | b1 |
| 0.852 | 17.24 | 0.011 | 36.76 | 0.9995 | 1.6 | 44.59 | 0.7636 | 6181 | 1.895 |
Table 2.
Various Parameters of Kinetic Models for the Malathion Adsorption onto the SABM
| qe, experimental (mg/g) | Pseudo-First Order | Pseudo-Second Order | Intra-Particle Diffusion | ||||||
|---|---|---|---|---|---|---|---|---|---|
| R2 | k1 (1/min) | qe, calculated (mg/g) | R2 | k2 (g/mg. min) | qe, calculated (mg/g) | R2 | C (mg/g) | Kid (mg/g.min1/2) | |
| 24.8 | 0.788 | 0.005 | 3 | 0.9813 | 0.023 | 25 | 0.85 | 9.65 | 0.22 |
Freundlich isotherm model was used to determine the multilayer adsorption of adsorbate on the adsorbent surface. It also assumes that adsorption occurs on heterogeneous surfaces and can be expressed via Equation 5. (27).
Where Freundlich isotherm constants (Kf and n) are the extent of adsorption (mg g-1) and adsorption intensity of system calculated from plot of log qe versus log Ce. Figure 7B shows Freundlich isotherm model for the adsorption of Malathion onto the SABM adsorbent, where coefficient of determination (R2 = 0.9959) states that the adsorption process has good fit by Freundlich isotherm. Constants of Freundlich isotherm (Kf and n) prepared in Table 1 were 44.59 and 1.6, respectively. High amount of Kf constant represents very large extent of adsorption of Malathion onto the SABM adsorbent. Also, the value of n is larger than 1, indicating a favorable adsorption system and a multilayer physical process in the adsorption of Malathion by SABM adsorbent (35).
The Temkin model is employed to investigate the heat of the adsorption (adsorption energy) and adsorbent-adsorbate interactions. This isotherm assumes that the decrease of the adsorption energy of all the molecules in a layer linearly with the monolayer sorption on the active sites as a result of adsorbent-adsorbate interactions. The linear form of the Temkin model is given as follows (28, 36):
Where, B1, B1 = RT/b1, denotes the Temkin constant (J/mol). R is the universal gas constant and equal to 8.314 J/mol.K. T is the absolute temperature (°K). kt and b1 represent the equilibrium binding constant (L/g) and adsorption heat (kJ/mol), respectively. Based on the data obtained, the magnitude of b1 value showed the fast removal of Malathion at the initial stage and the smallness of kt value implied the weak bonding of Malathion molecules onto the composite.
4.8. Kinetic of Adsorption
To study the mechanism of Malathion adsorption onto the SABM adsorbent, the transient behavior of the Malathion adsorption process was investigated using the pseudo-first-order and pseudo-second-order kinetics which are explained as follows.
The pseudo-first-order kinetic. Linear equation of pseudo-first order kinetic is shown in Equation 6 (37).
Where qe, qt, and k1 refers to the amount of adsorbed Malathion at equilibrium (mg g-1), the amount of adsorbed Malathion at time (t), and the equilibrium rate constant (min-1) of pseudo-first-order kinetic, respectively. The k1 is taken out from plotting Log (qe - qt) versus (t), where pseudo-first-order kinetic fitting for SABM adsorbent had a very poor coefficient of determination (R2 = 0.7884) (not shown). Calculated pseudo-first-order kinetic constants were provided in Table 3. As shown in Table 3, the equilibrium adsorption capacity qe (Cal) value was lower than the experimental qe (Exp) value, which indicated the inapplicability of this model.
The pseudo-second-order equation. Linear form of pseudo-second-order kinetic is given in Equation 7 (27).
By which, rate constant (k2) and adsorption capacity in equilibrium (qe) were calculated by plotting (t/qt) versus (t) (Figure 7C). The initial adsorption rate (h) was calculated at zero time, by Equation 8.
Additionally, the intraparticle diffusion model is conveniently employed to recognize the diffusion mechanism. The model can be epitomized as follows (38, 39):
Where, kid (mg/g) is related to the intraparticle diffusion rate constant. C is the intercept and represents the thickness of the boundary layer (mg/g) in which the effect of this layer depends on the value of the intercept.
As shown in Figure 7C, the pseudo-second-order kinetic fitting for adsorption of Malathion onto the SABM adsorbent have a good coefficient of determination (R2 = 0.9994). A similar behavior has been observed by Naushad et al. (31) on the removal of Malathion using amberlyst-15 resin. All the parameters of this kinetic model were prepared in Table 3. According to Table 3, the equilibrium adsorption capacity qe (Cal) value (25 mg g-1) was close to the experimental qe (Exp) value (24.8 mg g-1), which indicated the applicability of this kinetic model for the adsorption process behavior. Also, RL is 14.37 (min-1 mg g-1), which indicates the high initial adsorption rate. Based on the intra-particle diffusion model, the high values of C parameter (9.65) indicated that the boundary layer effect was also responsible for the adsorption. The multi-linearity of q versus t0.5 plot, and/or deviation of the plots from the origin further confirms that the adsorption process is complex and some other mechanisms along with intraparticle diffusion control the process steps, as reported previously by Jerold et al. (40).
Table 3.
Adsorption Capacities of Various Adsorbents for the Uptake of Malathion
| Adsorbent | qm (mg/g) | Refs. |
|---|---|---|
| Montmorillonite | 7.95 | (35) |
| Amberlyst-15 cation exchange resin | 12.12 | (31) |
| powdered activated carbon | 21.74 | (29) |
| De-Acidite FF-IP resin | 16.39 | (32) |
| SABM nanocomposite | 36.86 | This work |
Abbreviation: SABM, sodium alginate/biosilicate/magnetite.
4.9. Thermodynamic Studies
The thermodynamic study was performed to reach a better understanding of the adsorptive behavior of Malathion toward nanocomposite. The free energy change (ΔG0) (kJ mol-1), enthalpy change (ΔH0) (kJ mol-1), and entropy change (ΔS0) (kJ mol-1 K-1) for the adsorption of Malathion were calculated by Equations 9 (26).
The thermodynamic parameters of Malathion adsorption on MBAS are listed in Table 4. As represented in Table 4, the values of ΔH and ΔS are positive, and the standard free energy (ΔG) is negative. The positive ΔH value indicates that the sorption process was endothermic. In other words, the positivity of this parameter states that the increase in temperature has a positive effect on the adsorption of Malathion and, the adsorption of this pollutant at higher temperatures is more favorable. Furthermore, the negative values obtained for Gibbs free energy indicate that the adsorption of Malathion by the synthesized adsorbent is a spontaneous process (31).
Table 4.
Thermodynamic Parameters for the Adsorption of Malathion on MBAS
| Temperature (K) | Ln KD | ∆G0 (kJ/mol) | ∆H0 (kJ/mol) | ∆S0 (kJ/mol.K) |
|---|---|---|---|---|
| 298 | 1.81 | -2.80 | 602.60 | 0.1 |
| 308 | 2.05 | -4.05 | ||
| 318 | 3.19 | -5.78 |
4.10. The Mechanisms of the Adsorption
The mechanism of the adsorption of organic pollutants onto inorganic materials usually are a combination of electrostatic interaction, ion exchange, π-π electron donor-acceptor (EDA) interaction, and hydrophobic surface interaction and so on.
The hydrophobic interaction is an important mechanism involved in the sorption of Malathion onto MBSA. Malathion is partially insoluble organics in water. As the pH increases, the Malathion molecules gain less water solubility and higher hydrophobicity; these results lead to a higher adsorption efficiency at pH 7. Therefore, the hydrophobic surface interactions should be a dominant mechanism in the adsorption process. In addition, electrostatic interaction can be a major mechanism governing adsorption of Malathion onto the MBSA (between the oppositely charged groups of adsorbate and adsorbent). Also, the acid-base interactions may be another significant factor involved in controlling Malathion adsorption.
4.11. Conclusions
To summarize, the characteristic analyses for the SABM adsorbent approved that the SABM adsorbent has high potential to adsorb the Malathion. Also, parameters, including pH, contact time, SABM dosage, Malathion concentration, and temperature influence the adsorption process. Owing to the high performance of this process at pH = 7, it expected the SABM adsorbent could be applicable to remove Malathion from real wastewater with natural pH value. Also, in determining isotherms of the Malathion adsorption, it was cleared the Freundlich isotherm model is better to describe this adsorption process, which is indicating multi-layer physical adsorption. Maximum monolayer adsorption capacity (qm = 36.76 mg g-1) for SABM fungi particles can be illuminated by the SEM picture where there are numerous pores over the biosorbent surface. Moreover, the kinetic studies showed that the Malathion adsorption process followed the pseudo-second-order kinetic model. In general, the SABM adsorbent can be favorable for the removal of Malathion from aqueous solution.