1. Background
NAFLD encompasses a spectrum of conditions of increasing severity, including non-alcoholic fatty liver (NAFL), non-alcoholic steatohepatitis, and fibrosis and cirrhosis (1). It is one of the most important causes of liver disease in the world and could be the main cause of terminal liver disease in the next few decades (2). The worldwide prevalence of NAFLD has been estimated to be 6 - 35% (median 20%), geographically discriminated as follows: 33% in Europe, 29.6% in Asia, 26.6 - 36.2% in South America, 14% in Africa and 32% in the Middle East, and it is on the rise (3-5). As the incidence of NAFLD increases, it imposes a heavy economic burden on individuals, families, communities and countries. Furthermore, there is growing evidence that NAFLD is a multisystemic disease associated with other chronic conditions (1).
Since NAFLD is reversible, it is critical to be able to identify this condition in its early stages before it produces symptoms. Diagnostic methods for NAFLD include liver biopsy, serum markers, sonography, transient elastography, computerized tomography scans, and magnetic resonance imaging (MRI) (6). A liver biopsy is the gold standard for diagnosing NAFLD, but it is impractical, since it is costly, invasive and risky. The most commonly used methods to screen for NAFLD are sonography and MRI (7). However, the availability and cost of MRI are key hurdles limiting its applicability, especially in the general population (8). Although sonography is not as accurate as MRI and the liver biopsy for diagnosing liver steatosis and determining its severity, it is the most widely used examination method due to its proven diagnostic ability (6) and low cost. Sonography, however, is not the preferred method for early screening because specialized equipment and skilled technicians are needed. Therefore, more simple, accurate, reproducible and inexpensive screening tools for the early detection of NAFLD are needed (9).
A strong association between obesity and NAFLD has been widely recognized (10, 11). If obesity continues to increase at historical rates, it is predicted that the total number of NAFLD cases will increase between 2016 and 2030 (0 - 30%), and the highest increases will be seen in China. In addition, advanced liver disease and mortality due to liver disease will more than double (4). As is well known, the BMI and WHtR are commonly used indices to define obesity and central adiposity. Studies have shown that BMI and WHtR directly correlate with the prevalence of NAFLD (10, 12). Although the BMI is recommended by the World Health Organization and is the most commonly used diagnostic tool for characterizing generalized overweight and obesity (13), it cannot differentiate between fat and lean mass, since the BMI is a weight-for-height index, and an elevated BMI does not always predict health-related events (14, 15). Compared with BMI, the WHtR offers some advantages, since it takes into account central obesity, and does not require standardized gender or population cut-off values or percentiles (16).
Recently, a new obesity classification method combining both BMI and WHtR has been suggested (17). Previous studies have shown that this type of composite index is significantly more accurate for determining cardiometabolic risk, hypertension and type 2 diabetes in overweight or obese individuals than individual indices (18-20). However, there are no studies examining the association of BMI and WHtR with NAFLD in adults and no reports determining whether the composite BMI and WHtR index is better at identifying individuals at risk of NAFLD. Therefore, we wanted to ask: if we analyze the risks for NAFLD in a similar way, are two indices better than one?
2. Objectives
The goal is to evaluate the risk factors for NAFLD and to determine whether the BMI and WHtR in combination can identify subjects at risk of NAFLD more accurately than BMI or WHtR alone.
3. Methods
3.1. Sample
Our study was approved by the Ethics Committee of the Second Affiliated Hospital of Dalian Medical University (Version number: 036; Version date: January 01, 2017). The study was conducted in accordance with the Declaration of Helsinki. Prior informed consent was required from all subjects (or their legal guardians).
The study population included randomly selected individuals who underwent health examinations at the Second Affiliated Hospital of Dalian Medical University in 2017. The exclusion criteria were: "(1) < 18 years old; (2) incomplete health survey, anthropometric or laboratory data; (3) hepatitis B or C; (4) autoimmune liver disease; (5) drug-induced liver disease; (6) excessive drinking [> 7 standard alcoholic drinks/week (70 g ethanol) in women or > 14 (140 g) in men]; or (7) metabolic liver disorders, among others (8)". A total of 1,276 participants were enrolled (Figure 1).
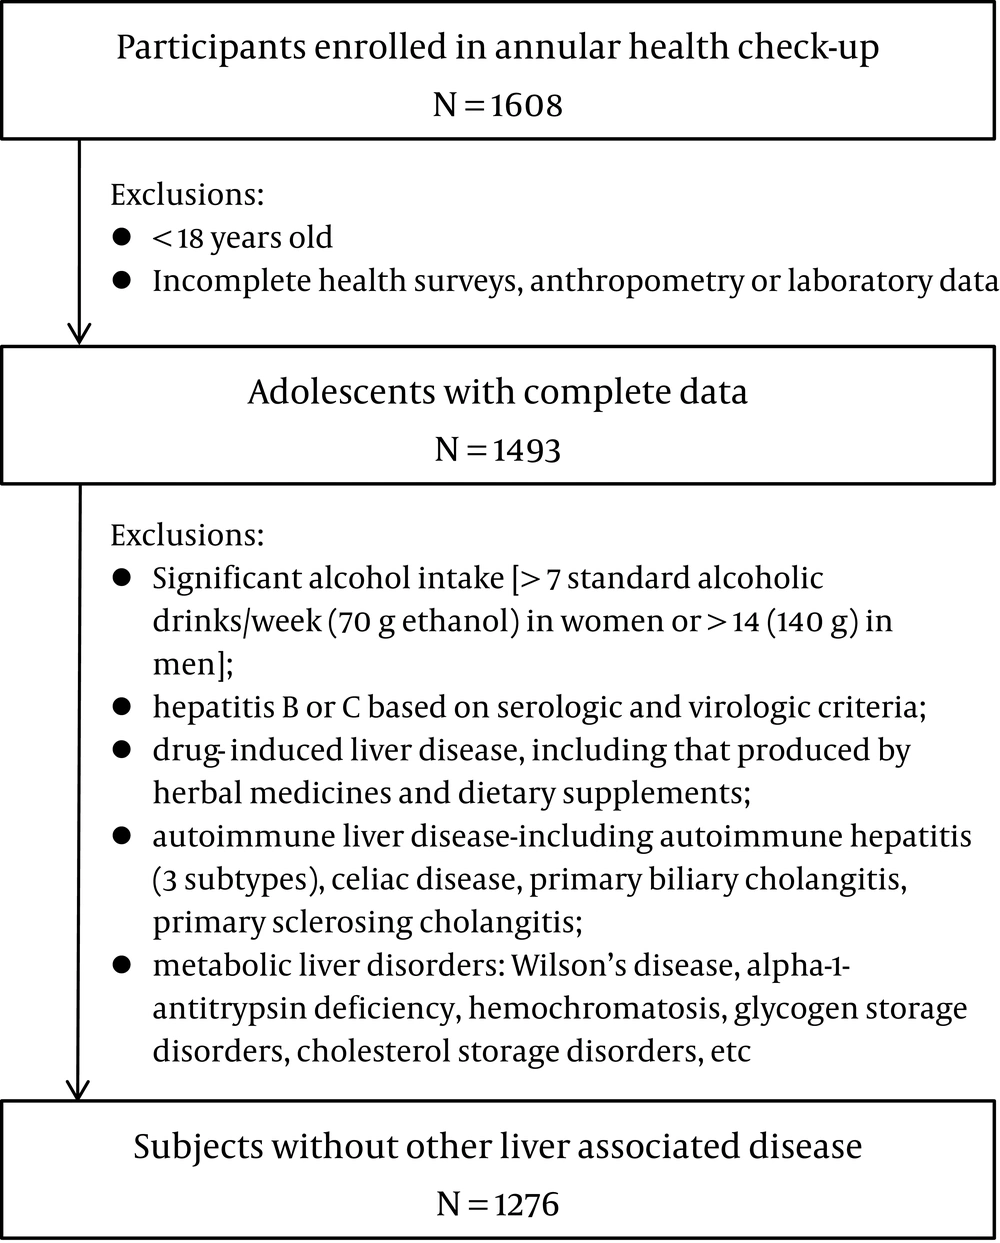
Figure 1.
Study flow chart.
3.2. Anthropometric Assessment
Physical examinations were performed in the morning. Blood pressure was measured with an Omron HEM-906 wrist blood pressure monitor. The blood pressure of each participant was measured twice and recorded. It was measured a third time if the difference between the first and second blood pressure values was > 10 mmHg, and the mean value was taken as the final blood pressure. Height, weight, and WC were measured with subject barefoot and wearing light clothes. The WC was measured halfway between the edge of the lowest rib and the iliac crest. The body mass index (BMI) was calculated using the standard formula (weight in kilograms divided by the square of the height in meters). The waist-height ratio (WHtR) was calculated using the standard formula (waist circumference in centimeters divided by the height in centimeters).
3.3. Laboratory Assays
After overnight fasting, venous blood samples were collected from all participants and delivered to the laboratory on the same day. White blood cell (WBC) counts, RBC, absolute neutrophil counts (NEUT#), absolute lymphocyte counts (LYMPH#), HGB, platelet counts (PLT), total protein (TP), albumin (Alb), globulin (Glob), ALT, AST and GGT, total bilirubin (STB), direct bilirubin (DB), urea, creatinine (Cr), SUA, FBG, cholesterol (TC), TG, high-density lipoprotein cholesterol (HDL-C) and low-density lipoprotein cholesterol (LDL-C) levels were measured with an automatic analyzer (Hitachi Inc., Japan), according to standard methods.
3.4. Definition and Classification
Hypertension was diagnosed if the patient was being treated with antihypertensive drugs, or if the systolic or diastolic blood pressure values were ≥ 140 mmHg or ≥ 90 mmHg, respectively. Diabetes mellitus was diagnosed if the participant had a FBG level ≥ 7.0 mmol/L or was being treated with antidiabetic medications or insulin.
Based on the BMI or WHtR percentiles, subjects were divided into normal weight (< 33.33 %), overweight (33.33 – 66.66 %) or obese (> 66.66 %). In our sample, the cut-off values corresponded to BMI < 22.68, 22.68 - 25.14 and > 25.14, respectively; and WHtR < 0.47, 0.47 - 0.51 and > 0.51, respectively. The BMI and WHtR measurements were combined to establish the following classification (Figure 2).
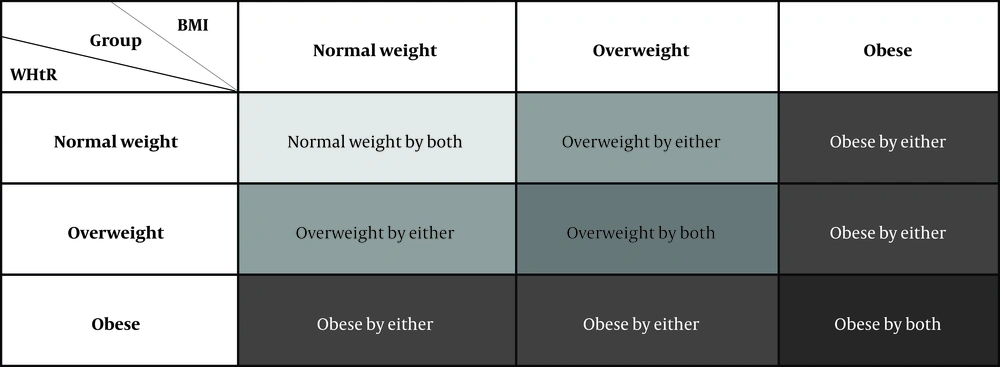
Figure 2.
The entire cohort was divided into five new groups (shown with different shades of gray) based on the BMI or WHtR tertiles.
3.5. Ultrasonography
Normal liver (9): Its echotexture was homogeneous, without acoustic attenuation. The portal veins were visible. The diaphragm was well visualized, and its echogenicity was similar or slightly higher to that of the renal parenchyma.
Diagnostic criteria for fatty liver: The left and right lobes of the liver showed diffuse, dense and small dot-like echoes, and the echo intensity was higher than that of the spleen or kidney. Liver echogenicity was not uniform; instead, it increased in the frontal part, but gradually decreased in the distal part of the organ. The permeability of the entire liver was decreased; there were less blood vessels, unclear texture, and weakened echoes in the branches of the hepatic and portal veins.
3.6. Statistical Analyses
The software tool for data analysis was SPSS v20.0 (IBM, Inc., Armonk, New York, USA). The one-sample Kolmogorov-Smirnov test was used to verify the normality of the data. We described the frequencies of categorical variables and normal data (PROC CROSSTAB, PROC DESCRIPT) using the mean ± standard error (SE), and of abnormally distributed data using the median (interquartile range). Numbers (percent) were used to describe categorical variables. Two groups of continuous variables were analyzed with the Student's t test. The χ2 test was used to analyze categorical data. Independent predictors were determined by 95% CIs and multivariate logistic regression analysis (using odds ratios [18] and 95% CIs). The receiver operating characteristic (ROC) curve was plotted for NAFLD: the y-axis represents the sensitivity, and the x-axis represents the false positive rate (1-specificity). All tests were two-sided and P < 0.05 was considered statistically significant.
4. Results
4.1. NAFLD in the Examined Population
The 1,276 participants were examined with ultrasound and 360 (28.21%) were diagnosed with NAFLD. Compared with participants without NAFLD (Table 1), subjects with NAFLD tended to be males and suffer from hypertension, diabetes, gallbladder polyps or thyroid nodules. NAFLD group members were significantly older and showed higher SBP, DBP, height, WC, weight, BMI, WHtR, WBC, RBC, NEUT#, LYMPH#, HGB, ALT, AST, TP, Alb, GGT, urea, Cr, SUA, FBG, TC, TG and LDL-C values, but lower HDL-C than those in the non-NAFLD group. In contrast, the overall prevalence of gallstones, and the levels of PLT, Glob, STB and DB did not differ significantly between the two groups.
Table 1.
Characteristics of Participants with and without NAFLD
| Variables | Normal Values | Non-NAFLD, (N = 916) | NAFLD, (N = 360) | P-Value |
|---|---|---|---|---|
| Males, n (%) a | 385 (42.0) | 280 (77.8) | < 0.001 | |
| Hypertension, n (%) a | 115 (12.6) | 102 (28.3) | < 0.001 | |
| Thyroid nodule, n (%) a | 360 (39.3) | 165 (45.8) | 0.033 | |
| Gallstone, n (%) a | 34 (3.7) | 21 (5.8) | 0.093 | |
| Gallbladder polyps, n (%) a | 93 (10.2) | 57 (15.8) | 0.005 | |
| Diabetes, n (%) a | 23 (2.5) | 48 (13.3) | < 0.001 | |
| Age (y) b | 41.3 (33.0, 48.0) | 44.8 (39.0, 52.0) | < 0.001 | |
| SBP (mmHg) c | 90.0 - 140.0 | 122.7 ± 14.1 | 131.1 ± 15.8 | < 0.001 |
| DBP (mmHg) c | 60.0 - 90.0 | 74.6 ± 10.6 | 81.8 ± 11.2 | < 0.001 |
| Height (cm) c | 168.4 ± 7.6 | 171.7 ± 7.3 | < 0.001 | |
| WC (cm) c | 80.4 ± 9.0 | 91.5 ± 7.8 | < 0.001 | |
| Weight (kg) c | 65.6 ± 11.0 | 79.2 ± 10.9 | < 0.001 | |
| BMI (kg/m2) c | 18.5 - 23.9 | 23.0 ± 2.8 | 26.8 ± 2.8 | < 0.001 |
| WHtRc | 0.5 ± 0.0 | 0.5 ± 0.0 | < 0.001 | |
| WBC (× 109/L) c | 3.5 - 9.5 | 5.8 ± 1.4 | 6.8 ± 1.7 | < 0.001 |
| RBC (× 1012/L) b | 4.3 - 5.8 | 4.8 (4.5, 5.1) | 5.1 (4.9, 5.4) | < 0.001 |
| NEUT# (× 109/L) c | 1.8 - 6.3 | 3.4 ± 1.1 | 3.9 ± 1.3 | < 0.001 |
| LYMPH# (× 109/L) c | 1.1 - 3.2 | 2.0 ± 0.5 | 2.3 ± 0.6 | < 0.001 |
| HGB (g/L) b | 130.0 - 175.0 | 141.0 (131.0, 154.0) | 153.5 (147.0, 163.0) | < 0.001 |
| PLT (× 109/L) b | 125.0 - 350.0 | 241.9 (206.0, 273.8) | 239.1 (203.0, 267.5) | 0.251 |
| ALT (mmol/L) b | 9.0 - 50.0 | 19.3 (12.0, 23.0) | 34.8 (22.0, 41.0) | < 0.001 |
| AST (mmol/L) b | 15.0 - 40.0 | 19.9 (16.0, 22.0) | 24.6 (19.0, 27.0) | < 0.001 |
| TP (g/L) c | 65.0 - 85.0 | 75.6 ± 3.8 | 76.3 ± 3.7 | 0.008 |
| Alb (g/L) c | 40.0 - 55.0 | 46.8 ± 2.5 | 47.5 ± 2.5 | < 0.001 |
| Glob (g/L) c | 20.0 - 40.0 | 28.8 ± 3.4 | 28.8 ± 3.2 | 0.880 |
| GGT (mmol/L) b | 10.0 - 60.0 | 19.3 (11.0, 22.0) | 36.5 (20.0, 41.8) | < 0.001 |
| STB (μmol/L) c | 0.0 - 26.0 | 14.7 ± 6.1 | 14.9 ± 5.7 | 0.617 |
| DB (μmol/L) c | 0.0 - 8.0 | 5.2 ± 2.2 | 5.0 ± 1.9 | 0.214 |
| Urea (mmol/L) c | 3.6 - 9.5 | 4.6 ± 1.3 | 4.9 ± 1.1 | < 0.001 |
| Cr (μmol/L) c | 57.0 - 111.0 | 64.5 ± 17.2 | 71.6 ± 13.3 | < 0.001 |
| SUA (μmol/L) b | 208.0 - 428.0 | 306.4 (246.3, 356.1) | 383.0 (326.2, 437.5) | < 0.001 |
| FBG (mmol/L) b | 3.9 - 6.1 | 5.5 (5.1, 5.7) | 6.3 (5.4, 6.3) | < 0.001 |
| TC (mmol/L) c | 2.9 - 5.17 | 4.7 ± 0.9 | 5.0 ± 0.9 | < 0.001 |
| TG (mmol/L) b | 0.22 - 1.7 | 1.2 (0.8, 1.4) | 2.1 (1.3, 2.5) | < 0.001 |
| HDL - C (mmol/L) c | 0.9 - 2.19 | 1.4 ± 0.3 | 1.2 ± 0.2 | < 0.001 |
| LDL - C (mmol/L) c | 0.0 - 3.36 | 2.5 ± 0.7 | 2.7 ± 0.6 | < 0.001 |
Abbreviations: WC, waistline circumference; BMI, body mass index; WHtR, waist-to-height ratio; WBC, white blood cell; RBC, red blood cell; NEUT#, absolute neutrophil counts ; LYMPH#, absolute lymphocyte counts; HGB, hemoglobin levels; PLT, platelet counts; ALT, alanine aminotransferase; AST, aspartate aminotransferase; TP, total protein; Alb, albumin; Glob, globulin; STB, total bilirubin; DB, direct bilirubin; GGT, γ-glutamyl transpeptidase; SUA, serum uric acid; FBG, fasting blood glucose; TG: triglycerides; Cr, creatinine; SUA, serum uric acid; TC, cholesterol; TG, triglycerides; HDL-C, high-density lipoprotein cholesterol; LDL-C, low-density lipoprotein cholesterol.
a x2 test
b Mann Whitney U test
c t - test
A ROC curve analysis of the continuous variables associated with NAFLD is shown in Figure 3. Based on the area under the ROC curve (AUC > 0.7), the order of the variables sorted from highest to lowest were: BMI, WC, WHtR, ALT, weight, TG, GGT, SUA, RBC, HGB, FBG and AST. This suggests that these variables are closely associated with NAFLD, i.e., they are high risk factors for NAFLD. In contrast, WBC, Cr, LYMPH#, NEUT#, height, age, urea, LDL-C, Alb, TC and TP were weak predictors of NAFLD, and HDL-C levels showed an inverse relationship.
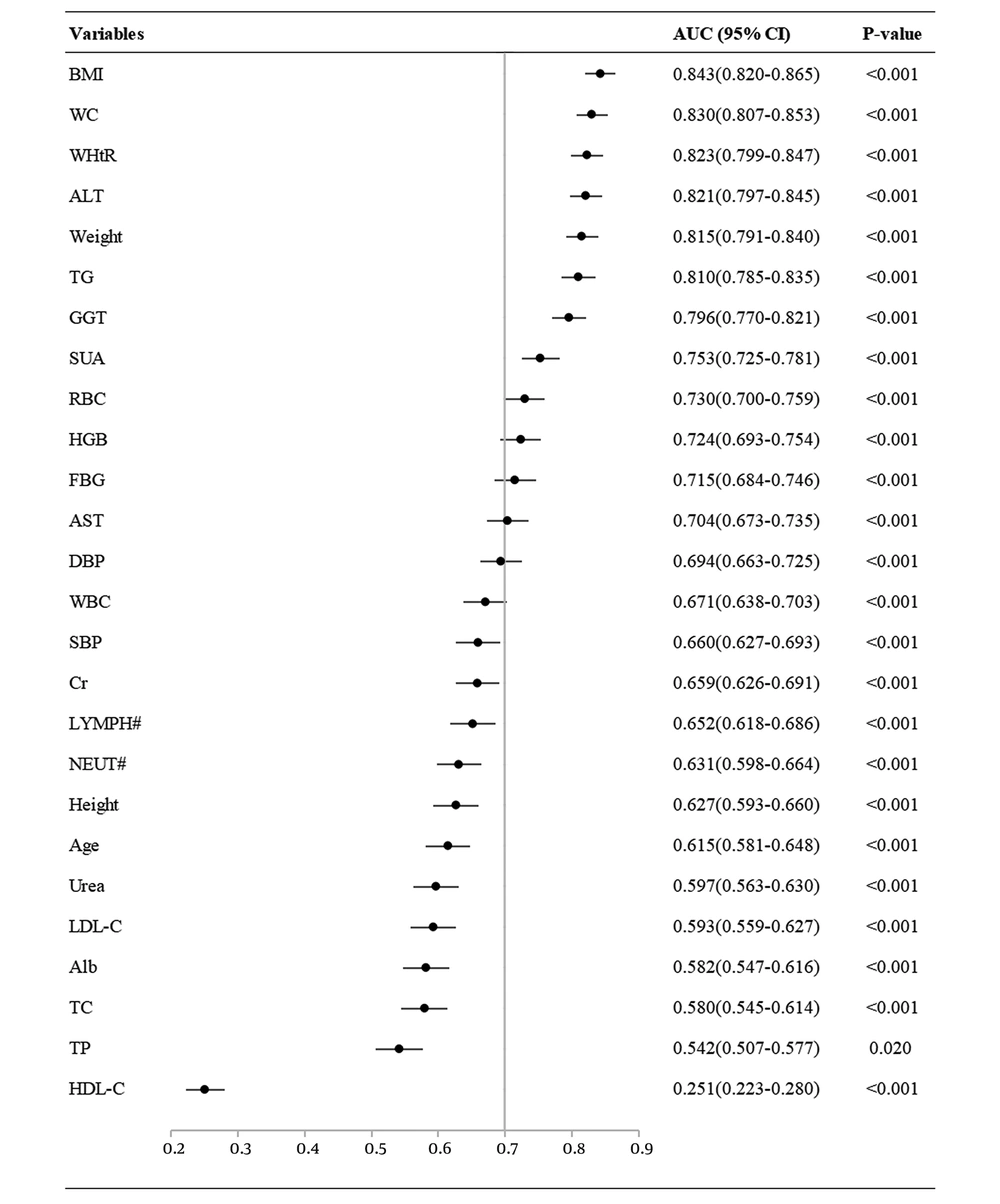
Figure 3.
Area under the ROC curve analysis (95 % CI) of continuous variables associated with NAFLD.
4.2. Risk Assessment Based on BMI and WHtR
Binary logistic regression analysis showed that both BMI and WHtR were significantly correlated with NAFLD after adjusting for factors such as age, WC, urea, SUA, ALT, AST, GGT, FBG, TC and TG levels (Table 2). The analysis demonstrated that both BMI and WHtR were independent risk factors for NAFLD.
Table 2.
Odds Ratio (95 % CI) for Risk Factors Based on the BMI and Whtr, Using Different Models
| Model | WHtR | BMI | ||||
|---|---|---|---|---|---|---|
| OR | 95% CI | P - value | OR | 95% CI | P - value | |
| Model 1 a | 4.060E - 11 | 1.224E - 10~1.347E - 13 | < 0.001 | 1.595 | 1.504~1.692 | < 0.001 |
| Model 2 b | 1.927E - 3 | 1.466~2.534E - 6 | 0.039 | 1.355 | 1.251~1.469 | < 0.001 |
| Model 3 c | 2.453E - 5 | 1.208E - 2~4.980E - 8 | 0.001 | 1.343 | 1.237~1.457 | < 0.001 |
| Model 4 d | 3.738E - 4 | 12.669~1.103E - 8 | 0.010 | 1.314 | 1.206~1.433 | < 0.001 |
| Model 5 e | 2.231E - 4 | 5.349~9.310E - 7 | 0.019 | 1.308 | 1.197~1.429 | < 0.001 |
Abbreviations: SD, standard deviation; OR, odds ratio; CI. confidence interval
aModel 1. Input: WHtR or BMI
bModel 2. Input: age, WC based on Model 1
cModel 3. Input: urea, SUA based on Model 2
dModel 4. Input: ALT, AST, GGT based on Model 3
eModel 5. Input: FBG, TC, TG based on Model 4
The characteristics of the entire cohort, based on the BMI and WHtR tertiles, are summarized in Table 3. Significant differences were more consistently and better identified in the overweight and obese groups by combining the BMI and WHtR, as opposed to relying on one index alone. Subjects classified as overweight or obese based on both indices had higher WC, weight, BMI, WHtR, RBC, HGB, ALT, AST, GGT, SUA, FBG and TG levels. In contrast, hypertension, thyroid nodules and gallbladder polyps showed no significant differences between the composite index and the single indices.
Table 3.
Comparation of NAFLD Risk Factors Based on the Classification of Normal Weight, Overweight or Obese, Defined by either BMI, WHtR or Both
| Variables | Normal Weight by Both, (N = 328) | Overweight by Either, (N = 163) | Overweight by Both, (N = 269) | P - Valuea | Obese by Either, (N = 185) | Obese by Both, (N = 331) | P - Valueb |
|---|---|---|---|---|---|---|---|
| Males, n (%) | 59 (18.0) | 73 (44.8) | 151 (56.1) | 0.022 | 124 (67.0) | 258 (77.9) | 0.007 |
| Hypertension, n (%) | 15 (4.6) | 23 (14.1) | 38 (14.1) | 0.996 | 45 (24.3) | 96 (29.0) | 0.253 |
| Thyroid nodule, n (%) | 105 (32.0) | 67 (41.1) | 118 (43.9) | 0.574 | 89 (48.1) | 146 (44.1) | 0.382 |
| Gallbladder polyps, n (%) | 23 (7.0) | 22 (13.5) | 26 (9.7) | 0.219 | 24 (13.0) | 55 (16.6) | 0.270 |
| Diabetes, n (%) | 3 (0.9) | 2 (1.2) | 16 (5.9) | 0.017 | 12 (6.5) | 38 (11.5) | 0.066 |
| WC (cm) | 4.6 ± 0.4 | 79.3 ± 4.7 | 83.9 ± 3.8 | < 0.001 | 87.2 ± 6.2 | 94.8 ± 6.2 | < 0.001 |
| Weight (kg) | 4.6 (4.4,4.8) | 64.2 ± 7.5 | 69.8 ± 6.0 | < 0.001 | 73.4 ± 10.9 | 82.2 ± 9.5 | < 0.001 |
| BMI (kg/m2) | 134.1 (127.3,143.0) | 22.6 ± 1.4 | 24.1 ± 0.6 | < 0.001 | 25.0 ± 1.8 | 28.1 ± 2.1 | < 0.001 |
| WHtR | 15.2 (10.9,17.0) | 0.5 ± 0.0 | 0.5 ± 0.0 | < 0.001 | 0.5 ± 0.0 | 0.6 ± 0.0 | < 0.001 |
| RBC (× 1012/L) | 14.8 (9.0,15.0) | 4.8 (4.5,5.1) | 4.9 (4.6,5.2) | 0.011 | 5.0 (4.6,5.3) | 5.1 (4.9,5.4) | < 0.001 |
| HGB (g/L) | 1.0 (0.7,1.2) | 141.9 (131.0,155.0) | 145.4 (135.0,156.0) | 0.016 | 149.0 (140.0,160.0) | 152.8 (146.0,163.0) | 0.001 |
| ALT (mmol/L) | 59 (18.0%) | 19.0 (13.0,22.0) | 23.6 (14.1,28.9) | < 0.001 | 24.3 (15.3,28.5) | 33.9 (21.0,40.0) | < 0.001 |
| AST (mmol/L) | 15 (4.6%) | 20.3 (16.0,22.0) | 21.3 (17.0,23.3) | 0.101 | 20.9 (17.0,23.0) | 24.4 (19.0,27.1) | < 0.001 |
| GGT (mmol/L) | 3 (0.9%) | 17.9 (11.0,21.0) | 24.1 (13.0,29.0) | < 0.001 | 23.6 (14.0,27.9) | 36.9 (19.0,43.1) | < 0.001 |
| SUA (μmol/L) | 20.3 ± 1.5 | 308.9 (258.0,357.0) | 332.9 (278.0,383.4) | 0.002 | 347.7 (282.4,400.2) | 378.3 (322.3,430.1) | < 0.001 |
| FBG (mmol/L) | 0.4 ± 0.0 | 5.4 (5.1,5.7) | 5.7 (5.2,5.9) | 0.005 | 5.8 (5.3,6.0) | 6.2 (5.4,6.2) | 0.008 |
| TG (mmol/L) | 4.6 (4.4,4.8) | 1.2 (0.8,1.4) | 1.5 (0.9,1.7) | 0.022 | 1.5 (1.0,1.8) | 1.9 (1.2,2.3) | < 0.001 |
Abbreviations: WC, waistline circumference; BMI, body mass index; WHtR, waist-to-height ratio; RBC, red blood cell; HGB, hemoglobin levels; ALT, alanine aminotransferase; AST, aspartate aminotransferase; GGT, γ-glutamyl transpeptidase; SUA, serum uric acid; FBG, fasting blood glucose; TG: triglycerides.
a P - value for difference between overweight by either vs. overweight by both.
b P - value for difference between obese by either vs. obese by both.
The last four groups were compared with the "normal weight by both" group. The Spearman correlation and ROC curve analysis are shown in Table 4 and Figure 4, respectively. The correlation coefficient for each variable in the composite index group was higher than in the single index groups (overweight by both vs. overweight by either, obese by both vs. obese by either) (Table 4). Similarly, the AUC for each variable in the composite index group was higher than in the single index groups (overweight by both vs. overweight by either, obese by both vs. obese by either) (Figure 4). Hence, the ability to identify risk factors for NAFLD was significantly improved when the two indices were combined.
Table 4.
Correlation Coefficients for NAFLD High - Risk Features Based on the Overweight and Obese Classification
| Variables | Overweight Compared to Normal Weight | Obese Compared to Normal Weight | ||||||
|---|---|---|---|---|---|---|---|---|
| Either BMI or WHtR | P - Value | Both BMI and WHtR | P - Value | Either BMI or WHtR | P - Value | Both BMI and WHtR | P - Value | |
| WC (cm) | 0.573 | < 0.001 | 0.801 | < 0.001 | 0.791 | < 0.001 | 0.863 | < 0.001 |
| Weight (kg) | 0.451 | < 0.001 | 0.727 | < 0.001 | 0.674 | < 0.001 | 0.841 | < 0.001 |
| BMI (kg/m2) | 0.611 | < 0.001 | 0.863 | < 0.001 | 0.797 | < 0.001 | 0.866 | < 0.001 |
| WHtR | 0.655 | < 0.001 | 0.863 | < 0.001 | 0.813 | < 0.001 | 0.866 | < 0.001 |
| RBC (× 1012/L) | 0.211 | < 0.001 | 0.373 | < 0.001 | 0.386 | < 0.001 | 0.572 | < 0.001 |
| HGB (g/L) | 0.233 | < 0.001 | 0.372 | < 0.001 | 0.450 | < 0.001 | 0.569 | < 0.001 |
| ALT (mmol/L) | 0.247 | < 0.001 | 0.400 | < 0.001 | 0.445 | < 0.001 | 0.673 | < 0.001 |
| AST (mmol/L) | 0.135 | 0.003 | 0.217 | < 0.001 | 0.240 | < 0.001 | 0.430 | < 0.001 |
| GGT (mmol/L) | 0.236 | < 0.001 | 0.446 | < 0.001 | 0.456 | < 0.001 | 0.659 | < 0.001 |
| SUA(μmol/L) | 0.247 | < 0.001 | 0.394 | < 0.001 | 0.439 | < 0.001 | 0.606 | < 0.001 |
| FBG (mmol/L) | 0.128 | 0.005 | 0.268 | < 0.001 | 0.363 | < 0.001 | 0.479 | < 0.001 |
| TG (mmol/L) | 0.222 | < 0.001 | 0.329 | < 0.001 | 0.435 | < 0.001 | 0.589 | < 0.001 |
Abbreviations: WC, waistline circumference; BMI, body mass index; WHtR, waist-to-height ratio; RBC, red blood cell; HGB, hemoglobin levels; ALT, alanine aminotransferase; AST, aspartate aminotransferase; GGT, γ-glutamyl transpeptidase; SUA, serum uric acid; FBG, fasting blood glucose; TG: triglycerides.
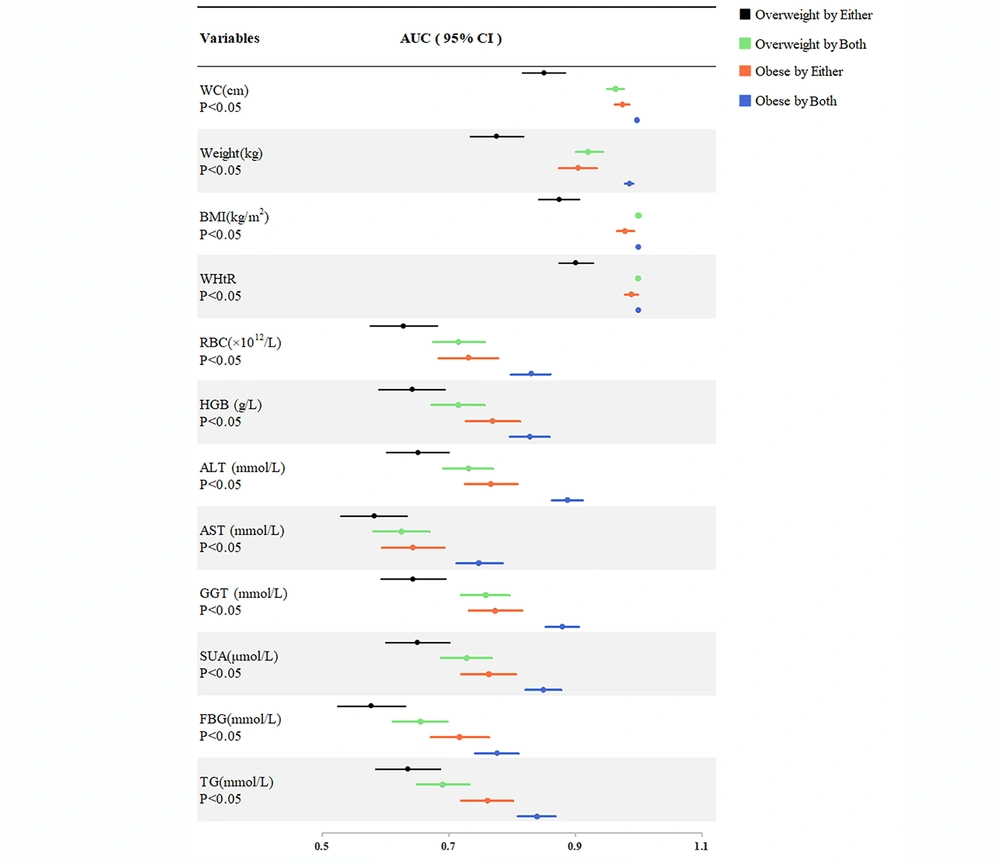
Figure 4.
Area under the ROC curve values (95 % CI) for NAFLD high-risk features based on the overweight and obese classification.
5. Discussion
Based on our 2017 study, the adult prevalence of NAFLD in Dalian was 28.21% and it tended to affect individuals suffering from hypertension, diabetes, gallbladder polyps or thyroid nodules. In addition, our results indicate that males have a significantly higher prevalence of NAFLD than females. Our results confirmed that WC, ALT, TG, GGT, SUA, RBC, HGB, FBG and AST were high risk factors for NAFLD.
The metabolic syndrome, which includes hypertension, elevated fasting blood glucose levels, hyperlipidemia, and abdominal obesity, has been shown to be closely associated with NAFLD. These two conditions are linked due the relationship that exists between central obesity, steatosis, and insulin resistance (21, 22). At present, no studies have explored the relationship between gallbladder polyps or thyroid nodules and NAFLD. One study showed that gallstones were significantly associated with NAFLD (23), but our findings showed the opposite. According to another study, the prevalence of NAFLD is approximately 30 - 40% in men and 15 - 20% in women (24), which is consistent with our findings. The possible reason for the gender difference depends on sex hormone levels, which may lead to differences in the amount and distribution of body fat (25), with men more likely to accumulate fat in the abdomen.
WC is considered to be more strongly correlated with visceral adipose tissue than BMI, but gender and race need to be taken into account to determine the diagnostic threshold, so its diagnostic value is not widely recognized (19). According to a meta-analysis, increased SUA levels, which may be independent of the traditional NAFLD risk factors, were associated with an increased risk of NAFLD (26). Previous studies reported that HGB was a risk marker for NAFLD, and NASH was associated with higher RBC and HGB levels (27). Hai-lin Wang et al. showed that HGB and TG were independent parameters associated with NAFLD (28). It has been suggested that NAFLD is associated with a two to five times higher risk of developing T2DM (29). In our study, the prevalence of diabetes and abnormal FBG levels in the NAFLD group was significantly higher than in the non-NAFLD group. An epidemiological report showed that elevated aminotransferases were risk factors for progression to fibrosis and cirrhosis (3). Combining the BMI, WC, and serum TG and GGT levels into the fatty liver index (FLI) is useful in large-scale epidemiological studies (30). This conclusion has been extensively validated. For high-risk groups, the NAFLD liver fat score (which includes AST levels and the AST/ALT ratio) is a very simple alternative (31). These conclusions are all consistent with our results.
The ability of the BMI to determine the risk of NAFLD has been demonstrated repeatedly (12, 32, 33). Likewise, the ability of the WHtR to identify the risk of NAFLD is supported by a number of studies (9, 10, 34). These two indices have been used as possible non-invasive tools for NAFLD screening (35). However, some studies have questioned these conclusions, arguing that height, the waist-to-hip ratio or the abdominal volume index are better predictors of NAFLD (36-38).
Our binary logistic regression analysis suggested that both BMI and WHtR were important and independent risk factors for NAFLD, and that joint measurement may improve risk classification. We found that participants classified using the two indices were on average, more overweight or obese; in other words, they would be more likely to be correctly diagnosed based on the BMI and WHtR combination. In addition, our results demonstrated that individuals who were overweight or obese based on the combination of WHtR and BMI exhibited stronger associations with individual NAFLD risk factors than subjects categorized based on either index alone. Particularly, patients in the highest tertile according to the composite index had significantly higher risks than other obese subjects (19).
Several other studies have also concluded that the composite index is better than single indices. For example, Mitsuhashi K et al. divided their study subjects into four groups, depending on whether the BMI ≥ 23kg/m2 and the WC ≥ 0.5. They concluded that overweight and abdominal obesity in the composite index group were significantly associated with diabetes (20). Based on the BMI, WC and WHtR cut-off values for overweight, Luz et al. divided their study participants into five groups: BMI, WC, WHtR, BMI+WC and BMI + WHtR. They concluded that combining BMI + WC and BMI + WHtR improved the identification of hypertension risk (18). Similar to our study, Millar et al. restratified their participants according to the BMI and WHtR tertiles, and concluded that the cardiometabolic risk was significantly higher in individuals defined as overweight or obese based on the BMI and WHtR composite index, than in subjects classified using either index alone (19).
It is well known that NAFLD, hypertension, diabetes and heart-related diseases are all related to obesity, especially central obesity. We hypothesize that combining the two obesity indicators, BMI and WHtR, permits an optimization of the overweight and obesity classification, allowing improved identification of overweight and obese patients who may not be detected using a single index. Therefore, the ability of the composite index to identify the risk of obesity-related diseases increases.
To our knowledge, our study is the first comprehensive analysis of the combined use of WHtR and BMI to assess the risk of NAFLD in adults. This method can provide targeted risk assessment recommendations for adult patients during routine health check-ups. More importantly, it might be useful in the case of individuals who do not have regular access to primary healthcare services, or who live in resource-poor settings where blood sampling is unavailable. Our findings have potential public health and clinical implications for obesity screening and stratification and to determine NAFLD risk.
Notwithstanding these strengths of our study, it has several limitations. First, the diagnostic method we used was ultrasound, which is not the most accurate and sensitive way of diagnosing NAFLD. However, it has been demonstrated that ultrasound shows a high diagnostic accuracy for NAFLD (6, 39). In addition, it is the first-line imaging technique in the clinic. It is worth noting that we did not use the established obesity index cut-off value, although the thresholds for BMI and WHtR commonly used by the World Health Organization are widely accepted (17, 40, 41). Furthermore, our data was cross-sectional and did not consider time variables. Based on the goal of this study, it was necessary to analyze both indices at a single moment in time. In the future, longitudinal data should be analyzed to assess the applicability and effectiveness of combined measurements using recommended diagnostic cut-off values (19). In addition, since we only collected the data of subjects from Dalian, China, the sample may not be representative of the entire population. However, the use of random sampling and effective data collection methods ensures the effectiveness of samples, so the results of this study could be extended to similar adult populations. Nevertheless, the results would be more convincing if they were based on multi-regional and multiethnic data.
6. Conclusions
We found that BMI, WC, WHtR, ALT, weight, TG, GGT, SUA, RBC, HGB, FBG and AST were high risk factors for NAFLD in the adult population we examined. Among these factors, BMI and WHtR were identified as independent risk factors. NAFLD tended to occur in males and subjects suffering from hypertension, diabetes, gallbladder polyps or thyroid nodules. In addition, the combined use of BMI and WHtR improved the detection of body fat and was more accurate for the identification of individuals at risk of NAFLD than BMI or WHtR alone. Early identification of at-risk individuals would permit targeted interventions or therapies, thereby preventing the development of NAFLD and its complications.