1. Background
Non-alcoholic fatty liver disease (NAFLD) represents the leading cause of chronic liver disease in Western countries (1). One particular study conducted in the United States estimated that one third of their adult population suffer from NAFLD (2). Similarly, some studies in European countries have reported a NAFLD prevalence of 20% - 30% (3, 4). While the prevalence of non-alcoholic steatohepatitis (NASH) was reported as 2% in one study of the general Iranian population, the prevalence of NAFLD was estimated to be more than 40% in another study on the same population (5, 6). Due to rapid urbanization and industrialization, the prevalence of NAFLD has significantly increased in Asian countries; as a result, some studies have shown a similar prevalence of NAFLD between Asian, American, and European countries in recent years (7). NAFLD can cause harmful effects to the liver tissue; some studies have reported that 30% - 70% of cryptogenic cirrhosis cases may be attributed to NAFLD and NASH (8). Recent data has also shown that the prevalence of NAFLD-related hepatocellular carcinoma is increasing (9).
A strong association between obesity and NAFLD has been reported, and visceral obesity has been suggested to be the most important predictor for NAFLD (10, 11). Several new indices of obesity, including a body shape index (ABSI) and body roundness index (BRI), have recently been introduced. These indices are calculated based on anthropometric measures including waist circumference, BMI, and height. Although the predictive ability of obesity indices has previously been evaluated in terms of their ability to identify NAFLD, few studies have been conducted to evaluate the predictive ability of ABSI and BRI in this context. In other studies, these indices have been demonstrated as having some predictive abilities for various areas of health conditions and diseases such as cardiovascular health status, left ventricular hypertrophy, diabetes mellitus, and hyperuricemia (12-16).
2. Objectives
This study was conducted to evaluate if ABSI and BRI can be used to discriminate NAFLD patients, and also to determine which of the above mentioned indices, including ABSI, BRI, WHR, and WHtR, has the stronger association with NAFLD.
3. Methods
3.1. Study Population
A baseline cohort study was carried out among 6,143 subjects (3,489 men and 2,654 women) aged between 10 and 90 years in Amol, northern Iran. The cohort study was started in September 2008, and the data collection process took 18 months. The sampling frame was provided from primary healthcare centers, where each citizen had a health record file. The population of the city was divided into 16 strata according to gender and age groups, with equivalent intervals of 10 years. The subjects were randomly selected from each stratum by a proportion to size approach. Finally, the data of 4,812 subjects (2,769 men and 2,043 women) aged between 18 and 74 years were analyzed for the purposes of this study. All procedures followed were in accordance with the ethical standards of the committees responsible for human experimentation (institutional and national) and with the Helsinki declaration of 1975, as revised in 2008. Informed consent was obtained from all patients prior to their inclusion in the study, and was approved by the ethics committee of Iran University of Medical Sciences. A schematic diagram of the study population is shown in Figure 1.
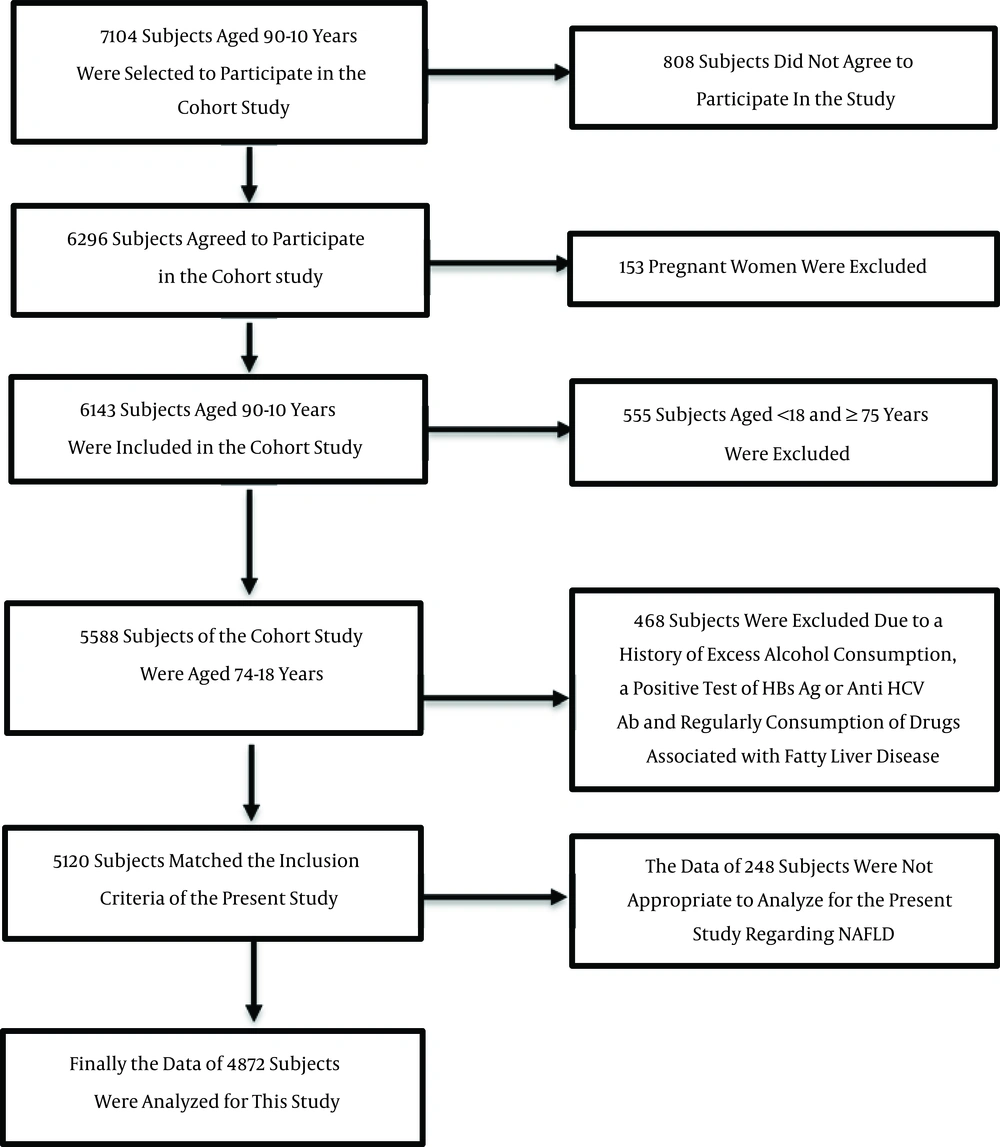
Figure 1.
A Schematic Diagram of the Study Participants and Exclusions
3.2. Data Collection
Trained healthcare providers measured the weight, height, waist circumference, hip circumference, and blood pressure of each participant. Weight was measured when the participants removed excess clothing and shoes. Height was measured in an upright position, when the heels and buttocks of the participants were in contact with the wall. Waist circumference (WC) was determined at the midpoint of the distance between the lowest costal ridge and the upper border of the iliac crest. The largest circumference between the waist and the knees was considered as the hip circumference (HC). Following at least five minutes of rest, blood pressure was measured when participants were in a seated position using a fitted cuff. After 12 hours of fasting, fasting blood sugar (FBS) and lipid profiles were obtained and evaluated. All laboratory tests, including FBS and lipid profiles, were assessed enzymatically based on standard protocol using the BS200 Auto Analyzer (Mindray, China).
Liver ultrasonography was performed on all of the participants. NAFLD was defined as evidence of hepatic steatosis in ultrasonography, and a lack of evidence for other causes of acute or chronic hepatitis, such as significant alcohol consumption, use of steatogenic medication, or hereditary disorders. All ultrasound examinations were carried out by an expert radiologist. Homeostasis model assessment of insulin resistance (HOMA-IR) was calculated using the following formula:
3.3. Statistical Analysis
ABSI, BRI, and WHtR were calculated using the following formula:
The univariate and multivariate regression analyses were performed with NAFLD as the outcome and obesity measures as the potential predictors. In the multivariate models, age, triglyceride levels (TG), high density lipoprotein levels (HDL), HOMA, and mean arterial pressure (MAP), in addition to the related obesity measures, were entered into models as potential mediators. Thus, the association between obesity measures and NAFLD was evaluated, removing the effects of other variables, in a multivariate analysis. Regression analyses were performed separately for men and women. It is worth noting that the Z-scores of obesity indices were entered into the regression models to obtain comparable results for different indices. The Z-scores were calculated using the following formula:
The odds ratios and related confidence intervals along with P values were recorded. To evaluate the discriminatory ability of the obesity measures, receiver operating characteristic (ROC) analyses were conducted in which NAFLD was considered as a reference variable, and obesity measures as classification variables. To calculate the related area under the ROC curves (AUCs), the sensitivities of the infinite decision thresholds of these indices were plotted against their false positive rates. Thus, we were able to determine the discriminatory ability of these indices in the diagnosis of NAFLD. The lower boundary line for AUC was considered as 0.5, since a significantly greater area than 0.5 usually shows the ability of indices to discriminate individuals with a related condition from individuals without one. The optimal cut-off points of BRI and WHtR in the discrimination of people with NAFLD from people without were also determined using maximal values of Youden’s J statistic as follows:
The values of BRI and ABSI corresponding to a maximum value of the Youden index were considered as the optimal cut-off points for the related indices. The significance level for all analyses was considered as 0.05. All statistical analyses were conducted using IBM SPSS Statistics, version 21.0. (Armonk, NY: IBM Corp.) and STATA software, version 12 (STATA Corp., Texas, USA).
4. Results
Table 1 shows the basic characteristics of the study population. Except for HDL, other characteristic values were significantly higher in individuals with NAFLD than individuals without NAFLD, with P values < 0.0001.
Table 1.
Basic Characteristics of the Study Participants with and without NAFLD
| Characteristics | Groupsa | P Value | |
|---|---|---|---|
| Individuals without NAFLD (n = 2824) | Individuals with NAFLD (n = 2048) | ||
| Age | 39.04 ± 15.35 | 48.61 ± 12.66 | < 0.0001 |
| Weight | 69.34 ± 12.64 | 83.39 ± 13.93 | < 0.0001 |
| WC | 84.72 ± 10.78 | 99.81 ± 10.11 | < 0.0001 |
| HC | 99.82 ± 8.46 | 108.53 ± 9.62 | < 0.0001 |
| Height | 165.04 ± 10.07 | 163.18 ± 10.20 | < 0.0001 |
| WHR | 0.8491 ± 0.0864 | 0.9213 ± 0.0726 | < 0.0001 |
| WHtR | 0.5154 ± 0.0741 | 0.6139 ± 0.0722 | < 0.0001 |
| ABSI | 0.0766 ± 0.0058 | 0.0790 ± 0.0050 | < 0.0001 |
| BRI | 3.763 ± 1.544 | 5.857 ± 1.751 | < 0.0001 |
| DBP | 72.94 ± 12.07 | 80.64 ± 12.45 | < 0.0001 |
| SBP | 112.07 ± 14.67 | 121.77 ± 16.79 | < 0.0001 |
| MAP | 85.98 ± 12.02 | 94.34 ± 13.06 | < 0.0001 |
| TG | 120.38 ± 74.21 | 174.89 ± 115.47 | < 0.0001 |
| FBS | 94.60 ± 28.42 | 108.88 ± 41.21 | < 0.0001 |
| Cholesterol | 174.57 ± 40.74 | 194.38 ± 42.77 | < 0.0001 |
| HDL | 46.96 ± 11.69 | 41.45 ± 11.26 | < 0.0001 |
| LDL | 101.50 ± 30.27 | 114.00 ± 31.08 | < 0.0001 |
| HOMA | 1.957 ± 1.561 | 3.096 ± 2.698 | < 0.0001 |
Abbreviations: ABSI, a body shape index; BMI, body mass index; BRI, body roundness index; DBP, diastolic blood pressure; FBS, fasting blood sugar; HC, hip circumference; HDL-C, high density lipoprotein cholesterol; HOMA, homeostatic model assessment; LDL-C, low density lipoprotein cholesterol; SBP, systolic blood pressure; SD, standard deviation; TG, triglyceride; WC, waist circumference; WHR, waist-to-hip ratio; WHtR, waist-to-height ratio.
aValues are presented as mean ± SD.
Table 2 shows the means and related standard deviations for the obesity indices in individuals with and without NAFLD for men and women separately. Based on our results, the significantly higher values of obesity measures were related to NAFLD sufferers as compared to others, with P values < 0.0001.
Table 2.
The Mean and Standard Deviations of Obesity Measures for Individuals with and without NAFLD for Men and Women Separately
| Obesity Indices | Groups | |||||
|---|---|---|---|---|---|---|
| Men (n = 2723) | Women (n = 2149) | |||||
| Individuals without NAFLD (n = 1622) | Individuals with NAFLD (n = 1101) | P Value | Individuals without NAFLD (n = 1202) | Individuals with NAFLD (n = 947) | P Value | |
| ABSI | 0.0775 ± 0.0052 | 0.0797 ± 0.0043 | < 0.0001 | 0.0754 ± 0.0064 | 0.0782 ± 0.0055 | < 0.0001 |
| BRI | 3.417 ± 1.312 | 5.201 ± 1.402 | < 0.0001 | 4.233 ± 1.704 | 6.618 ± 1.806 | < 0.0001 |
| WHR | 0.8670 ± 0.0853 | 0.9426 ± 0.0631 | < 0.0001 | 0.8251 ± 0.0820 | 0.8967 ± 0.0750 | < 0.0001 |
| WHtR | 0.4984 ± 0.0657 | 0.5863 ± 0.0611 | < 0.0001 | 0.5384 ± 0.0785 | 0.6460 ± 0.0708 | < 0.0001 |
Abbreviations: ABSI, a body shape index; BRI, body roundness index; WHR, waist to hip ratio; WHtR, waist to height ratio; NAFLD, non-alcoholic fatty liver disease.
Table 3 shows the results of univariate and multivariate logistic regression analyses on NAFLD as the outcome in men and women. Based on our results, BRI (Z-score) and WHtR (Z-score) showed higher associations with NAFLD than ABSI and WHR in both analyses for both men and women.
Table 3.
The Results of Univariate and Multivariate Binary Regression Analyses on NAFLD as the Outcome in Men and Women
| Potential Predictors | Univariate | Multivariate | ||||
|---|---|---|---|---|---|---|
| Wald | Od (95% CI) | P Value | Wald | Od (95% CI) | P Value | |
| Men (n = 2723) | ||||||
| BRI_Z-score | 685.5 | 7.807 (6.694 - 9.105) | < 0.0001 | 336.6 | 5.484 (4.572 - 6.577) | < 0.0001 |
| ABSI_Z-score | 154.5 | 1.859 (1.686 - 2.050) | < 0.0001 | 25.1 | 1.363 (1.208 - 1.539) | < 0.0001 |
| WC_Z-score | 721.1 | 6.835 (5.940 - 7.864) | < 0.0001 | 293.5 | 4.881 (4.173 - 5.709) | < 0.0001 |
| BMI_Z-score | 697.1 | 7.682 (6.603 - 8.937) | < 0.0001 | 391.5 | 5.554 (4.686 - 6.582) | < 0.0001 |
| WHR_Z-score | 510.3 | 3.749 (3.343 - 4.205) | < 0.0001 | 360.6 | 3.123 (2.777 - 3.512) | < 0.0001 |
| WHtR_Z-score | 694.7 | 7.188 (6.207 - 8.323) | < 0.0001 | 354.7 | 5.309 (4.463 - 6.317) | < 0.0001 |
| Women (n = 2149) | ||||||
| BRI_Z-score | 568.5 | 5.464 (4.752 - 6.283) | < 0.0001 | 239.9 | 3.482(2.973 - 4.077) | < 0.0001 |
| ABSI_Z-score | 117.7 | 1.648 (1.505 - 1.803) | < 0.0001 | 0.004 | 1.003 (0.909 - 1.107) | 0.9503 |
| WC_Z-score | 566.3 | 6.260 (5.382 - 7.281) | < 0.0001 | 271.9 | 4.092 (3.461 - 4.838) | < 0.0001 |
| BMI_Z-score | 511.6 | 4.307 (3.795 - 4.888) | < 0.0001 | 285.2 | 3.549(3.064 - 4.111) | < 0.0001 |
| WHR_Z-score | 360.6 | 3.123 (2.777 - 3.512) | < 0.0001 | 47.4 | 1.628 (1.417 - 1.870) | < 0.0001 |
| WHtR_Z-score | 572.6 | 5.959 (5.149 - 6.897) | < 0.0001 | 254.4 | 3.854 (3.265 - 4.549) | < 0.0001 |
Abbreviations: ABSI, a body shape index; BMI, body mass index; BRI, body roundness index; CI, confidence interval; WC, waist circumference; WHR, waist-to-hip ratio; WHtR, waist-to-height ratio.
We evaluated the discriminatory abilities of ABSI, BRI, WHR, and WHtR in the diagnosis of NAFLD. Their related AUCs for men were 0.6539 (95% CI = 0.6351 - 0.6727), 0.8457 (95% CI = 0.8320 - 0.8593), 0.8018 (95% CI = 0.7862 - 0.8173), and 0.8457 (95% CI = 0.8320 - 0.8593), respectively. For women, the related AUCs were 0.6598 (95% CI = 0.6382 - 0.6814), 0.8566 (95% CI = 0.8419 - 0.8714), 0.7673 (95 %CI = 0.7487 - 0.7860), and 0.8566 (0.8419 - 0.8714), respectively. The associated graphs are displayed in Figure 2. The optimal cut-off points for BRI were 4.00 (sensitivity = 82.7%, specificity = 70.8%) for men and 5.00 (sensitivity = 83.3%, specificity = 71.7%) for women. The optimal cut-off points for WHtR were 0.533 (sensitivity = 82.7%, specificity = 70.8%) for men and 0.580 (sensitivity = 83.3%, specificity = 71.7%) for women.
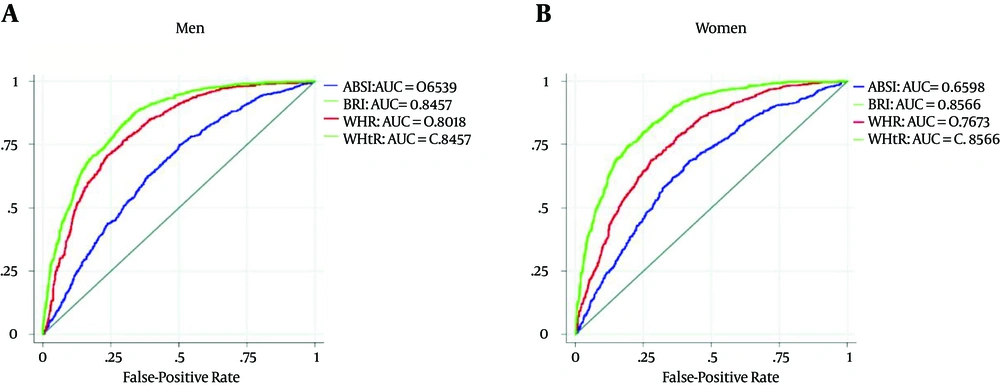
Figure 2.
A is related to men and B is related to women. The blue and red colored curves are related to ABSI and WHR, respectively. The lime color is related to the curves of BRI and WHtR that completely coincided. ABSI: a body shape index, AUC: area under receiver operating characteristic (ROC) curve, BRI: body roundness index, WHR: waist-to-hip ratio, WHtR: waist-to-height ratio.
5. Discussion
Our study revealed that ABSI, BRI, WHR, and WHtR were associated with NAFLD. The association between these indices and NAFLD remained even after removing the effects of other potential mediators such as age, dyslipidemia, and insulin resistance. However, BRI and WHtR showed higher associations with NAFLD than ABSI and WHR. Although BRI is a new index, several studies evaluated its ability to predict or discriminate the outcomes of heart diseases, hyperuricemia, and diabetes. For example, Chang et al. reported that BRI is a superior measure than BMI, WC, and WHtR to determine the presence of left ventricular hypertrophy (LVH), particularly for eccentric LVH (13). Zhang et al. reported a slightly different ability of BRI, WHtR, and WC in the diagnosis of hyperuricemia in a cross-sectional study of a Chinese rural population (16). In an evaluation of the association between BRI and ABSI and diabetes mellitus, Chang et al. determined that neither ABSI nor BRI were superior to BMI, WC, or WHtR in the discrimination of diabetic patients (12). They reported the weakest discriminatory ability for ABSI among the above mentioned indices (12). Although Maessen et al. reported that BRI was able to determine the presence of CVD, they did not detect a significant difference among BRI, WC, and BMI in this context. However, WHtR was not evaluated in their study (14).
Our results also revealed an equal discriminatory ability for BRI and WHtR in the diagnosis of NAFLD. With a simple and straightforward manipulation of the WHtR formula, we can conclude that BRI is a univariable function of WHtR using the following formula:
As a result, we should not expect a significant difference between the discriminatory ability of BRI and that of WHtR. In fact, when we are looking to predict or discriminate a condition such as NAFLD, an equal discriminatory ability will be obtained from WHtR and BRI. On the other hand, the optimal cut-off points of BRI and WHtR can be easily converted to each other using the above equation (the formula of BRI based on WHtR). In other words, the results of each of these two indices can be expressed in terms of the other (more details are discussed in Appendix 1 of the Supplementary File).
Our calculated cut-off points for BRI (4.00 for men and 5.00 for women) and WHtR (0.533 in men and 0.58 in women) were greater for women than for men. The greater cut-off points of these indices for women compared to men is not unexpected due to the almost equal WC between our male and female participants, and a dramatically lower height in our female participants as compared to the heights of men (regarding the BRI and WHtR formula).
As mentioned above, our results revealed that BRI and WHtR had high (and equal) discriminatory abilities in the diagnosis of NAFLD. Although Zheng et al. reported an even higher discriminatory ability of WHtR than that of our study, they emphasized that the ability of WHtR was less than WHR, which is in disagreement with our results (17). However, the discriminatory ability of BRI was not evaluated in their study. These inconsistent findings among the studies can be partly attributed to the difference in anthropometric characteristics among various ethnic and racial groups.
In summary, we evaluated the discriminatory ability of two new indices of obesity in the diagnosis of NAFLD besides WHR and WHtR in a large community based study. We also obtained the optimal cut-off points for BRI and WHtR in the diagnosis of NAFLD in men and women, separately. We were able to show that the discriminatory ability of these two indices is identical, and that the optimal cut-off points of these two indices are interchangeable, using a simple algebraic equation (a function of BRI in terms of the variable of WHtR or vice versa).
Our study had some limitations. It had a cross-sectional design, which is not optimal for establishing a cause and effect relationship. It is worth mentioning, though, that since we evaluated the association between obesity and related indices with NAFLD, determining a cause and effect relationship is not necessarily logically problematic. We also did not utilize liver biopsy in the diagnosis NAFLD. Applying biopsy (as an invasive diagnostic tool) in a large community based study is not only an unethical approach, but also may lead to a relatively high false-negative rate in the detection of NAFLD (18).
5.1. Conclusion
While BRI and WHtR have an equally strong association with NAFLD, ABSI and WHR have a weaker association with NAFLD than BRI and WHtR. The optimal cut-off points of BRI were 4.00 and 5.00 for men and women, and the optimal cut-off points of WHtR were 0.533 and 0.580 for men and women, respectively.