
1. Background
Non-alcoholic fatty liver disease (NAFLD) is a common cause of chronic hepatitis defined as accumulation of fat in the liver tissue in the absence of any secondary cause, such as excess consumption of alcohol or drugs that can lead to cirrhosis and hepatocellular carcinoma (1, 2). Non-alcoholic fatty liver disease has a range of clinical conditions encompassing simple steatosis (fatty accumulation in the liver tissue), non-alcoholic steatohepatitis (NASH) (inflammatory cell infiltration in the liver), hepatocyte ballooning, and hepatic cirrhosis (3). During the recent decades, the prevalence of NAFLD has increased due to life style alternations and caused a significant increase in the prevalence of obesity and metabolic syndrome (4, 5) Based on the results of different studies, prevalence of NAFLD in Iranian population is variable, however, a meta-analysis in 2016 showed a prevalence of 33.9% in Iran (6).
Liver biopsy is considered as the gold standard for diagnosis of NAFLD, but it is an invasive method and may cause some complications (7). Accordingly, non-invasive imaging methods, particularly ultrasound are used to diagnose fatty liver disease in most cases (8). Transient elastography is a novel non-invasive method, which is developed to measure tissue stiffness, using the shear wave velocity named FibroScan in medical practice. Controlled attenuation parameter (CAP) has been implemented using FibroScan to assess liver steatosis based on ultrasound attenuation (9). CAP is able to satisfactorily differentiate between the different grades of steatosis and identify steatosis even at early stages (> 11%) (10).
In the recent years, a number of indices have been considered to predict fatty changes of the liver including the fatty liver index (FLI), hepatic steatosis index (HIS), NAFLD liver fat score, and Steato test (ST) (11). FLI, developed by Bedogni et al. in 2006, is a simple and accurate index based on routine clinical and anthropometric measurements including body mass index (BMI), waist circumference (WC), triglyceride (TG), and gamma glutamyltransferase (GGT) (12). According to Bedogni study, a FLI < 30 rules out and a FLI ≥ 60 rules in fatty liver (13). FLI is not only used to screen fatty liver disease, but it also contributes to identifying high-risk individuals for NAFLD, referring them to imaging methods and life style counseling (13). Due to the variation of life styles among various populations and significant different cut-off points of BMI and WC, it is highly important to determine the optimal cut-off points of FLI, based on populations' features (14). In previous studies, the optimal cut-off point of FLI has been determined through applying ultrasound diagnosis. However, US has limitations such as low sensitivity in steatosis of less than 20% to 30% and dependency on the operator’s judgment (15).
The present study was conducted to investigate the ability of FLI in predicting NAFLD and determining the optimal cut-off points of FLI to detect NAFLD, based on FibroScan and CAP diagnosis in Iran’s population.
2. Methods
2.1. Participations
This cross-sectional study was conducted in Mashhad, a city in northeast of Iran, during March 2016 and September 2016. The participants were selected consecutively from those admitted to a gastrointestinal clinic in Mashhad. Inclusion criteria were as follow: age > 18 years; no significant alcohol consumption (> 14 units per week in females and > 21 units per week in males in the past 2 years); no history of B, C, or autoimmune hepatitis and congenital hepatic diseases; and no problems affecting physical activity practice. However, those having abdominal surgery in the last 6 months, those with any drug history which could have caused fatty liver (corticosteroid, valproate Na), and expecting mothers were excluded. Written informed consent was obtained from all participants. This research was approved by ethics committee of Mashhad University of Medical Sciences.
2.2. Data Collection
In this study, various factors including weight, height, waist circumference, hip circumference, and blood pressure were measured by a nutritionist expert at the FibroScan center. Weight and height were measured on a clinical scale (SECA), with 0.1 kg precision, and a wall-mounted stadiometer, respectively. Based on the outcomes of these measurements, BMI (weight (kg) / height (m2) was calculated. Waist circumference was determined halfway between the lower border of the ribs and the iliac crest in a horizontal plane. To measure hip circumference, the largest circumference over the buttocks was measured. All measurements were performed with 0.5 cm precision. Blood pressure was measured after a 5- minute rest, with a fitted cuff in the sitting position (The first appearance of Korotkoff sound is Systolic and the first disappearance is Diastolic blood pressure.). To minimize errors, the all measurements were performed by a single person. Blood samples were taken from the antecubital vein of each person after 12-hour fasting to assess TG, total cholesterol, LDL-C, HDL-C, AST, ALT, FBS, and GGT by standard laboratory methods.
NAFLD was determined via evidence of hepatic steatosis in controlled attenuation parameter (CAP). There are 4 grades of steatosis in CAP, which are as follow: S0 < 237 dB/m, S1: 237 - 259 dB/m, S2: 259 - 291 dB/m, and S3: 291 - 400 dB/m) (16). Also, hepatic fibrosis was determined by transient elastography, which was expressed as liver stiffness measurement (LSM) in Kpa. Fibrosis was staged from F0 to F4, F0: absence of fibrosis; F1: perisinusoidal or portal fibrosis; F2: both perisinusoidal and portal fibrosis; F3: septal or bridging fibrosis; and F4 indicate hepatic cirrhosis (17). The reported CAP and LSM measurement was the median of 10 measurements (18). The intraobserver agreement ICC was 0.98 for FibroScan results (19).
All FibroScan and CAP measurements were done by a single operator who was expert in FibroScan.
Finally, FLI was calculated based on the following formula:
FLI = [e0.953 × ln (TG) + 0.139 × BMI + 0.718 × ln (GGT) + 0.053 × WC - 15.745 / (1 + e0.953 × ln (TG) + 0.139 × BMI + 0.718 × ln (GGT) + 0.053 × WC - 15.745)] × 100
2.3. Statistical Analysis
All statistical analyses were performed using SPSS Version 16. Results were expressed as mean ± standard deviations for quantitative data, and number and percentage for qualitative data. Independent sample t test and Mann- Whitney test were used to compare quantitative variables between the 2 groups. A P value of less than 0.05 was considered as significant. We utilized univariate logistic regression to investigate the association of FLI, WC, BMI, TG, and GGT with liver steatosis and fibrosis; then, in the second step, we used multivariate logistic regression to estimate odds ratio (OR) and 95% confidence interval of FLI. We also adjusted age and sex. The capability of FLI to predict liver steatosis was analyzed using receiver operating characteristic curve (ROC) and the optimal cut-off points of FLI using Youden’s index.
3. Results
This study included 212 participants (103 males and 109 females), with a mean age of 39.26 ± 14.18. We found that the mean of FLI, waist circumference, GGT, and DBP were significantly higher in males than in females (P < 0.05).
Table 1 demonstrates the mean of age, anthropometric parameters, serum tests, and FLI in NAFLD and non-NAFLD, and also in fibrosis and non-fibrosis participants. The prevalence of NAFLD was significantly higher in males (52.6%) than in females (47.4%) (P = 0.05) (Table 1).
The mean of FLI (P < 0.001) and individual components including BMI (P < 0.001), WC (P < 0.001), TG (P = 0.001), and GGT (P = 0.001) was significantly higher in NAFLD patients than in non-NAFLD participants (Table 1).
Table 1.
General Characteristics of NAFLD, Non-NAFLD, Fibrosis and Non-Fibrosis Participants
| Variables | NAFLD 156 (73.6), N (%) | Non-NAFLD 56 (26.4), N (%) | P Value | Fibrosis 80 (37.7%), N (%) | Non-Fibrosis 132 (62.3%), N (%) | P Value |
|---|---|---|---|---|---|---|
| Gender | 0.053 | < 0.001 | ||||
| Male | 82 (52.6) | 21 (37.5) | 48 (60%) | 55 (41.6%) | ||
| Female | 74 (47.4%) | 35 (62.5%) | 32 (40%) | 77 (58.3%) | ||
| Mean (SD) | Mean (SD) | P Value | Mean (SD) | Mean (SD) | P Value | |
| Age | 41.47 (13.7) | 33.11 (13.7) | < 0.001a | 42.31 (14.4) | 37.42 (13.7) | 0.016a |
| SBP | 123.35 (19.3) | 116.25 (16.8) | 0.023a | 124.66 (18.3) | 119.54 (19.0) | 0.044a |
| DBP | 74.5 (13.2) | 69.23 (11.9) | 0.009 | 72.89 (11.8) | 73.26 (13.7) | 0.907a |
| Weight | 79.7 (13.9) | 63.90 (11.7) | < 0.001 | 80.00 (16.7) | 72.92 (13.3) | 0.002 |
| Height | 166.78 (9.5) | 163.90 (8.8) | 0.054 | 166.71 (9.3) | 165.62 (9.5) | 0.417 |
| BMI | 28.68 (4.1) | 23.76 (3.7) | < 0.001 | 28.69 (5.0) | 26.58 (4.0) | 0.002 |
| WC | 98.67 (10.1) | 83.44 (10.8) | < 0.001 | 99.5 (13.7) | 91.7 (10.4) | < 0.001 |
| TG | 127.46 (69.3) | 93.70 (38.8) | 0.001a | 123.54 (62.4) | 115.52 (65.5) | 0.189a |
| T-Chol | 178.5 (45.0) | 161.4 (34.0) | 0.028 | 180.3 (42.7) | 170.6 (43.3) | 0.155 |
| LDL-C | 105.2 (32.8) | 92.5 (24.9) | 0.013 | 108.0 (32.5) | 98.6 (30.5) | 0.062 |
| HDL-C | 43.8 (10.8) | 46.8 (12.3) | 0.150 | 44.4 (10.7) | 44.6 (11.6) | 0.767a |
| FBS | 96.4 (16.8) | 89.0 (8.8) | 0.003a | 96.2 (17.8) | 93.6 (13.9) | 0.630a |
| ALT | 33.8 (23.8) | 21.1 (12.4) | 0.001a | 34.5 (23.1) | 28.4 (21.5) | 0.062a |
| AST | 26.3 (14.0) | 21.4 (6.7) | 0.195a | 27.3 (13.4) | 23.7 (12.3) | 0.056a |
| GGT | 33.64 (33.5) | 20.89 (12.7) | < 0.001a | 32.41 (29.5) | 28.98 (30.3) | 0.016a |
| FLI | 55.19 (25.7) | 21.82 (19.9) | < 0.001a | 56.64 (30.2) | 40.15 (25.5) | < 0.001a |
Abbreviations: ALT, alanine amino transferase; AST, aspartate amino transferase; BMI, body mass index; DBP, diastolic blood pressure; FBS, fasting blood sugar; GGT, gamma glutamyl transferase; HDL-c, high density lipoprotein-cholesterol; LDL-C, low density lipoprotein-cholesterol; N, number; Normal distribution - using t-tests; non-normal distribution - using Kruskalwallis and Mann-Whitney tests; SBP, systolic blood pressure; SD, standard deviation; T-Chol, total cholesterol; TG, triglyceride; WC, waist circumference.
aMann-Whitney tests.
The prevalence of liver fibrosis in males (60%) was significantly higher than in females (40%) (P < 0.001). The mean of FLI was higher in liver fibrosis participants (56.64 ± 30.2) compared to non-liver fibrosis participants (40.15 ± 25.5) (P < 0.001) (Table 1).
We investigated the relationship between FLI and NAFLD based on logistic regression and our findings revealed a significant positive relationship between FLI and NAFLD, so that even a one unit increase in FLI elevated the chance of developing NAFLD by 6.2% (OR = 1.062, 95%CI: 1.042 - 1.082, P < 0.001). After adjusting for confounding factors such as sex, age, DBP, FBS, ALT, and LDL, the univariate logistic regression analysis showed a significant positive association between FLI and NAFLD (OR = 1.059, 95%CI: 1.035 - 1.083, P < 0.001) (Table 2).
Table 2.
Association of FLI and Risk Factors of Fatty Liver with NAFLDa
| Variable | Univariate Logistic Regression | Multivariate Logistic Regression | ||||||
|---|---|---|---|---|---|---|---|---|
| P Value | OR | 95% CI | P Value | OR | 95% CI | |||
| Lower | Upper | Lower | Upper | |||||
| FLI | < 0.001 | 1.062 | 1.042 | 1.082 | < 0.001 | 1.059 | 1.035 | 1.083 |
| Sex | 0.055 | 1.85 | 0.99 | 3.45 | 0.21 | 1.89 | 0.7 | 5.095 |
| Age | 0.016 | 1.047 | 1.022 | 1.072 | 0.14 | 1.031 | 0.99 | 1.075 |
| DBP | 0.10 | 1.034 | 1.008 | 1.061 | 0.83 | 1.004 | 0.97 | 1.046 |
| FBS | < 0.001 | 1.057 | 1.026 | 1.089 | 0.133 | 1.036 | 0.99 | 1.084 |
| ALT | 0.03 | 1.043 | 1.014 | 1.072 | 0.209 | 1.019 | 0.99 | 1.050 |
| LDL-C | 0.135 | 1.008 | 0.99 | 1.019 | 0.97 | 1.000 | 0.98 | 1.021 |
Abbreviations: ALT, alanine amino transferase; CI, confidence interval; DBP, diastolic blood pressure; FBS, fasting blood sugar; FLI, fatty liver index; LDL-C, low density lipoprotein-cholesterol; OR, odds ratio.
aMultivariate model adjusted for sex, age, diastolic blood pressure, fasting blood sugar, alanine amino transferase and Low density lipoprotein-cholesterol.
Moreover, the results of logistic regression analysis showed a strong positive correlation between FLI and hepatic fibrosis (OR = 1.022, 95%CI: 1.011 - 1.032, P < 0.001) (Table 3).
Table 3.
Association of FLI and Risk Factors of Liver Fibrosis with Hepatic Fibrosisa
| Variable | Univariate Logistic Regression | Multivariate Logistic Regression | ||||||
|---|---|---|---|---|---|---|---|---|
| P Value | OR | 95% CI | P Value | OR | 95% CI | |||
| Lower | Upper | Lower | Upper | |||||
| FLI | < 0.001 | 1.022 | 1.011 | 1.032 | 0.019 | 1.015 | 1.003 | 1.028 |
| Sex | 0.01 | 2.1 | 1.19 | 3.7 | 0.15 | 1.68 | 0.83 | 3.4 |
| Age | 0.016 | 1.025 | 1.005 | 1.046 | 0.095 | 1.024 | 0.99 | 1.052 |
| FBS | 0.15 | 1.014 | 0.99 | 1.033 | 0.74 | 0.99 | 0.97 | 1.020 |
| T-Chol | 0.21 | 1.014 | 0.99 | 1.011 | 0.48 | 1.003 | 0.99 | 1.011 |
| AST/ALT | 0.34 | 0.68 | 0.31 | 1.48 | 0.63 | 1.26 | 0.5 | 3.18 |
Abbreviations: AST/ALT, aspartate amino transferase / alanine amino transferase; CI, confidence interval; FBS, fasting blood sugar; FLI, fatty liver index; OR, Odds ratio; T-Chol, total cholesterol.
aMultivariate model adjusted for fasting blood sugar, aspartate amino transferase/alanine amino transferase and total cholesterol.
After adjusting for confounding factors such as sex, age, FBS, T-Cholesterol, and AST/ALT, there was a significant positive association between FLI and hepatic fibrosis (OR = 1.015, 95%CI: 1.003 - 1.028, P = 0.019) (Table 3).
The AUC of FLI was 0.85 (95%CI = 0.79 - 0.90) for predicting NAFLD in the total population, which was not significantly different in the AUC of WC (AUC = 0.85, 95%CI = 0.79 - 0.92) (P = 0.84) (Figure 1).
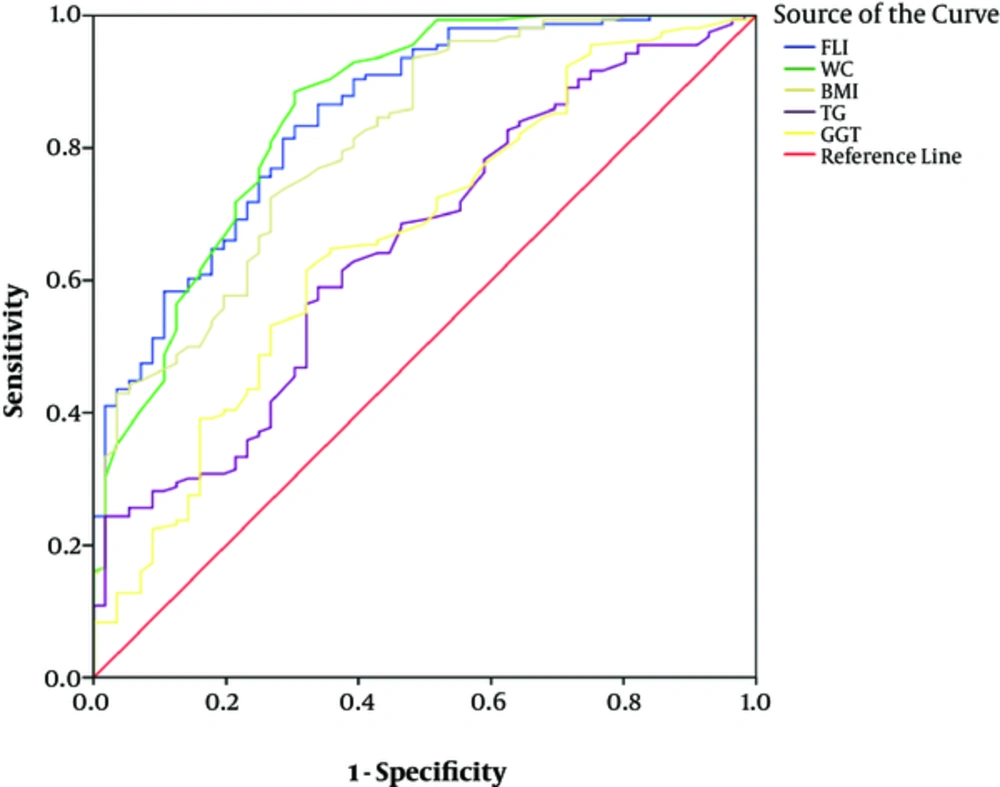
Figure 1.
AUC, Areas under the curves; BMI, Body mass index; WC, Waist circumference; TG, Triglyceride; GGT, Gamma glutamyl transferase; FLI, Fatty liver index.
The AUC of BMI (AUC = 0.81, 95% CI = 0.74 - 0.88), TG (AUC = 0.65, 95%CI = 0.57 - 0.73) and GGT (AUC = 0.66, 95%CI = 0.58 - 0.75) was significantly lower than the AUC of FLI (P > 0.05).
The optimal cut-off point of FLI was 26.2 (sensitivity = 0.83, specificity = 0.7) in total.
The optimal cut-off point was 30.4 in males (sensitivity = 0.82, specificity = 0.71) and 20.7 in females (sensitivity = 0.89, specificity = 0.66).
The optimal cut-off point of FLI in different grades of hepatic steatosis (determined by CAP) was 26.2 (sensitivity = 0.83, specificity = 0.7), 38.3 (sensitivity = 0.83, specificity = 0.68) and 49.7 (sensitivity = 0.57, specificity = 0.89), respectively, in Grades 1, 2, and 3 of hepatic steatosis.
4. Discussion
Our findings indicated that the FLI has a good performance in predicting NAFLD with an AUC of 0.84, based on controlled attenuation parameter (CAP) detection, which was in line with the results of a baseline cohort study in Iran that showed FLI has a good predicting power in the diagnosis of NAFLD, with an AUC of 0.865; however, in this cohort study, ultrasound was used for diagnosis of NAFLD (11). Also, in another study by Xiaolin Huang on 8626 Chinese adults, the AUC of FLI was 0.834 for predicting NAFLD (20).
The prominent performance of FLI in projection of NAFLD is due to the fact that BMI, and specially, WC are strongly correlated with NAFLD severity (20, 21); besides, GGT is the only independent predictor of fatty liver compared to other liver enzymes, such as ALT and AST (13).
In addition, TG is significantly associated with NAFLD compared with LDL and HDL, and thus, it is an independent predictor of NAFLD (22).
The optimal cut-off point of FLI was 26.2 in the present study, which it is lower than the cut-off values proposed by Bedogni et al. Perhaps the more central adiposity in Asian populations compared to Western populations can explain this lower cut-off values of FLI (23). Also, the cut-off values of FLI in our study were lower than the cut-off values proposed by Xiaolin and Motamed in China and Iran populations, respectively (11, 20).
The diagnosis method of NAFLD in these studies is US, which based on the results of previous studies, cannot detect small amounts of liver steatosis, however, the diagnosis method of the present study (CAP) is able to satisfactorily differentiate between the different grades of steatosis and identify steatosis even at early stages (> 11%) (9, 10, 24). Thus, the cut-off values of FLI in our study were lower than that of the previous studies.
Similar to other studies, the optimal cut-off points of FLI were different in the 2 sexes. According to our results, the optimal cut-off points of FLI in males were higher than in females, which was in line with Bi-Ling Yang study results (25).
In contrast with our study, Motamed et al. suggested higher cut-off values of FLI for females because of the protective effect of estrogen in females (11).
The AUC of FLI in our study was higher than TG, GGT, and BMI, and the AUC of FLI was almost similar to the AUC of WC, but in some studies it has been demonstrated that the AUC of FLI is larger than its individual components even WC. However, in the study of Motamed et al., similar to our study, the AUC of FLI was almost similar to WC (25). This can be due to abdominal fat, and so WC is an important factor in predicting NAFLD (26).
Liver fibrosis is a part of the NAFLD spectrum and is caused by NASH and can lead to cirrhosis, and even hepatocellular carcinoma (27, 28). Chronic damage of liver leads to aggregation of extracellular matrix proteins (ECM) in liver, causing liver fibrosis (29).
There are some scoring systems for predicting liver fibrosis, such as NAFIC score, NAFLD fibrosis score, and FIB 4 (15).
Although FLI is an index for prediction of liver steatosis, we found a strong positive association between FLI and liver fibrosis measured by FibroScan.
This relationship can be explained as follows: NASH is associated with obesity, Type 2 diabetes mellitus, insulin resistance, and dyslipidemia, and thus it is associated with individual components of FLI (29).
Small sample size was the limitation of our study, but using transient elastography (TE) to detect liver steatosis and fibrosis was the strong point of our study, which diminishes the sampling error compared to US.
5. Conclusions
Fatty liver index (FLI) is a suitable and simple predictor for liver steatosis. However, according to our results, the performance of FLI in predicting NAFLD was not more effective than waist circumference, so modifying the FLI formula based on Iran population is necessary. Although FLI is a predictor for liver steatosis, it has a positive association with liver fibrosis and perhaps it can predict liver fibrosis too.