
1. Background
Non-alcoholic fatty liver disease (NAFLD) is characterized by the excessive accumulation of fat in liver cells (more than 5% of the liver), which occurs with abnormal fat metabolism in the liver for non-alcoholic reasons. Non-alcoholic fatty liver disease is defined as the presence of steatosis in the liver without liver damage (1). When cirrhosis develops in these patients, the risk of hepatocellular carcinoma and death increases several times (2). Although disorders of triglyceride metabolism and HOMA-IR have been proven to be critical in the development of NAFLD, the pathogenesis of NAFLD is not fully understood, and current treatment strategies are by no means satisfactory (3). The obesity epidemic and the urgent need for effective treatments for obesity-related metabolic diseases have increased interest in research into fibroblast growth factors (FGFs) that play a key role in energy metabolism. Fibroblast growth factor-21 (FGF-21) is a member of the signaling protein family of 22 factors that exert their effects through the activation of the FGF receptor family (FGFR). FGF-21 has been implicated in controlling cell survival, tissue repair, energy homeostasis, and glucose and lipid metabolism, whose protective effects against obesity, type 2 diabetes, and liver steatosis have been demonstrated (4). High levels of circulating FGF-21 and increased expression of hepatic FGF-21 mRNA in obese, type 2 diabetes, and NAFLD patients have been reported in both animal and human models. In fact, NAFLD creates a state of resistance to FGF-21, which causes the level of serum FGF-21 to be different in healthy people and this group of patients (5). Members of the Klotho membrane protein family also act as obligate co-receptors for FGFRs and are required to bind FGFs to their specific receptor. In fact, the binding of FGF-21 to its specific FGFR and its common binding receptor, βklotho (BKL), in the liver and adipose tissues activates intracellular signaling pathways and cellular kinases, including extracellular signal-regulated kinases (ERK) and glycogen synthetase kinase (GSK) to modulate the metabolic functions of these hormones. It can be stated that no specific drug treatment for NAFLD has been proven so far, and lifestyle and physical activity changes have recently been the main suggestion for those with NAFLD. Lifestyle intervention in the form of reducing calorie intake and increasing the level of physical activity, with the aim of losing weight, is the mainstay of treatment for NAFLD patients. Decreased hepatic steatosis in patients with NAFLD due to resistance and aerobic exercise has been reported in various articles, and it is believed that exercise reduces intrahepatic triglyceride (TG) accumulation, improves insulin sensitivity, and reduces oxidative stress (6). Cuevas-Ramos et al. (2012) examined serum biochemical factors before and after two weeks of endurance training (on a treadmill) performed five days a week. FGF-21 values were significantly increased after two weeks of endurance activity. This increase was positively associated with adrenergic and lipolytic responses to physical activity (7). In another study, Takahashi et al. (2020) examined the effect of a simple resistance training session on the growth factor levels of FGF-21 and cytokeratin 18 (CK18) in men with NAFLD. The results of this study showed a significant decrease in the levels of FGF-21 and CK18 in this group of patients (5). In addition, Matsubara et al. (2014) revealed that aerobic exercise (12 weeks of moderate intensity) in women increased BKL levels and diminished arterial stiffness (8).
2. Objectives
BKL and FGF-21 play a key role in controlling liver metabolism, and fibroblast growth factor resistance is an issue that has been raised in recent years. However, no research has focused on the effects of moderate-intensity endurance training and resistance training on BKL and FGF-21 levels in patients with NAFLD and type 2 diabetes. Therefore, the present study aims to investigate the effect of eight weeks of moderate-intensity endurance and resistance training on the serum levels of BKL and FGF-21 in these patients.
3. Methods
3.1. Participants and Study Design
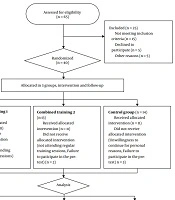
As detailed in Figure 1, the statistical population included 100 women with type 2 diabetes (age: 45 to 65 years) selected from the diabetes center of Kermanshah, Iran. Then, 45 patients were participated based on inclusion and exclusion criteria. The inclusion criteria included having a history of diabetes for at least six years, body mass index (BMI) from 25 to 36 kg/m2, glycemic index between 120 and 150 mg/dL, glycosylated hemoglobin (HbA1c) between 6.5 and 9%, and having grade 2 or 3 fatty liver (via ultrasonography). The subjects did not have a history of regular exercise or use insulin. Metformin was the only diabetes drug that the patients were allowed to take. The exclusion criteria included any known genetic disease, endocrine disease, advanced complications of diabetes, hepatitis C and B or autoimmunity, hemochromatosis or liver-related diseases, cardiopulmonary diseases, drug and alcohol use, and unwillingness to participate in the study (9).
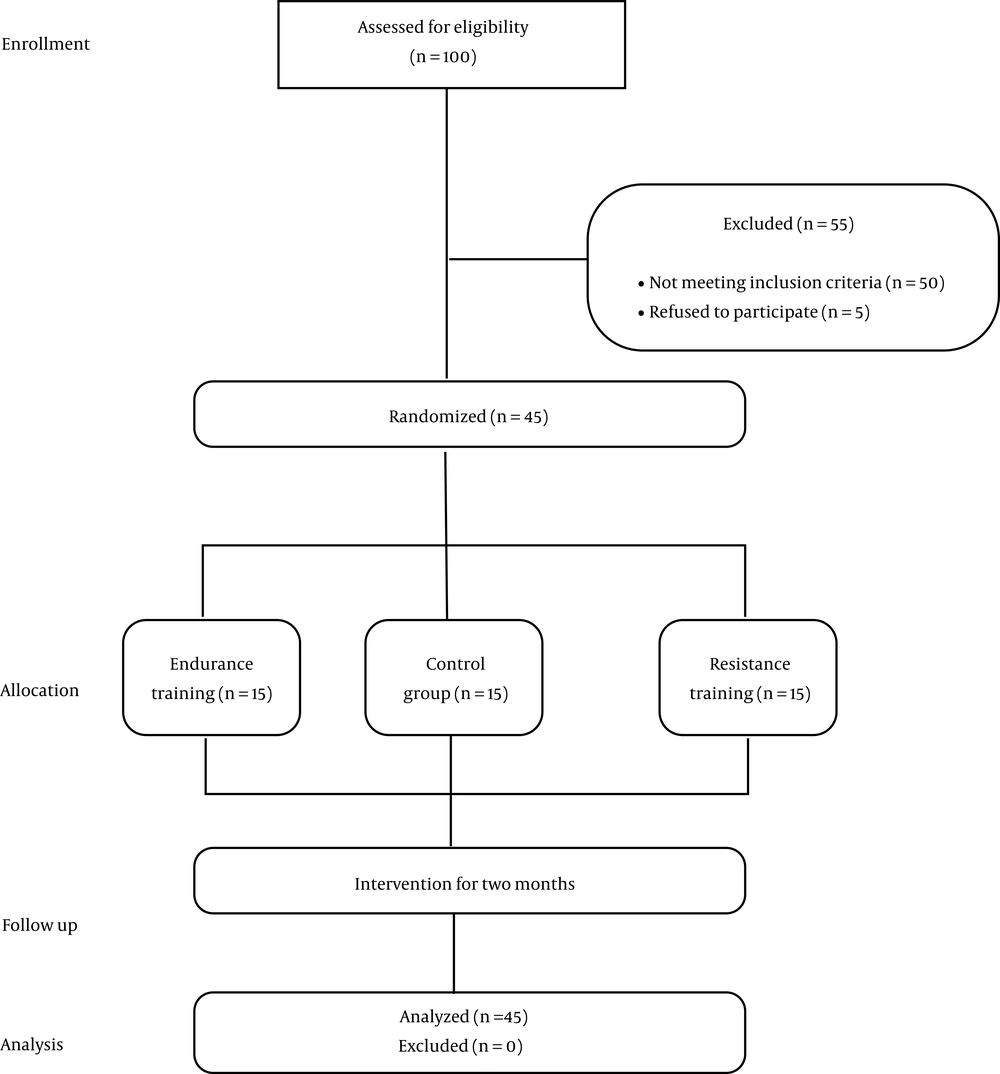
Figure 1.
Diagram of progress through the phases of the parallel randomized trial of the three groups (enrolment, allocation, follow-up, and data analysis)
The subjects were divided into the three groups of endurance training (n = 15), resistance training (n = 15), and control group (n = 15) by using simple randomization. This study was approved by the Ethics Committee in Biomedical Research of Razi University (code of ethics: IR.RAZI.REC.1398.009-014).
3.2. Anthropometric and Biochemical Measurements
Weight and body mass index of diabetics were measured by body composition analyzer (model Inbody 570, made in Korea). Body fat percentage (BFP) was measured by the three-point method (arms, thighs, and suprailiacus) using a Harpanden metal caliper (with an accuracy of 0.05 mm) and calculated by Jackson and Pollack formulas (10). To calculate the waist to hip ratio (WHR), waist circumference at the midpoint between the iliac crest and the lower rib margin and pelvic circumference (cm) at the point of maximum gluteal bulge were measured from the lateral view. The subjects were introduced to the laboratory and radiology center before and after the training interventions for the analysis of blood factors and ultrasonography. Serum fasting blood sugar level was analyzed using a bionic diagnostic kit (made in Iran) with a Bray-480 Mindray analyzer and insulin applying a US-made Monobind ELISA kit. Also, Equation 1 was used to calculate the homeostatic model assessment for insulin resistance (HOMA-IR) index (11).
About 10 mL of peripheral blood was taken to measure the level of FGF-21 and BKL. Blood samples were taken from the subjects after 12 to 14 hours of fasting and in two stages before and after eight weeks (48 hours after the last training session). Blood samples were stored at -80°C after centrifugation and separation of serum until ELISA tests were performed. To prevent the effect of circadian rhythm, blood sampling was performed from 8 to 9 in the morning. The subjects were asked to refrain from strenuous physical activity for 48 hours prior to blood sampling. The serum levels of biochemical markers of FGF-21 and BKL were measured using commercial kits by the ELISA method. EASTBIOPHARM ELISA kit (Cat.No:CK-E90122 made in Germany) and EASTBIOPHARM ELISA kit (Cat.No:CK-E91518 made in Germany) were used to measure the serum levels of FGF-21 and BKL, respectively.
3.3. Training Protocols
The endurance training program consisted of 24 sessions (eight weeks and three sessions per week) of running around the track with an intensity of 60 - 75% of the target heart rate (THR), which was calculated using the Caronen formula (Equation 2) (12-14). The heart rate of the subjects was monitored during the training program by a Beurer pulse digital monitoring (made in Germany, model PM80). According to the training program, the duration and intensity of training in the first week was 30 minutes and 60%, respectively. Each week, the training time and intensity were increased until the training time reached 45 minutes and 75% in the eighth week (Table 1).
Table 1.
Two Training Programs (Endurance and Strength Training) After Eight Weeks
| Training Programs | Weeks of Training | |||||||
|---|---|---|---|---|---|---|---|---|
| First | Second | Third | Fourth | Fifth | Sixth | Seventh | Eighth | |
| Endurance training | ||||||||
| Intensity (HRR), % | 60 | 60 | 65 | 60 | 65 | 70 | 70 | 75 |
| Duration (min) | 30 | 35 | 40 | 35 | 40 | 45 | 40 | 45 |
| Strength training | ||||||||
| Intensity (1RM), % | 50 | 50 | 60 | 50 | 60 | 70 | 60 | 70 |
| SET | 2 | 3 | 3 | 3 | 3 | 3 | 3 | 3 |
| Repetition | 16 | 16 | 14 | 16 | 14 | 10 | 14 | 10 |
| Rest (min) | 1 - 3 | 1 - 3 | 1 - 3 | 1 - 3 | 1 - 3 | 1 - 3 | 1 - 3 | 1 - 3 |
Abbreviations: HRR, heart rate reserve; 1RM, one repetition maximum; min, minute.
The resistance training program consisted of 24 sessions of selected resistance exercises during eight weeks. The participants performed eight different exercises, including large muscle groups, on the machines (12-14). These movements included bench press, barbell curl, lying triceps press, lat pull down, leg press, leg extension, lying leg curl, and standing calf raise. Each training session comprised a warm-up phase for five minutes, a resistance training phase in the form of three sets (50 - 70% of one maximum repetition (1RM), 10 - 16 repetitions) for 35 to 50 minutes, and finally, a cool-down phase for five minutes. Brzycki Equation 3 was used to measure 1RM.
According to the training program, the duration and intensity of training in the first week was 45 minutes and 50%, respectively. Each week, training time and intensity were increased until the training time reached 60 minutes and 70%, respectively, in the eighth week (Table 1). The subjects in the control group were asked to only do their normal daily activities and avoid doing any sports activities during the program.
3.4. Statistical Analysis
Descriptive statistical methods were applied to describe the mean and standard deviation of the data. The normality of data distribution was estimated using the Shapiro-Wilk test. Two-way analysis of variance with repeated measures was used to compare the means of the data. Moreover, one-way ANOVA was used to compare the data changes in pre-test and post-test (Delta ∆). Bonferroni and Tukey’s post hoc tests were run to compare the pair differences. Calculations were performed using SPSS, version 21, and the significance level of the tests was set at P < 0.05.
4. Results
4.1. Body Composition, Lipid Profiles, and HOMA-IR Index Results
Two-way ANOVA test with repeated measurements comparing the effect of time using Bonferroni post hoc test showed no significant difference between pre-test and post-test in terms of weight, fat percentage, BMI, WHR, glucose, HOMA-IR index, low density lipoprotein (LDL), total cholesterol (TC), TG, and fatty liver grade in the control group (P > 0.05), while insulin and high density lipoprotein (HDL) were significantly different in the control group (P < 0.05; Table 2). Besides, except HDL (P = 0.17) in the strength training group, all the other variables were significantly different in pre-test and post-test comparison in both training groups (P < 0.05; Table 2).
Table 2.
Changes in the Variables During Eight-Week Control and Training Periods
| Variables | Control (Mean ± SD) | Endurance Training (Mean ± SD) | Strength Training (Mean ± SD) | Pa | ηb | ||||||
|---|---|---|---|---|---|---|---|---|---|---|---|
| Pre | Post | ∆ | Pre | Post | ∆ | Pre | Post | ∆ | |||
| Weight (kg) | 75.3 ± 8 | 75.8 ± 8 | 0.5 | 75.4 ± 9 | 73.1 ± 9 | 2.3 c, d | 77.4 ± 9 | 76.6 ± 9 | 0.8 c, d, e | 0.001 | 0.58 |
| BMI (kg/ m2) | 30.2 ± 3 | 30.5 ± 3 | 0.3 | 30.1 ± 2.9 | 29.3 ± 2.9 | 0.8 c, d | 30.9 ± 3.6 | 30.2 ± 3.7 | 0.7 c, d | 0.006 | 0.16 |
| Body fat (%) | 31.6 ± 3 | 31.7 ± 3 | 0.1 | 30.6 ± 3 | 29 ± 3 | 1.6 c, d | 33.9 ± 3 | 33.2 ± 3 | 0.7 c, d, e | 0.001 | 0.39 |
| WHR (m) | 0.95 ± 0.05 | 0.96 ± 0.06 | 0.01 | 0.96 ± 0.06 | 0.88 ± 0.06 | 0.08c, d | 0.99 ± 0.05 | 0.95 ± 0.04 | 0.04c, e | 0.012 | 0.37 |
| Glucose (mg/dL) | 140 ± 20 | 141 ± 25 | 1 | 150 ± 24 | 129 ± 17 | 31c, d | 135 ± 7 | 122 ± 8 | 13c, d | 0.001 | 0.20 |
| Insulin (µU/mL) | 14.05 ± 4 | 15.5 ± 4 | 1.45c | 9.6 ± 1 | 6.8 ± 1.4 | 2.8c, d | 16.9 ± 4 | 13.7 ± 3 | 3.2c, d | 0.001 | 0.59 |
| HOMA-IR | 4.7 ± 1.5 | 5.1 ± 1.7 | 0.4 | 3.5 ± 0.2 | 2.2 ± 0.6 | 1.3c, d | 5.6 ± 2.8 | 4.2 ± 2.3 | 1.4c, d | 0.002 | 0.40 |
| LDL (mg/dL) | 90 ± 11 | 92 ± 10 | 3 | 101 ± 20 | 88 ± 21 | 13c, d | 89 ± 8 | 72 ± 9 | 17c, d | 0.001 | 0.60 |
| HDL (mg/dL) | 43 ± 10 | 39 ± 8 | 4c | 45 ± 7 | 45 ± 9 | 0.0, d | 43 ± 6 | 43 ± 7 | 0.0 | 0.002 | 0.19 |
| TC (mg/dL) | 168 ± 14 | 170 ± 13 | 2 | 172 ± 28 | 160 ± 29 | 12c, d | 167 ± 5 | 148 ± 6c, d, e | 19 | 0.001 | 0.68 |
| TG (mg/dL) | 171 ± 33 | 173 ± 34 | 2 | 158 ± 56 | 130 ± 38 | 28c, d | 175 ± 7 | 158 ± 6 | 17c, d | 0.002 | 0.48 |
| Fatty liver (grade) | 2.2 ± 0.4 | 2.3 ± 0.5 | 0.1 | 2.1 ± 0.3 | 1.7 ± 0.4 | 0.4c, d | 2.3 ± 0.4 | 2.0 ± 0.5 | 19c, d | 0.001 | 0.68 |
Abbreviations: BMI, body mass index; WHR, waist to hip ratio; HOMA-IR, homeostatic model assessment for insulin resistance; LDL, low density lipoprotein; HDL, high density lipoprotein; TC, total cholesterol; TG, triglyceride.
a P-values calculated using two-way analysis of variance followed with Bonferroni post-hoc test.
b η effect size of training protocols.
c Significant difference compared with pre-test (P < 0.05).
d Significant difference compared with the control group (∆) (P < 0.05).
e Significant difference compared with endurance training.
Furthermore, comparison of the interaction effect of group and time using two-way ANOVA test indicated a significant difference between the control and exercise groups in the variables of weight, body fat percentage, BMI, WHR, glucose, insulin, HOMA-IR index, LDL, HDL, TC, TG, and fatty liver grade (P < 0.05; Table 2) . Also, comparison of delta changes (pre-test and post-test changes) by independent one-way ANOVA test showed a significant difference between the control and exercise groups in the variables of weight, BMI, WHR, body fat percentage, glucose, insulin, HOMA-IR index, LDL, HDL, TC, TG, and fatty liver grade (Table 2; P < 0.05). Moreover, Tukey’s post hoc test revealed a significant difference between the endurance and resistance training groups in terms of weight, fat percentage, WHR, and TC (P < 0.05; Table 2).
4.2. Liver Enzymes, BKL, and FGF-21 Results
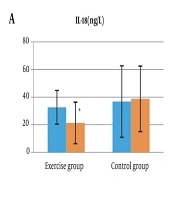
The results also showed a significant difference between pre-test and post-test in aspartate transaminase (AST), alanine transaminase (ALT), BKL, and FGF-21 in control and training groups (P < 0.05; Figure 2). Furthermore, comparison of the interaction effect of group and time using two-way ANOVA test indicated a significant difference between the control group and exercise groups in the of variables AST, ALT, FGF-21, and BKL (P < 0.05; Figure 2). Also, comparison of delta changes (pre-test and post-test changes) by independent one-way ANOVA test exhibited a significant difference between the control and exercise groups in the variables of AST, ALT, FGF-21, and BKL (P < 0.05; Figure 2). Finally, Tukey’s post hoc test revealed that there was not a significant difference between the endurance and resistance training groups in terms of AST, ALT, FGF-21, and BKL (P > 0.05; Figure 2).
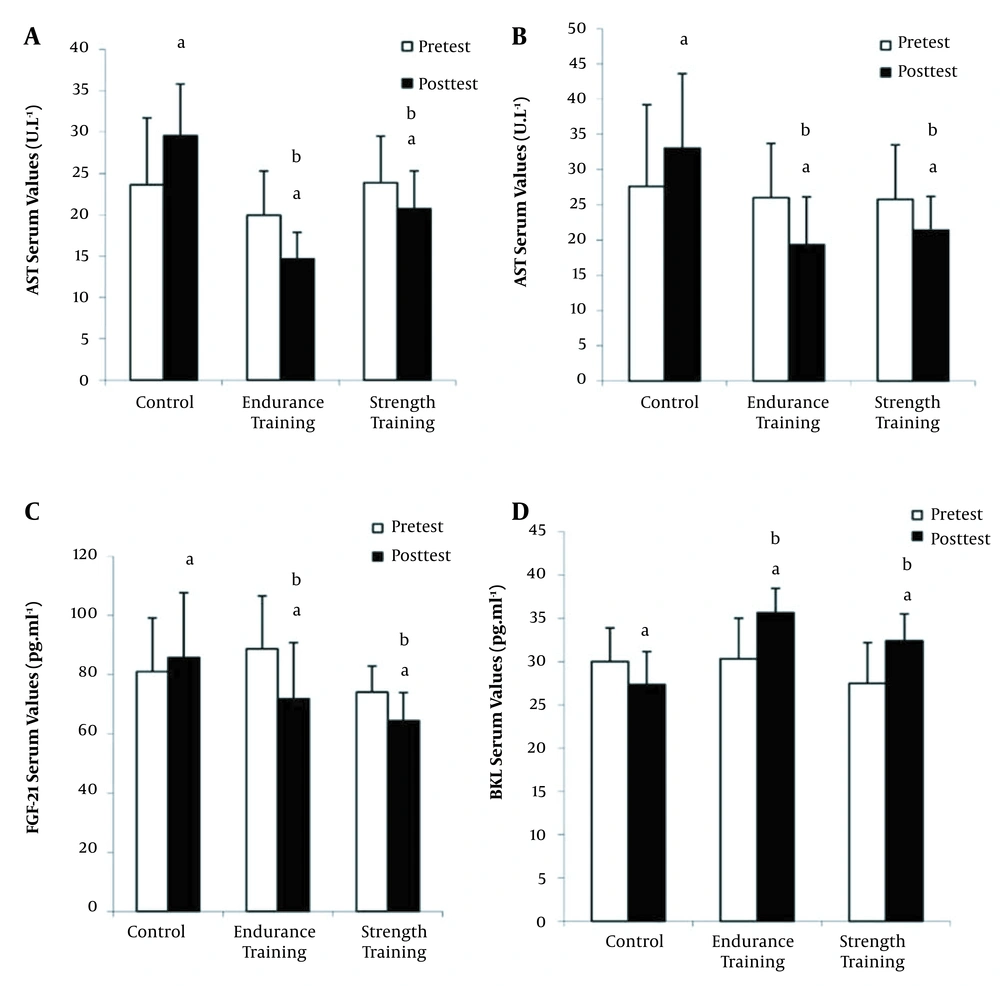
Figure 2.
Changes in the aminotransferase enzyme (AST), alanine aminotransferase enzyme (ALT), fibroblast growth factor-21 (FGF-21), and beta-klotho (BKL) serum levels of the studied groups (mean and standard deviation). a significant difference compared with pre-test (P < 0.05), b significant difference compared with the control group (∆) (P < 0.05).
5. Discussion
The current study aimed to compare the effects of endurance and resistance training with moderate intensity on BKL and FGF-21 proteins expression, some metabolic parameters, and body composition in type 2 diabetic women with NAFLD. The most essential finding was that performing eight weeks of endurance and resistance training improved metabolic parameters, such as glycemic index, HOMA-IR, and anthropometric index (weight, body composition, WHR, and Body fat percentage). Also, the serum level of FGF-21 decreased, and BKL increased in type 2 diabetic women with non-alcoholic fatty liver. Besides, there was no significant difference between the two training methods in improving these factors.
The results of the present study indicated improvement in body composition indices (i.e., weight, BMI, WHR, and body fat percentage) and fat profile (i.e., LDL, TG, and TC) after eight weeks of endurance and resistance training. Although HDL level increased significantly in the control group, it remained stable in the endurance and resistance training groups. In line with the present findings, Bacchi et al. (2013) reported a significant reduction in BMI and BFP after four months of resistance training (12). Lee et al. (2012), who studied the effect of aerobic training versus resistance training, reported no weight loss in obese men after both training methods (15). Yao et al. (2018) also reported a significant decline in TG and a significant rise in HDL after 22 weeks of aerobic and resistance training in NAFLD patients (16). Bacchi et al. (12) also observed a fall in blood TG level following four months of aerobic and resistance training, which was in line with the current findings. Therefore, it seems that endurance and resistance training can both reduce triglycerides, LDL, and cholesterol and increase HDL through increasing the activity of lipoprotein lipase (LPL) and lecithin cholesterol acyl transferase. In fact, increasing these enzymes can be responsible for increasing HDL and lowering LDL after endurance and resistance training (17). Although HDL levels in the training groups were not significantly different from pre-test in the present study, due to the decreased level of HDL in the control group in post-test, it can be concluded that these types of endurance and resistance training modulated HDL level in these patients. Also, the difference between the results of previous studies and the current results can be due to the implementation of training protocols with different intensities and durations and differences in the characteristics of the subjects.
In addition, the results showed that in the control group, the levels of AST and ALT increased in the post-test, which indicates the development of NAFLD, metabolic syndrome, and diabetes. On the other hand, the levels of AST and ALT enzymes in the post-test in the endurance and resistance training groups were significantly reduced, which shows that endurance and resistance training protocols moderated NAFLD conditions in these patients, although no significant difference was observed between the two training groups in these variables. Serum AST and ALT levels decreased by 25% and 26% in the endurance training group and by 13% and 16% in the resistance group, respectively. Consistent with the findings of the current study, Davoodi et al. (2012) observed that after eight weeks of aerobic training, ALT and AST values were significantly reduced compared to the control group (18). However, Houghton et al. (2017) did not observe a significant change in liver enzymes in NAFLD patients after 12 weeks of combined training. It seems that endurance and resistance training reduce the levels of ALT and AST enzymes by increasing oxidation and reducing fat synthesis, inflammatory factors, and liver cell damage (19).
Elevated insulin and FGF-21levels and decreased serum BKL levels in the control group in post-test indicated that non-alcoholic fatty liver disease reduced insulin receptor sensitivity leading to the increase in insulin levels. Furthermore, decreased BKL protein expression in diabetic patients with fatty liver indicates that molecular signals inhibit BKL expression in these patients. Besides, the increase in FGF-21 level in the post-test in the control group was probably due to the fact that metabolic disorders impair the expression of BKL in target tissues leading to a reduction in sensitivity to fibroblast growth factors. The results of the present study indicated the improvement of glycemic index, HOMA-IR, an increase in serum the level of BKL, and a decline in the serum level of FGF-21 in the endurance and resistance training groups (20). BKL levels increased by 16% and 18% in the endurance and resistance training groups, respectively. Also, the serum levels of FGF-21 decreased by 19% and 13% in the endurance and resistance training groups, respectively. Consistent with our results, Takahashi et al. showed a decrease in the serum levels of cytokeratin 18 (C18) and FGF-21 in men with non-alcoholic fatty liver following 12 weeks of simple resistance training (5).
Conducting two separate studies, Taniguchi et al. (2016) also revealed that both acute exercise and a period of endurance training reduced the serum level of FGF-21 24 hours after exercise. Since muscle contraction activates the PI3K/Akt signaling pathway, which results in the production of fibroblast growth factor-21, the increased serum fibroblast growth factor-21 level may not be detectable immediately after exercise. In fact, the upregulation of FGF-21 occurs based on the activation of the PI3K/Akt signaling pathway in skeletal muscles by insulin (14, 21). In fact, moderate-intensity long-term endurance training has been reported to regulate liver fat content and AMPK/SIRT1 signaling pathway, thereby improving fibroblast growth factor-21 resistance, which may result from the increased expression of fibroblast growth factor-21 receptors (22, 23). Consistent with the results of our study, Xiong et al. (2020) suggested that eight weeks of moderate-intensity training and high-intensity interval training increased the expression of BKL gene in various tissues (i.e., liver, brown adipose tissue, and skeletal muscles) in two groups of obese mice; however, this growth was greater in the moderate intensity training group (24).
Therefore, the results of the present study proved that endurance and resistance training with moderate intensity and duration can reduce the effects of NAFLD, and no difference was detected between these two training methods in improving body composition indices, reducing liver fat content, inducing hepatic fat oxidation, or improving insulin sensitivity. These types of exercises should be performed with moderate intensity so that patients are protected from the side effects of high-intensity exercise, including muscle and joint injuries. It seems that both endurance and resistance training methods reduce weight and improve body composition, fat percentage, and insulin resistance by increasing energy expenditure. Obviously, the more time is devoted to these exercises, the greater the adaptation; otherwise, the effects of such exercises will be reversible in a short time (13).
5.1. Strengths and Limitations of the Study
The use of endurance and resistance training programs with the intensities of 60 - 75% maximum heart rate and 50 - 70% (1RM), respectively, is the strength of this study. The small sample size due to the lack of available subjects was one of the limitations of this study. Therefore, we suggest further similar studies with larger sample sizes. The training period was also another limitation that could have affected the results. The use of ultrasonography to diagnose fatty liver was also another limitation. Finally, we used self-reported data regarding non-exercise physical activity and diet, which might have influenced the results.
5.2. Conclusions
In sum, it can be stated that performing eight weeks of endurance and resistance training with moderate intensity can upturn the serum levels of BKL and decrease the serum level of FGF-21. Also, metabolic parameters, such as glycemic index, HOMA-IR, and body composition index, improved in type 2 diabetic women with non-alcoholic fatty liver disease. Besides, there was no difference between these two training methods. The findings suggest that both endurance and resistance training methods can play an essential role in improving the conditions of this group of patients by compensating for the destructive effects of type 2 diabetes and non-alcoholic fatty liver.