


1. Background
2. Objectives
3. Methods

Consort 2012 flow diagram
3.1. Exercise Training Protocols
| Variables | Pretest | Posttest | P Value Within Group | F | P Value Between Groups |
|---|---|---|---|---|---|
| Apelin (pg/mL) | 0.511 | 0.12 | |||
| HIIT | 256.65 ± 25.12 | 279.12 ± 50.08 | 0.13 | ||
| Combined training | 286.56 ± 42.12 | 266.26± 56.00 | 0.09 | ||
| Control | 302.44 ± 38.03 | 312.23 ± 63.03 | 0.732 | ||
| MCP-1 (pg/mL) | 5.011 | 0.009b | |||
| HIIT | 260.14 ± 20.14 | 190.26 ± 15.12 | 0.001b | ||
| Combined training | 251.20 ± 15.26 | 212.74 ± 19.95 | 0.045c | ||
| Control | 263.78 ± 32.12 | 266.11 ± 12.20 | 0.562 | ||
| IL-6 (pg/mL) | 5.511 | 0.008b | |||
| HIIT | 1.89 ± 0.95 | 1.21 ± 1.11 | 0.009b | ||
| Combined training | 2.03 ± 1.08 | 1.50 ± 1.32 | 0.019b | ||
| Control | 2.12 ± 1.24 | 1.88 ± 2.01 | 0.261 |
Abbreviations: Combined training, resistance and aerobic training; control group, subjects not participating in exercise training; HIIT, high-intensity interval training; MCP-1, monocyte chemoattractant protein-1.
a Values are expressed as mean ± SD.
b Significant difference P < 0.01.
c Significant difference between P < 0.05.
3.2. High-Intensity Interval Training
3.3. Anthropometric Measures
| Variables | Pretest | Posttest | P Value Within Group | P Value Between Groups |
|---|---|---|---|---|
| Body mass (kg) | 0.017b | |||
| HIIT | 73.06 ± 21.62 | 77.00 ± 12.34 | 0.005c | |
| Combined training | 76.30 ± 9.58 | 75.55 ± 9.23 | 0.003c | |
| Control | 71.44 ± 13.20 | 71.26 ± 13.06 | 0.000c | |
| BMI (kg/m2) | 0.023b | |||
| HIIT | 29.57 ± 2.77 | 28.97 ± 3.39 | 0.005c | |
| Combined training | 30.57 ± 2.97 | 31.58 ± 8.61 | 0.003c | |
| Control | 29.70 ± 4.17 | 29.13 ± 4.41 | 0.42 | |
| Body fat (%) | 0.08 | |||
| HIIT | 42.64 ± 2.23 | 41.14 ± 4.34 | 0.000c | |
| Combined training | 31.32 ± 4.63 | 27.99 ± 2.36 | 0.000c | |
| Control | 43.92 ± 2.49 | 42.64 ± 4.95 | 0.08 | |
| WHR | 0.006c | |||
| HIIT | 1.01 ± 0.13 | 0.93 ± 0.06 | 0.000 c | |
| Combined training | 1.01 ± 0.25 | 0.97 ± 0.07 | 0.008c | |
| Control | 1.01 ± 0.018 | 0.98 ± 0.07 | 0.22 |
Abbreviations: BMI, body mass index; combined training, resistance and aerobic training; control group, subjects not participating in exercise training; HIIT, high-intensity interval training; WHR: circumference waist to hip ratio.
a Values are expressed as mean ± SD.
b Significant difference between two groups (P < 0.05).
c Significant difference between two groups (P < 0.01).
3.4. Blood Analysis
| Variables | Pretest | Posttest | P Value Within Group | F | P Value Between Groups |
|---|---|---|---|---|---|
| FFA (µmol/L) | 0.813 | 0.451 | |||
| HIIT | 560.56 ± 90.56 | 542.52 ± 86.48 | 0.12 | ||
| Combined training | 600.71 ± 73.52 | 589.50 ± 80.14 | 0.09 | ||
| Control | 555.14 ± 86.19 | 539.54 ± 89.11 | 0.231 | ||
| FBG (mg/dL) | 1.853 | 0.171 | |||
| HIIT | 210.07 ± 32.90 | 147.92 ± 41.17 | 0.000b | ||
| Combined training | 216.00 ± 63.08 | 163.85 ± 71.47 | 0.062 | ||
| Control | 177.28 ± 47.09 | 183.28 ± 60.70 | 0.690 | ||
| Serum insulin (μU/mL) | 3.622 | 0.036c | |||
| HIIT | 7.72 ± 2.63 | 4.97 ± 1.30 | 0.000b | ||
| Combined training | 9.10 ± 2.62 | 5.93 ± 2.24 | 0.000b | ||
| Control | 6.57 ± 2.06 | 6.21 ± 2.06 | 0.08 | ||
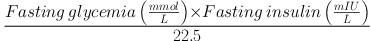
| HOMA-IR | 5.511 | 0.008b | |||
| HIIT | 98.33 ± 3.08 | 93.44 ± 3.03 | 0.000b | ||
| Combined training | 95.40 ± 3.08 | 92.50 ± 3.18 | 0.000b | ||
| Control | 97.44 ± 4.36 | 97.00 ± 4.53 | 0.732 |
Abbreviations: Combined training, resistance and aerobic training; control group, subjects not participating in exercise training; FBG, fasting blood glucose, HIIT: high-intensity interval training; HOMA-IR, homeostasis model assessment.
a Values are expressed as mean ± SD.
b Significant difference P < 0.01.
c Significant difference between groups P < 0.05.


