1. Background
Hepatitis B virus (HBV) infection is a global public health problem, with a worldwide prevalence of 3.9% in 2016 (1). Chronic HBV infection is highly associated with the risk of developing liver cirrhosis (LC), hepatocellular carcinoma (HCC), acute-on-chronic liver failure (ACLF), and even death. However, the progression of chronic HBV infection is always asymptomatic, especially in the early stage of LC and HCC (2). Therefore, convenient and effective biomarkers might be useful for early identification and control of the disease.
Child-Turcotte Pugh (CTP) score and model of end-stage liver disease (MELD) score are two classical scores to evaluate the severity of liver diseases. However, they have some disadvantages. CTP score is calculated based on five variables: hepatic encephalopathy, ascites, international normalized ratio (INR), serum albumin (ALB), and total bilirubin (TBil). Nonetheless, the fatal conditions, such as hepatorenal syndrome, are not included, and the degrees of hepatic encephalopathy and ascites are estimated subjectively. Moreover, it may not be suitable to evaluate the short-term prognosis in patients with end-stage liver disease (ESLD) (3). MELD score employs four parameters: (1) INR, (2) serum creatinine (Scr), (3) TBil, and (4) the etiology, but it does not include some life-threatening conditions. In some studies, it was not superior in predicting survival or the need for liver transplantation in patients with ESLD (4). On the other hand, the early diagnosis of HCC is one of the challenges in the clinic. The widely used marker is alpha-fetoprotein (AFP), while the limited sensitivity and specificity confined its usage (5).
Secreted frizzled-related proteins (sFRPs) are the antagonists of the Wingless-type (Wnt) signaling pathway, which are involved in the negative regulation of carcinogenesis. sFRP4 is a member of the sFRP family, and its suppression was recognized as one mechanism in the development of several cancer types (6-8). Recently, it was observed that the serum sFRP4 levels were elevated in HCC patients, suggesting that it can be served as a candidate marker for diagnosing HCC (9). However, little is known about its role in different stages of chronic HBV infection.
2. Objectives
We performed a cross-sectional study to assess the clinical value of plasma sFRP4 levels in the different stages of chronic HBV infection and validate its HCC diagnostic value.
3. Methods
3.1. Study Design
This cross-sectional study was carried out from October 2016 to July 2018 in HwaMei Hospital, University of Chinese Academy of Science. All participants signed their informed consent, and the study was approved by the institution’s Ethics Committee (certificate No.: PJ-NBEY-KY-2020-071-01). Clinical data of the participants were achieved from the electronic medical records (EMRs). General laboratory parameters were measured by automatic instruments on admission. Meanwhile, the plasma used to test sFRP4 levels was collected. All experiments were performed in accordance with the relevant guidelines and regulations.
3.2. Patient Selection
Patients with chronic HBV infection who were admitted to HwaMei Hospital, University of Chinese Academy of Science from October 2016 to July 2018, and a group of healthy controls (HCs) were recruited in this study. All patients were infected by HBV for six months or longer, and their hepatitis B surface antigen (HBsAg) and/or HBV DNA could be detected. They were grouped into the chronic hepatitis B (CHB), LC, ACLF, and HCC groups according to the Guideline of Prevention and Treatment for Chronic Hepatitis B (2015 Update) (10), the Guideline for Diagnosis and Treatment of Liver Failure (2018 Edition) (11), and the Guidelines for Diagnosis and Treatment of Primary Liver Cancer in China (2017 Edition) (12).
Briefly, patients in the CHB group were characterized by repeated or sustained abnormality in alanine aminotransferase (ALT) level or necroinflammatory features evidenced by liver biopsy. Those in the LC group had histological or clinical evidence of LC, which was diagnosed by hepatic biopsy, imaging examination, or clinical symptoms of portal hypertension, including thrombocytopenia, splenomegaly, or esophageal varices, and abnormal hepatic biochemical tests. Cases in the HCC group were diagnosed by imaging or pathological examinations and receiving no anti-tumor therapies. Patients who had acute and severe hepatic insults based on chronic liver diseases were classified into the ACLF group. Based on the outcome 90 days after admission, patients in the ACLF group were divided into the improved and deteriorated groups (11). Patients in the improved group met the following criteria: (1) the clinical symptoms, such as fatigue, anorexia, bloating, oliguria, and bleeding, alleviated obviously and disappeared hepatic encephalopathy; (2) significant improvement of clinical signs, such as jaundice and ascites; and (3) amelioration of the liver function indices [TBil < 5 × upper limit of normal (ULN), prothrombin activity (PTA) > 40%, or INR < 1.5]. Patients in the deteriorated group exhibited the following features: (1) clinical symptoms or signs became more advanced; (2) liver function indices worsened; (3) complicated with new complications/extrahepatic organ failure or the original complications deteriorated; and (4) death.
Patients who were co-infected with hepatitis A, C, D, and E viruses, cytomegalovirus, human papillomavirus, or human immunodeficiency virus combined with autoimmune hepatitis, nonalcoholic fatty liver disease, alcohol-related liver disease, and drug-induced hepatitis, other malignancies, those with missed data or those did not want to participate in this study were excluded.
3.3. Plasma sFRP4 Examination
Five milliliters of venous blood were drawn from the participants by clean venipuncture on admission, collected in an EDTA-K2 vacuum anticoagulation tube, and centrifuged at 1000 g for 5 minutes. The plasma was then harvested and stored immediately at -80°C. After collecting all participants’ plasma samples, they were melted to test sFRP4 quickly by the double-antibody sandwich enzyme-linked immunosorbent assay (ELISA) method (ExCell Bio, Shanghai, China).
3.4. Statistical Analysis
SPSS 22.0 software (IBM Corp. Armonk, NY, USA) was used for statistical analysis. The Shapiro-Wilk test was used to assess the normality of the distributed continuous variables. Normally distributed variables were expressed as mean ± standard deviation, and variables with skewed distribution were reported as the median and interquartile range (IQR). The differences between groups were tested by Kruskal-Wallis test or one-way analysis of variance (ANOVA) for continuous variables with skewed or normal distribution, followed by a post hoc comparison with the Nemenyi test or least significant difference (LSD) test. The Chi-square test was used for the comparison of categorical data among groups. The differences between the two groups were assessed by Mann-Whitney U test or Student’s t-test for continuous data with skewed or normal distribution, respectively. The spearman's rank correlation was used to reveal the correlation between two variables. Any parameters with P < 0.1 in the univariate logistic regression analysis were included in the multivariate logistic regression analysis to find out variables for diagnosing ALCF, and the receiver operating characteristic (ROC) curve was used to assess the differential diagnostic value of plasma sFRP4 levels.
4. Results
4.1. Demographic and Clinical Characteristics of Participants
A total of 339 patients with chronic HBV infection were recruited. Of these, one patient co-infected with hepatitis C, 10 patients combined with alcohol-related liver disease, 2 patients combined with autoimmune hepatitis, 4 patients combined with drug-induced hepatitis, 10 patients combined with nonalcoholic fatty liver disease, and 9 patients with missed data were excluded from this study. Finally, 303 patients and 30 HCs were enrolled. There were 54 cases in the CHB group, 85 cases in the LC group, 105 cases in the HCC group, and 59 cases in the ACLF group. The demographic and clinical characteristics of participants are presented in Table 1.
Table 1.
Demographic and Clinical Characteristics of the Participants a
| Variables | HC (n = 30) | CHB (n = 54) | LC (n = 85) | HCC (n = 105) | ACLF (n = 59) | P-Value |
|---|---|---|---|---|---|---|
| Gender, male (%) | 18 (60.0) | 36 (66.7) | 57 (67.1) | 88 (83.8) | 47 (80.0) | 0.012 |
| Age (y) | 44.00 (38.75 - 47.25) | 38.00 (29.75 - 50.00) | 53.50 (46.00 - 61.00) | 59.00 (50.00 - 66.50) | 46.00 (37.00 - 54.00) | < 0.001 |
| Body mass index (kg/m2) | 22.09 (20.36 -23.82) | 23.31 (21.39 - 24.93) | 21.91 (19.53 - 24.00) | 23.03 (20.72 - 24.71) | 23.53 (20.40 - 26.08) | 0.098 |
| Diabetes, No. (%) | 0 (0.0) | 1 (1.9) | 11 (12.9) | 14 (13.3) | 4 (6.8) | 0.077 |
| Hypertension, No. (%) | 0 (0.0) | 2 (3.7) | 11 (12.9) | 32 (30.5) | 5 (8.5) | < 0.001 |
| Child-Turcotte Pugh (A/B/C) | - | - | 35/31/19 | 78/27/0 | 0/16/43 | < 0.001 |
| MELD score | - | - | 8.40 (5.25 - 12.12) | 5.09 (2.56 - 7.02) | 19.65 (15.58 - 22.18) | < 0.001 |
| HBeAg-positive, No. (%) | - | 23 (42.6) | 16 (18.8) | 15 (14.3) | 15 (25.4) | < 0.001 |
| HBV DNA > 2 × 10⁴ (IU/mL), No. (%) | - | 28 (51.9) | 15 (17.6) | 17 (16.2) | 28 (47.5) | < 0.001 |
| Undergoing NUCs, No. (%) | - | 15 (27.8) | 63 (74.1) | 58 (55.2) | 33 (55.9) | < 0.001 |
| PT (s) | - | 12.5 (11.5 - 13.2) | 14.6 (13.0 - 18.3) | 13.1 (11.9 - 14.1) | 20.3 (16.5 - 25.3) | < 0.001 |
| TBil (mmol/L) | 10.9 (9.1 - 13.7) | 17.2 (10.5 - 36.5) | 25.2 (14.5 - 46.5) | 14.3 (10.2 - 24.2) | 215.7 (122.2 - 319.2) | < 0.001 |
| ALB (g/L), mean ± SD | 44.56 ± 1.73 | 40.71 ± 5.58 | 34.10 ± 6.97 | 39.29 ± 6.11 | 30.97 ± 5.28 | < 0.001 |
| AST (U/L) | 15.0 (12.0 - 18.0) | 148.0 (46.0 - 313.3) | 43.0 (27.5 - 68.5) | 40.0 (28.5 - 57.5) | 159.0 (60.0 - 396.0) | < 0.001 |
| ALT (U/L) | 16.0 (14.0 - 18.0) | 201.5 (73.8 - 531.5) | 28.0 (20.0 - 50.5) | 30.0 (22.0 - 46.5) | 145.0 (37.0 - 721.0) | < 0.001 |
| ALP (U/L) | 62.0 (55.0 - 70.5) | 100.0 (77.8 - 142.5) | 109.0 (81.5 - 137.5) | 100.0 (78.0 - 139.0) | 129.0 (96.0 - 152.0) | < 0.001 |
| GGT (U/L) | 18.0 (14.5 - 22.3) | 77.0 (46.5 - 152.8) | 39.0 (21.0 - 75.0) | 76.0 (38.5 - 171.0) | 92.0 (58.0 - 144.0) | < 0.001 |
| AFP (ng/mL) | 2.0 (1.375 - 3. 5) | 5.9 (3.4 - 20.7) | 5.3 (2.6 - 16.0) | 82.6 (9.6 - 2856.2) | 38.0 (6.0 - 187.6) | < 0.001 |
Abbreviations: HC, healthy control; CHB, chronic hepatitis B; LC, liver cirrhosis; HCC, hepatocellular carcinoma; ACLF, acute-on-chronic liver failure; Meld, model of end-stage liver disease HBeAg, hepatitis B e antigen; HBV, Hepatitis B virus; NUCs, nucleoside/nucleotide analogues; PT, prothrombin time; TBil, total bilirubin; ALB, albumin; AST, aspartate aminotransferase; ALT, alanine aminotransferase; ALP, alkaline phosphatase; GGT, gamma-glutamyl transferase; AFP, alpha-fetoprotein.
a Values are expressed as median (interquartile range) unless otherwise indicated.
4.2. Comparison of Plasma sFRP4 Levels in Different Groups
The plasma sFRP4 levels in the HC, CHB, LC, HCC, and ACLF groups were 5.27 (3.17 - 28.41) ng/mL, 10.34 (5.42 - 32.22) ng/mL, 18.86 (10.16 - 64.78) ng/mL, 19.05 (8.29 - 67.19) ng/mL, 103.76 (26.14 - 258.00) ng/mL, respectively. There was a significant difference between the investigated groups, evidenced by the Kruskal-Wallis test (χ2 = 72.73, P < 0.001). Post hoc comparison tests showed that plasma sFRP4 levels in the different stages of chronic HBV infection were all higher than that in the HC group (all P < 0.001), except for the CHB group (P = 0.262). In patients with chronic HBV infection, the ACLF group showed the highest plasma sFRP4 levels (all P < 0.001); followed by LC and HCC groups, and there was no significant difference between the LC and HCC groups (P = 0.95), but LC and HCC groups were found with up-regulated sFRP4 than the CHB group (all P < 0.05). The CHB group owned the lowest plasma sFRP4 levels (Figure 1A).
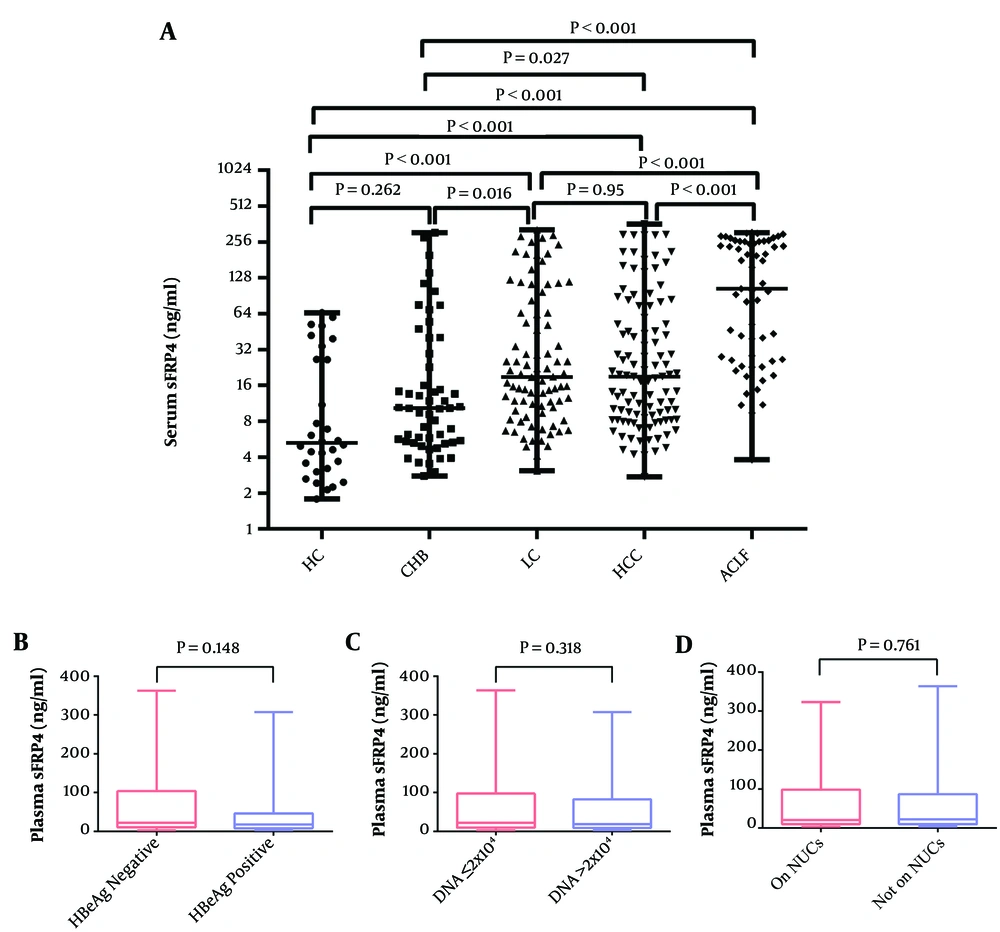
Figure 1.
The comparison of plasma sFRP4 in different groups. A, the plasma sFRP4 levels in the HC, CHB, LC, HCC, and ACLF groups; B, the plasma sFRP4 levels in HBeAg-positive and HBeAg-negative patients; C, the plasma sFRP4 levels in patients with HBV-DNA ≤ 2 × 10⁴ IU/mL and HBV-DNA > 2 × 10⁴ IU/mL; D, the plasma sFRP4 levels in patients with or without NUCs antiviral treatment (HC, healthy control; CHB, chronic hepatitis B; LC, liver cirrhosis; HCC, hepatocellular carcinoma; ACLF, acute-on-chronic liver failure; NUCs, nucleoside/nucleotide analogues).
Besides, the levels of plasma sFRP4 in patients with chronic HBV infection were not related to HBeAg status, HBV DNA loads, or whether they were undergoing antiviral on nucleoside/nucleotide analogues (NUCs) or not, which showed that there were no significant differences between HBeAg-positive and HBeAg-negative patients (P = 0.148) (Figure 1B), between patients with HBV-DNA ≤ 2 × 10⁴ IU/mL and HBV-DNA > 2 × 10⁴ IU/mL (P = 0.318) (Figure 1C), and between patients with or without NUC antiviral treatment (P = 0.761) (Figure 1D).
4.3. The Application Value of the Plasma sFRP4 Levels for Diagnosing ACLF and Predicting 3-Month Prognosis in ACLF Patients
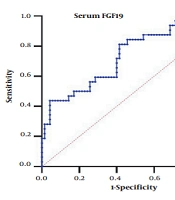
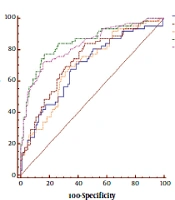
Patients with CHB and LC have a high risk to develop ACLF; therefore, we performed logistic regression analysis and ROC to assess the application value of plasma sFRP4 levels for diagnosing ACLF. According to univariate logistic regression analysis, HBV DNA > 2 × 10⁴, prothrombin time (PT), TBil, ALB, aspartate aminotransferase (AST), ALT, AFP, and sFRP4 were valuable for diagnosing ACLF (P < 0.05) (Table 2). These parameters were then included in the multivariate logistic regression analysis. After adjusting for other confounding factors, sFRP4 [adjusted odds ratio (OR): 1.005, 95% confidence interval (CI): 1.000 - 1.010, P = 0.043], ALT (adjusted OR: 1.001, 95% CI: 1.000 - 1.002, P = 0.015), ALB (adjusted OR: 0.905, 95% CI: 0.829 - 0.989, P = 0.027), and TBil (adjusted OR: 1.017, 95% CI: 1.011 - 1.023, P < 0.001) were recognized as independent risk factors for ACLF (Figure 2A). The area under the ROC (AUC) of plasma sFRP4 for diagnosing ACLF was 0.790 (95% CI: 0.726 - 0.844, P < 0.001), and the sensitivity, specificity, and cut-off values of sFRP4 were 89.93% (95% CI: 79.20 - 96.20%), 58.27% (95% CI: 49.60 - 66.60%), and 17.49 ng/mL, respectively. Additionally, the AUC of the risk model based on TBil, ALB, ALT, and sFRP4 was 0.946 (95% CI: 0.904 - 0.973, P < 0.001), and the sensitivity, and specificity of the model were 88.14% (95% CI: 77.10 - 95.10%) and 89.21% (95% CI: 82.80 - 93.80%), respectively (Figure 2B).
Table 2.
Univariate Logistic Regression Analysis of the Variables for Diagnosing ALCF
| Variables | OR | 95% CI | P-Value |
|---|---|---|---|
| Gender (male) | 1.750 | 0.860 - 3.559 | 0.122 |
| Age (y) | 0.997 | 0.974 - 1.020 | 0.771 |
| HBeAg-positive | 0.874 | 0.437 - 1.748 | 0.704 |
| HBV DNA > 2 × 10⁴ | 2.017 | 1.079 - 3.767 | 0.028 |
| PT (s) | 1.197 | 1.119 - 1.281 | < 0.001 |
| TBil (mmol/L) | 1.021 | 1.015 - 1.027 | < 0.001 |
| ALB (g/L) | 0.879 | 0.833 - 0.923 | < 0.001 |
| AST (U/L) | 1.002 | 1.001 - 1.003 | 0.001 |
| ALT (U/L) | 1.001 | 1.000 - 1.001 | 0.003 |
| ALP (U/L) | 1.003 | 0.999 - 1.007 | 0.132 |
| GGT (U/L) | 1.001 | 0.999 - 1.002 | 0.362 |
| AFP (ng/mL) | 1.007 | 1.003 - 1.011 | < 0.001 |
| sFRP4 (ng/mL) | 1.010 | 1.006 - 1.013 | < 0.001 |
Abbreviations: ACLF, acute-on-chronic liver failure; OR, odds ratio, CI, confidence interval; HBeAg, hepatitis B e antigen; HBV, Hepatitis B virus; PT, prothrombin time; TBil, total bilirubin; ALB, albumin; AST, aspartate aminotransferase; ALT, alanine aminotransferase; ALP, alkaline phosphatase; GGT, gamma-glutamyl transferase; AFP, alpha-fetoprotein; sFRP4, secreted frizzled related protein 4.
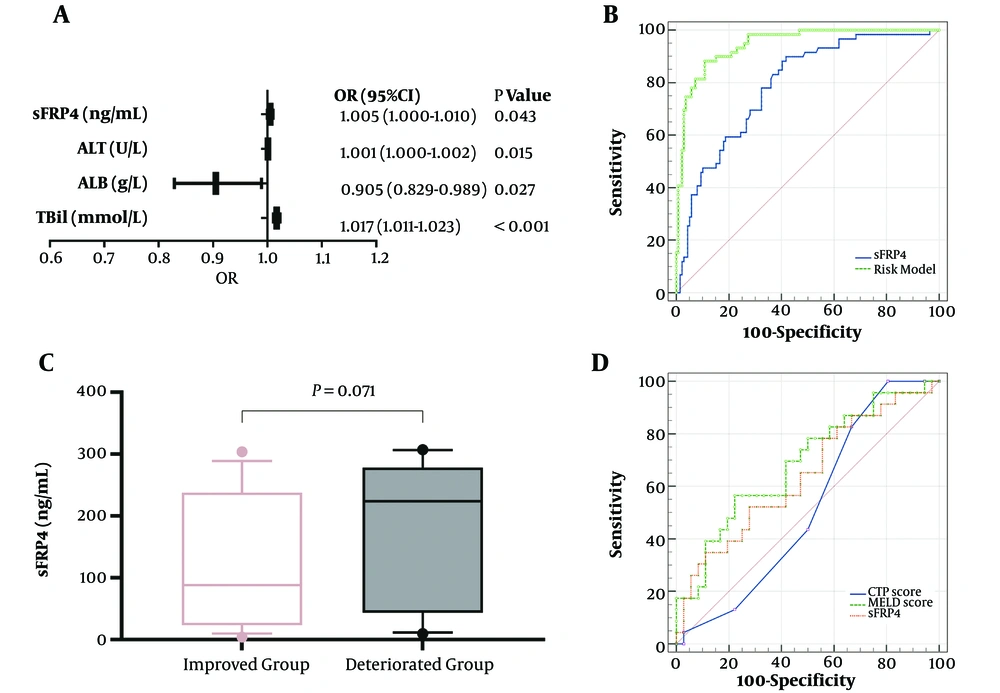
Figure 2.
The application value of plasma sFRP4 levels for diagnosing ACLF and predicting 3 month prognosis in ACLF patients. A, independent risk factors for diagnosing ACLF; B, the receiver operating characteristic (ROC) curve of sFRP4 and risk model for diagnosis of ACLF; C, the comparison of plasma sFRP4 levels in the improved and deteriorated groups; D, the ROC curve of sFRP4, MELD score, and CTP score for ACLF prognosis (sFRP4, secreted frizzled related protein 4; ALT, alanine aminotransferase; ALB, albumin; TBil, total bilirubin; MELD, the model for end-stage liver disease; CTP, Child-Turcotte Pugh).
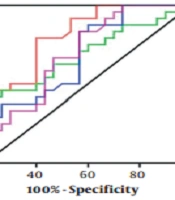
Patients with ACLF were divided into the improved and deteriorated groups. The plasma sFRP4 levels in the deteriorated group were elevated than in the improved group, with a marginally significant difference (P = 0.071) (Figure 2C). The AUC of the CTP score, MELD score, and plasma sFRP4 levels for predicting the 3-month prognosis in patients with ACLF was 0.522 (95% CI: 0.374 - 0.669, P = 0.780), 0.686 (95% CI: 0.546 - 0.826, P = 0.017), and 0.640 (95% CI: 0.505 - 0.761, P = 0.064), respectively (Figure 2D). The sensitivity, specificity, and cut-off values of sFRP4 were 52.17% (95% CI: 30.60 - 73.20%), 72.22% (95% CI: 54.80 - 85.80%), and 202.30 ng/mL, respectively.
4.4. The Correlations Between Plasma sFRP4 Levels and Other Variables in the ACLF Group
Plasma sFRP4 levels in patients with ACLF was positively correlated with MELD score (r = 0.401, P = 0.002) and PT (r = 0.306, P = 0.019), but not associated with TBil (r = 0.209, P = 0.112), ALB (r = -0.219, P = 0.096), AST (r = -0.133, P = 0.314), ALT (r = -0.111, P = 0.402), alkaline phosphatase (ALP) (r = -0.192, P = 0.146), gamma-glutamyl transferase (GGT) (r = -0.123, P = 0.352), AFP (r = -0.054, P = 0.687), and CTP score (r = 0.227, P = 0.083) (Table 3).
Table 3.
The Correlations Between Plasma sFRP4 Levels and Other Variables in Patients with ACLF
| Variables | TBil | ALB | AST | ALT | ALP | GGT | AFP | PT | MELD | CTP |
|---|---|---|---|---|---|---|---|---|---|---|
| r | 0.209 | -0.219 | -0.133 | -0.111 | -0.192 | -0.123 | -0.054 | 0.306 | 0.401 | 0.227 |
| P value | 0.112 | 0.096 | 0.314 | 0.402 | 0.146 | 0.352 | 0.687 | 0.019 | 0.002 | 0.083 |
Abbreviations: r, spearman’s rank correlation coefficient; TBil, total bilirubin; ALB, albumin; AST, aspartate aminotransferase; ALT, alanine aminotransferase; ALP, alkaline phosphatase; GGT, gamma-glutamyl transferase; AFP, alpha-fetoprotein; PT, prothrombin time; MELD, the model for end-stage liver disease; CTP, Child-Turcotte Pugh.
5. Discussion
In this study, we found that the levels of plasma sFRP4 levels might be generally in parallel with the progression of chronic HBV infection. It was found that patients in the LC, HCC, and ACLF groups had higher plasma sFRP4 levels than healthy controls (all P < 0.001), but no difference was found between the CHB group and healthy controls (P = 0.262). In patients with different stages of chronic HBV infection, the ACLF group had the highest plasma sFRP4 levels compared to the CHB, LC, and HCC groups (all P < 0.001), followed by the HCC and LC groups, and the CHB group had the lowest levels. High levels of plasma sFRP4 were recognized as an independent risk factor for diagnosing ACLF (adjusted OR: 1.005, 95% CI: 1.000 - 1.010, P = 0.043), with an AUC of 0.790 (95% CI: 0.726 - 0.844, P < 0.001); therefore, it may had a potential value in distinguishing patients with ACLF from patients with CHB and LC. However, the value of plasma sFRP4 levels in predicting the 90 days prognosis in patients with ACLF was higher than the CTP score but slightly lower than the MELD score, with an AUC of 0.640.
Wnt signaling pathway is associated with growth, ranging from embryonic development, cell proliferation, and cell migration to tumorigenesis (13). One of the ways that Wnt molecules affect target cells is initiated by binding to the frizzled (FZD) receptors. However, sFRPs can combine with Wnt molecules to block the interaction between the Wnt and FZDs or the formation of nonfunctional complexes with FZDs to inhibit the Wnt pathway; therefore, sFRPs levels are recognized as one of the antagonists of the Wnt pathway (14, 15). Recent studies have found that the promoter methylation of sFRP4 (this change causes down-regulation of this gene) was involved in tumor formation and development, such as cervical cancer, pancreatic cancer, pituitary adenoma, etc. (6-8).
Additionally, Xu et al. (9) observed that the diagnostic value of serum sFRP4 levels to distinguish HCC from non-HCC was similar to AFP, and the combined serum sFRP4 and AFP enhanced the diagnostic performance. Nevertheless, the HCC and LC groups showed similar levels of plasma sFRP4 in our study; thus, it was not suitable to distinguish patients with HCC from LC. In our opinion, the heterogeneity of enrolled patients, different sample sizes, and specimen types may account for the discrepancy. Owning to the limited number of studies on the relationship between circulating sFRP4 levels and HCC, more studies are needed to reveal their relevance.
The most important finding in this study was that the plasma sFRP4 levels were elevated in the CHB, LC, and ACLF groups, and the improved ACLF patients had lower plasma sFRP4 levels than the deteriorated group, with a marginally significant difference. Additionally, sFRP4 levels were positively correlated with MELD score and PT in this study. MELD score is widely used to predict mortality in patients with ESLD (16), and as one of the components of the MELD score, higher PT-INR is associated with poorer outcomes (17). These findings indicated that plasma sFRP4 levels can be served as a good biomarker to reflect the severity and prognosis in patients with chronic HBV infection.
To our knowledge, it was the first study to investigate the value of plasma sFRP4 levels in chronic HBV infection. SFRP4 is generated in the nucleus and is modified and accumulated in the endoplasmic reticulum around the perinuclear area and then is delivered by vesicles to the cytomembrane to be secreted (18, 19). Thus, the constant damage of hepatic cells might account for the gradually elevated plasma sFRP4 in patients with CHB, LC, and ACLF. In addition, sFRP4 mRNA is increased in the uterus of pregnant Wistar rats and is up-regulated after estrogen treatment in the non-pregnant ovariectomized rats (20). Also, estrogen inactivation was influenced by the damaged liver cells. Therefore, the increased estrogen in patients with ESLD may also play a role (21).
SFRP4 mRNA in human islets is elevated when incubated with interleukin-1β (IL-1β) and correlated with IL-6 and IL-8. It can be an inflammatory mediator for type 2 diabetes (22). On the other hand, the netrin-like domain (NLD) of sFRP4 can induce apoptosis (18). The inflammatory reaction is one of the key reasons for the development of ACLF, and hepatocyte apoptosis is one form of cell death in patients with ACLF (23). Accordingly, the inflammation and apoptosis properties of sFRP4 might promote ACLF progression. However, the definite mechanisms of why plasma sFRP4 is up-regulated accompanied by the progression of chronic HBV infection, and how sFRP4 affects prognosis are still unknown, and further studies are needed to clarify these issues.
Some limitations should be pointed out. First, it was a cross-sectional single-center study. Second, plasma sFRP4 levels in the improved group seemed lower than that in the deteriorated group; however, no significant difference was found (P = 0.071), the small sample size in the ACLF group may account for it. Third, the dynamic changes of plasma sFRP4 levels were not detected. Forth, the mechanism and effect of sFRP4 on chronic HBV infection were not explored, the increased estrogen in patients with ESLD may also play a role; therefore, the estrogen should be measured simultaneously in the future study. Therefore, a multi-center observational study with large sample size and relative basic research are strongly encouraged.
In conclusion, we found that plasma sFRP4 was up-regulated in patients with HBV chronic infection, and might be associated with the progression of the disease. Additionally, we did not show that plasma sFPR4 was significantly related to the prognosis in patients with ACLF, which may be due to the small sample size. More studies should explore its prognostic value in patients with ACLF. On the other hand, it may not suitable to be used to diagnose HCC.