1. Background
The accurate evaluation of liver fibrosis is crucial for predicting the treatment options and prognosis of chronic liver disease caused by different aetiologies. Liver biopsy (LB) remains the gold standard for the diagnosis of liver fibrosis (1). However, it is an invasive procedure that can lead to severe complications, such as bleeding and abdominal infection (2), which limits its wide application and repeated detection. In addition, LB samples represent only a tiny fraction of the total liver tissue (approximately 1/50,000). This limited sampling introduces variability, and a small biopsy might not accurately reflect the overall condition of the liver. Fibrosis is a dynamic process, and localized variations might exist, making it challenging to capture the entire spectrum of fibrotic changes in a single biopsy (3). Therefore, a non-invasive method for assessing liver fibrosis has become vital.
Transabdominal ultrasound transient elastography (TUS-TE) is the most commonly used technology for this purpose (4, 5). Elastography is a non-invasive technique that assesses the elastic properties of tissues to help diagnose the nature of lesions (6). However, when TUS-TE is used in the work-up of patients with obesity, ascites, or intercostal space stenosis, 10-20% of patients experience test failure or unreliable results (3, 7). Therefore, a new evaluation method that might be more advantageous has been proposed: Endoscopic ultrasound elastography (EUS-EG). This is a new technique for calculating and visualizing tissue elasticity during routine endoscopic ultrasonography.
Compared to TUS-TE, EUS-EG has several unique advantages. First, EUS-EG might theoretically be more sensitive than TUS-TE in examining the degree of liver fibrosis, and it has been used for the evaluation of chronic pancreatic fibrosis and pancreatic tumors with high accuracy (8, 9). In addition, EUS-EG has been used in the identification of liver masses and tumor staging (10-13). Compared to the transabdominal approach, the transendoscopic approach only requires passing through the thin gastric wall for signal transduction; however, the transabdominal approach requires passing through the thick abdominal wall, and the signal transduction of the transabdominal approach is weakened by the tissue, which is more obvious in the case of peritoneal inflammation or moderate or large amounts of ascites, which will inevitably produce errors in the examination results.
In addition, EUS-EG can take an elastic image of up to two-thirds of the inner side of the liver, and the distance between the transducer and the liver is the shortest, thereby providing more accurate imaging data (14). Endoscopic ultrasound elastography is an emerging technique that, compared to TUS-TE, can be used to evaluate almost all patients with liver disease (regardless of obesity or ascites). Moreover, the area of liver tissue that can be assessed is larger and, theoretically, has better diagnostic efficacy than TUS-TE (7). Therefore, the rationale for including both TUS-TE and EUS-EG lies in their unique advantages and characteristics.
Although TUS-TE is widely used, its effectiveness might vary based on patient characteristics. However, the clinical application report and guidance of EUS-EG for the diagnosis of liver fibrosis are still lacking. Therefore, the present study aimed to compare the specificity and sensitivity of these two techniques, acknowledging that their effectiveness might differ in certain patient groups.
2. Objectives
In this study, EUS-EG offers a solution to overcome the limitations of TUS-TE. It can assess liver fibrosis in patients with obesity or ascites more effectively and has the potential for a more extensive evaluation of liver tissue. The strain ratio (SR) used in conjunction with EUS-EG provides additional quantitative information, enhancing diagnostic accuracy. Therefore, the study focused on EUS-EG to explore its feasibility and reliability in diagnosing liver fibrosis, addressing the existing gaps in clinical application reports and guidance.
3. Methods
3.1. Patients
The study included 11 patients with chronic liver disease who met the study criteria and underwent EUS-EG, TUS-TE, and LB examinations at the same time. The Batts-Ludwig scoring system for liver fibrosis was used as the gold standard to analyze the correlation between the EUS-EG SR and TUS-TE liver stiffness measurement (LSM) with the pathological stage of liver fibrosis. The optimal cut-off value and area under the receiver operating characteristic curve (AUROC) of EUS-EG and TUS-TE for diagnosing liver fibrosis were calculated by drawing an ROC curve, and the corresponding sensitivity, specificity, and accuracy were also calculated.
Patients with liver fibrosis caused by chronic liver disease treated in the Department of Gastroenterology at the First Affiliated Hospital of Guangxi Medical University, Guangxi, China, between December 2019 and May 2020 participated in the study.
3.1.1. Inclusion Criteria
(1) Participants aged ≥ 18 years; (2) individuals with varying degrees of liver function, representing a spectrum of fibrosis stages and meeting various diagnostic criteria for chronic liver diseases, such as chronic viral hepatitis B, chronic viral hepatitis C, alcoholic liver disease, fatty liver disease or autoimmune liver disease; (3) patients who have not undergone prior liver fibrosis assessment by EUS-EG and TUS-TE; (4) participants capable of understanding and complying with the study’s requirements and willing to provide informed consent for their participation; (5) individuals with varying degrees of liver function, representing a spectrum of fibrosis stages.
3.1.2. Exclusion Criteria
(1) Participants < 18 years; (2) individuals with contraindications for endoscopic procedures (e.g., bleeding disorders and severe ascites) that would prevent the safe conduct of endoscopic ultrasound; (3) pregnant or lactating women; (4) participants unable to provide informed consent due to cognitive or communication impairments; (5) individuals with severe cardiovascular or renal conditions that might significantly impact liver fibrosis independent of the studied elastography methods.
A total of 26 patients with chronic liver disease were selected, including 4 patients with unknown etiology, 5 patients who could not complete endoscopic examination, and 6 patients who did not complete LB; finally, 11 patients completed the experiment. There were 5 male and 6 female subjects, aged 18-73 years, with 3 cases of chronic hepatitis B, 3 cases of autoimmune hepatitis, 2 cases of alcoholic hepatitis, 1 case of steatohepatitis, 1 case of primary biliary cirrhosis, and 1 case of drug hepatitis (Table 1). The patients’ characteristics, such as age, gender, body mass index (BMI), and liver function index, were evaluated.
Table 1.
Patient Demographics
| Patient Number | Age, y | Male/Female | Clinical Diagnosis | Batts‑Ludwig Stage | BMI, kg/m2 |
|---|---|---|---|---|---|
| 1 | 23 | M | CHB | S0 | 18.93 |
| 2 | 51 | M | ALD | S1 | 20.05 |
| 3 | 56 | F | AIH | S2 | 18.03 |
| 4 | 53 | F | AIH | S2 | 19.31 |
| 5 | 40 | F | DILI | S2 | 21.48 |
| 6 | 59 | M | CHB | S2 | 23.63 |
| 7 | 38 | M | ALD | S2 | 20.28 |
| 8 | 18 | M | NAFLD | S3 | 27.12 |
| 9 | 73 | F | AIH | S4 | 19.56 |
| 10 | 56 | F | CHB | S4 | 23.24 |
| 11 | 49 | F | PBC | S4 | 26.24 |
Abbreviations: BMI, body mass index; CHB, chronic hepatitis B; ALD, alcoholic liver disease; AIH, autoimmune hepatitis; DILI, drug-induced liver injury; NAFLD, non-alcoholic fatty liver disease; PBC, primary biliary cirrhosis.
This study was approved by the Medical Ethics Committee of the First Affiliated Hospital of Guangxi Medical University (No. 2022-KY-E-292), and the informed consent of the participants was obtained. All procedures were conducted in accordance with the guidelines of the Declaration of Helsinki.
3.2. Study Design
3.2.1. Transabdominal Ultrasound Transient Elastography
The detection of TUS-TE was performed using FibroScan 502 (France Echosens SA), and the detection method detailed in the FibroScan user manual was followed. The patients were routinely placed in a supine position, with the right arm raised to the head, to maximize exposure of the intercostal space. The detection range was determined as the 7th to 9th intercostal space from the right axillary front to the midaxillary line. The LSM was measured 10 consecutive times, and the median (KPa) was taken as the final result. A success rate of 60% or more and a quartile spacing of less than one-third of the median measurements are required to be considered reliable. The whole operation was performed by a professional physician.
3.2.2. Endoscopic Ultrasound Elastography
The participants were placed in the left lateral decubitus position, anesthetized with propofol or sufentanil for sedation, and underwent routine EUS examination using the GF-UCT290 linear array echoendoscope EU-ME2 (Olympus Corporation, Tokyo, Japan), followed by the induction of the embedded elastography analysis software HI VISION Preirus (Hitachi-Aloka Medical, Ltd., Tokyo, Japan) using a gastric approach. The probe was manipulated into the gastrointestinal lumen to provide the strain required to generate optimal B-mode images at 7.5 MHz. The region of interest for elastography evaluation was manually selected to determine the optimal target region of the liver as region B, and the gastric wall was selected as the reference region A. The B/A value obtained was the SR value of the liver region. To ensure image quality, a stable image with a duration of at least 5 seconds is required for quantitative analysis. Three flexibility assessments were performed for each patient, with the corresponding mean SR as the final result of the analysis. The examination of all patients was performed by Dr Qin, a skilled endoscopic ultrasonographer (more than 5 000 endoscopic ultrasonograms were performed).
3.2.3. Pathological Examination
A liver biopsy was performed by ultrasound physicians. Liver tissue was obtained under ultrasound guidance using a Bard Magnum biopsy needle (18G; Bard Magnum, USA), and percutaneous LB was performed at the end of expiration by negative aspiration. The tissue length was required to be more than 1.0 cm, and at least three complete drainage areas were included. Liver biopsy specimens were fixed with a 4% formaldehyde solution and then embedded in paraffin, reticular fiber, and Masson fiber staining. According to the internationally recommended application of Batts-Ludwig liver fibrosis score staging (S staging), liver fibrosis is divided into stages S0-S4. The pathology slides were read by a specialized hepatologist. Five discriminant points were set according to the degree of liver fibrosis with insignificant severity, as follows:
No liver fibrosis (S0), mild liver fibrosis (S1), marked liver fibrosis (S2), severe liver fibrosis (S3), and cirrhosis (S4).
3.2.4. Statistical Analyses
For statistical analysis, SPSS version 23 software (IBM, Armonk, NY, USA) was used, and plotting was performed using GraphPad Prism 8. Measurement data that conformed to the normal distribution were represented by mean ± standard deviation, and the data not following a normal distribution were represented by the median (25%, 75%). The ROC curve was drawn, and the AUROC was calculated to determine the optimal cut-off value of EUS-EG and TUS-TE for distinguishing cirrhosis from non-cirrhosis. Thresholds were determined to maximize the Jorden index (sensitivity + specificity) at −1 and calculate the sensitivity, specificity, and accuracy of these thresholds. Spearman’s correlation coefficient was used to analyze the correlation between EUS-EG, TUS-TE, and Batts-Ludwig liver fibrosis stage. All tests were two-tailed, and P < 0.05 was considered statistically significant.
4. Results
4.1. Summary of the Correlation Between Patient Characteristics and Pathological Stages
The distribution of the LB pathological results of the 11 patients with chronic liver disease included in the study was as follows:
One case of S0, 1 case of S1, 5 cases of S2, 1 case of S3, and 3 cases of S4. The age, gender, BMI, and liver function index of the patients at each stage are represented in Table 2.
Table 2.
Summary of Patient Characteristics
| Patient Characteristics | S0 | S1 | S2 | S3 | S4 |
|---|---|---|---|---|---|
| Patients, No. | 1 | 1 | 5 | 1 | 3 |
| Age, y | 23 | 51 | 49.2 ± 9.6 | 18 | 59.3 ± 12.3 |
| Gender, M/F | 1/0 | 1/0 | 2/3 | 1/0 | 0/3 |
| BMI, kg/m2 | 18.93 | 20.05 | 20.55 ± 2.14 | 27.12 | 23.01 ± 3.35 |
| ALT, U/L | 88.0 | 223.0 | 120.0 ± 159.2 | 178.0 | 46.0 ± 25.6 |
| AST, U/L | 46.0 | 186.0 | 160.4 ± 201.0 | 113.0 | 62.0 ± 27.4 |
| TBIL, umol/L | 18.7 | 8.6 | 74.8 ± 115.9 | 35.0 | 32.3 ± 29.2 |
| PLT, ×109 | 322.0 | 110.0 | 253.6 ± 40.6 | 333.0 | 138.3 ± 35.0 |
Abbreviations: EUS-EG, endoscopic ultrasound elastography; TUS-TE, transabdominal ultrasound transient elastography; ALT, alanine aminotransferase; AST, aspartate aminotransferase; TBIL, total bilirubin; PLT, platelet.
4.2. Detection Results and Trends of EUS-EG and TUS-TE
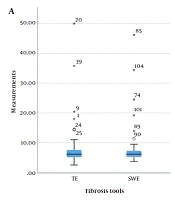
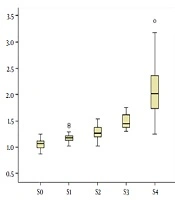
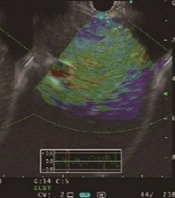
The EUS-EG SR and TUS-TE LSM were 0.15 and 3.10 Kpa, respectively, in the S0 patients. The SR and LSM of the S1 patients were 1.33 and 10.1 Kpa, respectively. The mean SR and LSM of the S2 patients were 0.71 ± 0.13 and 9.86 ± 1.76 Kpa, respectively. The SR and LSM of the S3 patients were 0.81 and 28.0Kpa, respectively. The mean SR and LSM of the S4 patients were 1.45 ± 0.85 and 31.23 ± 12.09 Kpa, respectively (Table 3). The EUS-EG images of liver fibrosis at each stage are shown in Figure 1. The EUS-EG SR and TUE-TE LSM values showed an increasing trend with the increase in the pathological stage (Figure 2).
Table 3.
Correlation of Elastography Result or Liver Fibrosis Pathological Staging Score and Pathological Stage
| Elastography Method | Elastography Result | r | P-Value | ||||
|---|---|---|---|---|---|---|---|
| S0 | S1 | S2 | S3 | S4 | |||
| EUS-EG, SR | 0.15 | 1.33 | 0.71 ± 0.13 | 0.81 | 1.45 ± 0.85 | 0.759 | 0.01 |
| TUS-TE, LSM, kPa | 3.10 | 10.1 | 9.86 ± 1.76 | 28.0 | 31.23 ± 12.09 | 0.857 | 0.003 |
Abbreviations: EUS-EG, endoscopic ultrasound elastography; TUS-TE, transabdominal ultrasound transient elastography; SR, strain ratio; LSM, liver stiffness measurement.
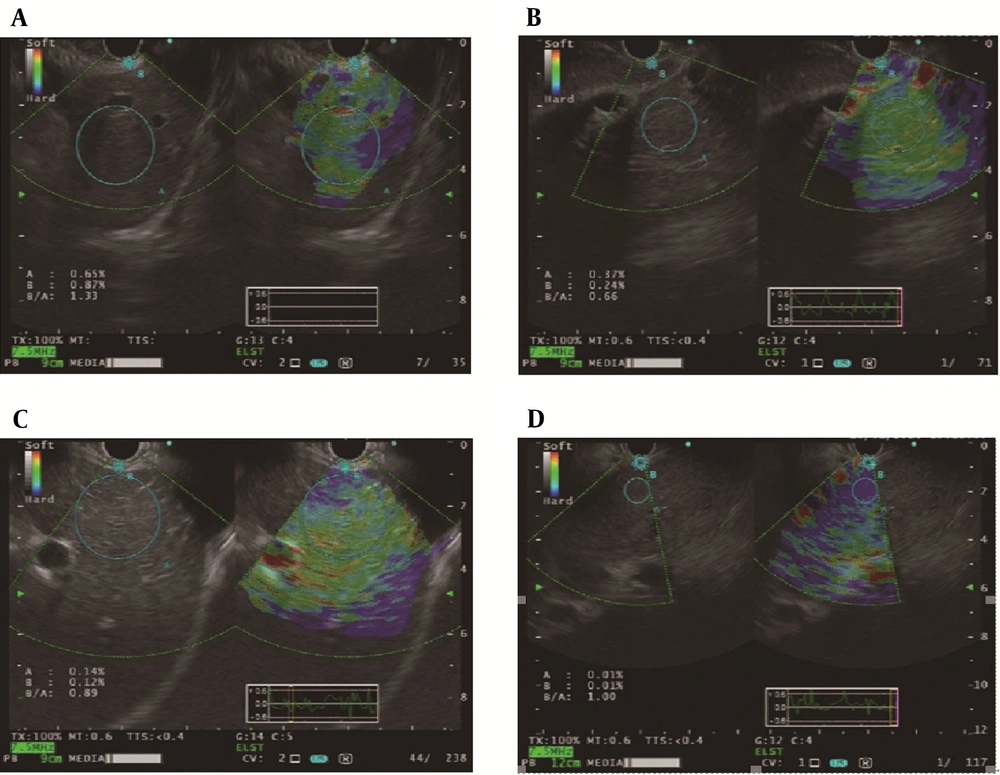
Figure 1.
Strain ratio of liver fibrosis on pathological staging (S). A, S = 1, SR = 1.33; B, S = 2, SR = 0.66; C, S = 3, SR = 0.89; D, S = 4, SR = 1.00.
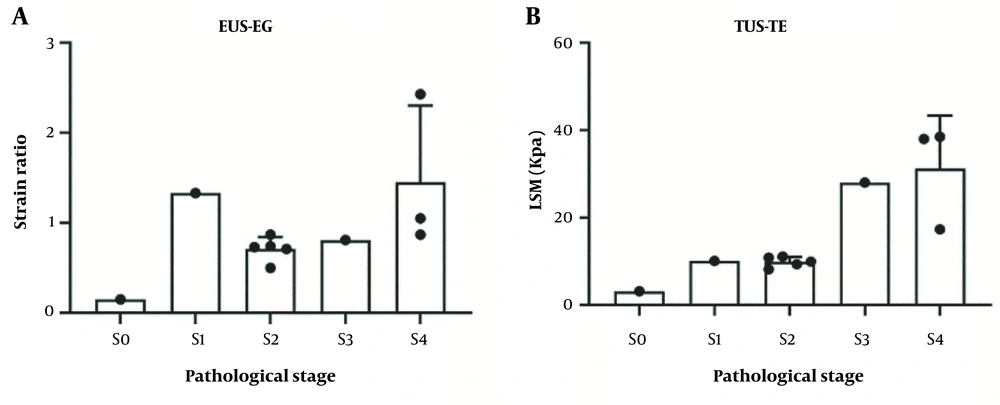
Figure 2.
Distribution of the SR values in the EUS-EG group (A) and LSM values in the TUS-TE group (B) with fibrosis (S0 - S3) and cirrhosis (S4) on liver based on the Batts‑Ludwig Scoring system.
4.3. Correlation Analysis Between EUS-EG and TUS-TE with Pathological Stages
Using Pearson correlation analysis, the EUS-EG SR and TUS-TE LSM values were highly positively correlated with the pathological stage of liver fibrosis, with correlation coefficients of 0.759 and 0.857 and p-values of 0.01 and 0.003, respectively (Table 3).
4.4. Analysis of the Receiver Operating Characteristics Curve of the Participants
Using pathological results as a reference, the EUS-EG SR cut-off value for liver cirrhosis was 0.84, and the TUS-TE cut-off value was 14.2 KPa. When the pathological stage was equal to or greater than S0, the sensitivity, specificity, and accuracy of EUS-EG were 94.6%, 75%, and 72.7%, respectively, and AUROC was 0.8958 (95% confidence interval [CI], 0.70 - 1.00); the sensitivity, specificity, and accuracy of TUS-TE were 96.2%, 83.3% and 81.8%, respectively, and the AUROC was 0.96 (95% CI: 0.84 - 1.00) (Table 4 and Figure 3A). When the pathological stage was equal to or greater than S2, the sensitivity, specificity, and accuracy of EUS-EG were 100%, 83.3%, and 88.9%, respectively, and the AUROC was 0.97 (95% CI: 0.87 - 1.00); the sensitivity, specificity, and accuracy of TUS-TE were 100%, 87.5%, and 88.9%, respectively, and the AUROC was 0.94 (95% CI: 0.79 - 1.00) (Table 4 and Figure 3B).
Table 4.
Diagnostic Performance of Endoscopic Ultrasound Elastography (EUS-EG) and Transabdominal Ultrasound Transient Elastography (TUS-TE)
| Diagnostic Outcome | EUS-EG (SR 0.84) (%) | TUS-TE (LSM 14.2 KPa) (%) | ||
|---|---|---|---|---|
| S ≥ 0 | S ≥ 2 | S ≥ 0 | S ≥ 2 | |
| Sensitivity | 94.6 | 100 | 96.2 | 100 |
| Specificity | 75.0 | 83.3 | 83.3 | 87.5 |
| Accuracy | 72.7 | 88.9 | 81.8 | 88.9 |
Abbreviations: EUS-EG, endoscopic ultrasound elastography; TUS-TE, transabdominal ultrasound transient elastography; SR, strain ratio; LSM, liver stiffness measurement.
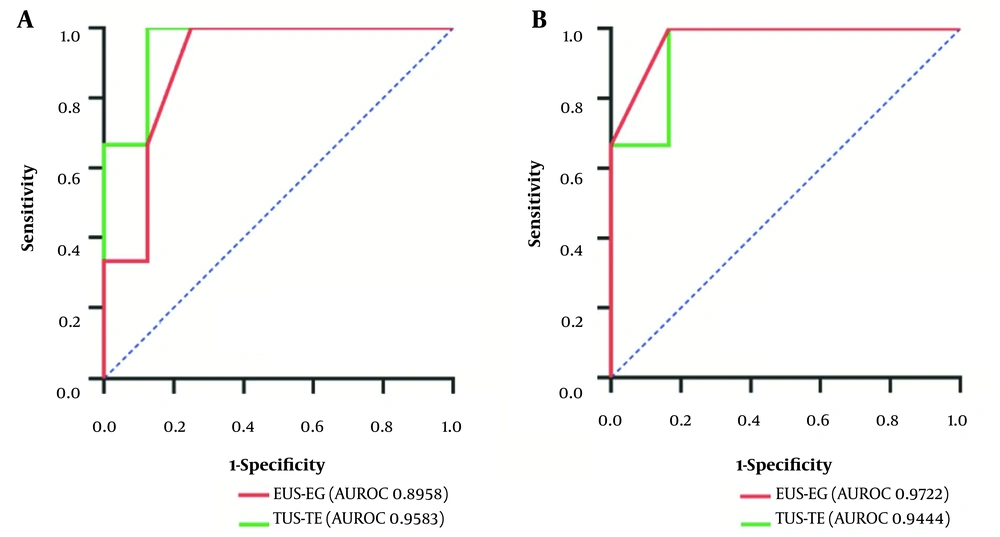
Figure 3.
ROC curves of TUS-TE and EUS-EG. A, when the pathological stage was greater than or equal to S0; B, when the pathological stage was greater than or equal to S2
5. Discussion
In this study, the primary objective was to assess the efficacy of SR values obtained through EUS-EG in accurately distinguishing between different pathological stages of liver fibrosis. The obtained findings revealed a significant correlation between EUS-EG SR and the severity of liver fibrosis, providing valuable insights into its diagnostic potential. As liver fibrosis progressed, there was a consistent upward trend in EUS-EG SR values. Specifically, when the pathological stage reached S ≥ 2, the real-time tissue elastography under endoscopic ultrasound demonstrated a highly positive correlation with the degree of liver fibrosis (r = 0.759, P = 0.01). This correlation indicates that higher EUS-EG SRs corresponded to more advanced stages of liver fibrosis.
This conclusion is similar to the findings of Schulman et al. (15). The aforementioned study showed that the AUROC curve for the prediction of cirrhosis was 0.865 at a cut-off value of 2.56 for EUS-EG combined with the liver fibrosis index, indicating that EUS-EG has a strong predictive value for the prediction of cirrhosis. Friedrich-Rust et al. (16) evaluated liver fibrosis using the transabdominal elastography SR (METAVIR pathological staging), achieving an AUROC of 0.75 for severe liver fibrosis (F ≥ 2), 0.73 for significant liver fibrosis (F ≥ 3), and 0.69 for cirrhosis (F = 4), suggesting that the transabdominal elastography SR method has certain value for differentiating substantial liver fibrosis from severe liver fibrosis but is not able to accurately assess cirrhosis. The current study revealed that EUS-EG combined with the SR method can better diagnose cirrhosis. In conclusion, EUS-EG combined with SR is an ideal method to evaluate liver fibrosis.
Transient elastography has become the preferred imaging method for the non-invasive evaluation of liver fibrosis globally (17), as TUS-TE accurately measures the degree of liver stiffness associated with the fibrosis stage. Friedrich-Rust et al. (18) demonstrated that the average AUROC of TUS-TE in diagnosing significant fibrosis, severe fibrosis, and cirrhosis were 0.84 (95% CI: 0.82 - 0.86), 0.89 (95% CI: 0.88 - 0.91), and 0.94 (95% CI: 0.93 - 0.95), respectively. Another study (19) evaluated stage 4 liver fibrosis (cirrhosis), determining a pooled sensitivity of 87% (95% CI: 84 - 90%) and a pooled specificity of 91% (95% CI: 89 - 92%). The two above-mentioned meta-analyses identified that TUS-TE has high accuracy in the diagnosis of liver fibrosis and cirrhosis. The aforementioned results are consistent with the results of the present study. In the current study, when the diagnostic threshold of LSM was 14.2 Kpa and the pathological stage was S ≥ 0, the sensitivity, specificity, and accuracy of TUS-TE were 96.2%, 83.3%, and 81.8%, respectively, and the AUROC was 0.96. When S ≥ 2, its sensitivity, specificity, and accuracy were 100%, 87.5%, and 88.9%, and the AUROC was 0.94.
The current study has several limitations. Firstly, although all EUS-EG was performed by highly skilled therapeutic endoscopists, which is conducive to obtaining high-quality examination results, the accuracy of the results might be affected because there is no standardized procedure for performing EUS-EG internationally. Secondly, the limited number of patients included in this study (only 11) resulted in some sample errors. In this study, SR values in the S1 stage of early liver fibrosis were higher than those in the S2 stage of obvious liver fibrosis and the S3 stage of severe liver fibrosis. The reason might be that only 1 case was included in the S1 phase, resulting in the sample error. Thirdly, EUS-EG technology cannot control tissue compression through an EUS transducer; therefore, the absolute value of tissue elasticity or Yang’s modulus cannot be calculated, and the force applied is unknown and difficult to control by the endoscope.
5.1. Conclusions
This study verifies that EUS-EG can identify the degree of fibrosis at various stages, such as normal liver, fatty liver, and cirrhosis, based on cross-sectional imaging. When the pathological stage is S ≥ 2, EUS-EG is more advantageous than TUS-TE. In conclusion, EUS-EG is a potential and promising method for diagnosing liver fibrosis; however, larger, multicentre prospective studies are needed for further validation.