1. Background
Non-alcoholic fatty liver disease (NAFLD) is one of the main causes of the liver disease in the world. The disease comprises a range of damages, from mild abnormal hepatic triglyceride accumulation, simple steatosis, to non-alcoholic steatohepatitis (NASH), which may lead to fibrosis and even irreversible cirrhosis (1-3). The worldwide prevalence of NAFLD has been roughly estimated to affect 20% - 30% of the general population (3, 4). Studies show that this disorder is directly associated with obesity, insulin resistance, and diabetes mellitus. Thus, it is expected that the incidence of NAFLD is rapidly increasing likely due to the rising of these relevant conditions (5, 6).
Recent data have provided evidence that mitochondria and oxidative stress play a key role in the pathogenesis of NAFLD (7, 8). Mitochondria have several functions in fat and energy homeostasis in hepatic cells. Some of the mitochondria active roles include beta-oxidation of free fatty acids, electron transfer and production of ATP and reactive oxygen species (ROS) (9, 10). Mitochondrial dysfunction will lead to the lipid deposits accumulation of non-metabolized fatty acids in the cytosol by disruption of fatty acid beta-oxidation. As a response to the higher circulating levels of fatty acids, an increase in fatty acid beta-oxidation occurs. Therefore, increased demand of mitochondrial oxidation could damage normal function of this organelle through the induction of ROS production (1, 7, 11).
The pathogenesis of NAFLD results from a multiplex interaction of genetic variations with environmental factors such as sedentary lifestyle and high calorific food intake (12). There is increasing evidence that genetic components have an important influence in the development of NAFLD (13, 14). Human mitochondrial DNA (mtDNA) comprises 16,569 bp and encodes 13 essential subunits of the oxidative phosphorylation system and also 2 rRNAs and 22 tRNAs (15). Genetic mutations in mtDNA, including deletions, could exhibit broad effects on mitochondrial function and may contribute to the disease susceptibility. The 4,977 bp deletion is located between nucleotides 8,469 and 13,447 and includes several essential oxidative phosphorylation genes encoding ATPase6/8, cytochrome oxidase III, NADH dehydrogenase subunit 3 (ND3), ND4, and ND5. This large deletion is the most common deletion in the mitochondrial genome that has been detected in several types of human diseases (16, 17). Moreover, it has been suggested that variations in mtDNA copy numbers may also be associated with some disorders. Therefore, the possible relationship between mitochondrial copy number and diseases susceptibility has been investigated in several studies (18, 19). However, a few studies have examined the relationship between these mutations and NAFLD susceptibility. Chiappini et al. reported that the mean ratio of mitochondrial DNA to nuclear DNA (nDNA) content is higher in liver steatosis compared to normal liver biopsies (20) whereas two other studies showed that mtDNA copy number is reduced in NAFLD (21, 22).
2. Objectives
To date, a few studies have investigated the association of mtDNA copy number with NAFLD on the liver tissue samples. In addition, to the best of our knowledge, there is no previous report on the association between the mtDNA 4,977-bp deletion and NAFLD. Accordingly, the current study aimed to evaluate the possible association of the mtDNA copy number and 4,977-bp large deletion levels with susceptibility to NAFLD in a sample of Iranian population.
3. Methods
3.1. Study Population
This case-control study included 43 NAFLD patients and 20 obese control subjects undergoing sleeve gastrectomy who were recruited during the period of May 2014 to November 2015 in the Khatamol Anbia hospital, Tehran, Iran. Liver ultrasonography was performed on the all subjects before the operation. Tissue samples were taken by using liver needle biopsy from imaging or histologically-diagnosed patients with NAFLD by a pathologist according to the NASH clinical research network criteria (NASH CRN). Based on the presence of hepatic steatosis or hepatocellular injury, NAFLD patients were divided into two groups: nonalcoholic fatty liver (NAFL) and NASH. NAFL was defined as the presence of hepatic steatosis with no evidence of hepatocellular injury and NASH was defined as the presence of hepatic steatosis and inflammation with hepatocellular injury (23). For the control group, 20 normal liver samples were obtained by using biopsy from obese, NAFLD free subjects whose histological findings were completely normal. Subjects were excluded if they met any of the following criteria: other liver disorders, secondary causes of steatosis including alcohol consumption, hepatitis B and C virus infection, use of drugs that may cause steatosis, and glucocorticoids therapy. Moreover, subjects with a family history of NAFLD were excluded. Subjects who had been diagnosed with any cancer as well as diabetic patients were also excluded. The study was approved by the ethics committee of Hamadan University of Medical Sciences and written informed consent was obtained from all subjects.
3.2. Anthropometric and Biochemical Analyses
Body mass index (BMI) was calculated as the body weight divided by the square of the body height (weight (kg)/height (m2)). Alanine transaminase (ALT), aspartate transaminase (AST), cholesterol, triglyceride, HDL-cholesterol, and fasting blood glucose levels were measured according to the enzymatic methods using an automatic biochemical analyzer. LDL-cholesterol was calculated using the Friedewald equation.
3.3. DNA Extraction
Genomic DNA was extracted from fresh liver tissue samples by using a DNA isolation kit (AllPrep DNA/RNA Micro Kit, Qiagen) according to manufacturer’s instructions.
3.4. mtDNA copy Number Assay
The relative level of mtDNA copy number was measured by quantitative real-time PCR (Q-PCR) (24). In brief, Q-PCR was performed using the ONP 86, ONP 89 primers and β-actin as an internal control. Amplification was carried out using the SYBR master mix (Real QPCR 2x Mix, Ampliqon) according to the protocol of the manufacturer. The PCR was done in 40 cycles at 95°C for 15 minutes, followed by 40 cycles at 95°C for 30 seconds, and 58°C for 1 minute. Each sample was run in triplicate. The level of mtDNA copy number was calculated using the delta Ct (∆Ct) of average Ct of mtDNA and nDNA (∆Ct = CtmtDNA -Ctβ-actin). The relative level of mtDNA copy number was calculated using the 2-∆∆Ct method.
3.5. Detection and Determination of mtDNA 4,977-bp Deletion
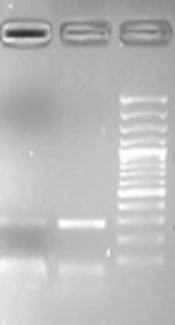
For detection of mtDNA 4,977-bp deletion, a multiplex polymerase chain reaction (PCR) protocol was performed using the ONP 86, ONP 89, ONP 25, and ONP 74 primers (23). The specificity of primers was checked using Primer-BLAST from NCBI (http://www.ncbi.nlm.nih.gov/). The cycling conditions were as follows: 94˚C for 3 minutes followed by 35 cycles at 95°C for 40 seconds, annealing time at 57.5°C for 40 seconds, and extension at 72°C for 40 seconds with a final extension time of 7 minutes at 72°C. ONP 86 and ONP 89 primers amplified a normal internal mtDNA fragment (279 bp) that served as a control for the PCR preparation and analysis. The appearance of a 497-bp band (using the ONP 74 and ONP 25 primers) on a 1.5% agarose gel indicated an expression of the 4,977-bp deletion. The accuracy of amplifications was verified by direct sequencing analysis.
To determine 4,977-bp deletion levels, the mtDNA content was measured in individuals who carried this mutation using a real-time PCR and normalized by β-actin genes. Q-PCR was carried out using specific primer pairs (ONP 86/ONP 89 and ONP 12/ONP 13) in a 20 μL reaction volume containing SYBR master mix (Real QPCR 2x Mix, Ampliqon) according to the protocol of the manufacturer. ONP 12 (5′-TCGTAGTAACAGCCATTCTC-3′) and ONP 13 (5′-GAGGTTAGCGAGGCTTGCTA-3′) primers were located within the common deletion region and amplified a specific product only in wild type mtDNA. In addition, whole mtDNA PCR product was amplified using the ONP 86 and ONP 89 primers. The PCR conditions were 95°C for 15 minutes, followed by 35 cycles at 95°C for 30 seconds, and 58°C for 60 seconds. The threshold cycle number (Ct) values of the mitochondrial genes and β-actin were determined. The percentage of mtDNA deletion levels was quantified by calculating the common deletion region relative to total mitochondrial DNA.
3.6. Statistical Analysis
All statistical analyses were conducted using SPSS Statistical Software (version 18.0). The quantitative data were expressed as mean ± SD (standard deviation) or median (interquartile range). Depending on whether the data were normally distributed or not, parametric or non-parametric tests were employed. Parametric statistical tests including student’s t-test and one way ANOVA were used to compare the normally distributed quantitative variables between the groups. Mann-Whitney U test was used to compare non-normally distributed variables between the groups. Furthermore, categorical variables were analyzed using chi-square test. Logistic regression analysis was performed in order to adjust for the confounders of age, BMI, and lipid levels. Pearson correlation analysis was performed to determine the relationship of the level of mtDNA copy number with other variables. P values less than 0.05 were regarded as statistically significant.
4. Results
The characteristics of the study population including 43 NAFLD patients (19 with NAFL and 24 with NASH) and 20 control subjects are provided in Table 1. In addition, Table 2 represents the clinical and biochemical characteristics of the NAFL and NASH patients. There was no difference in age, systolic and diastolic blood pressure, and lipid levels between the NAFLD patients and control subjects. However, NAFLD patients had significantly higher values of BMI (P < 0.0001). In addition, NAFL and NASH patients were significantly different in ALT level (P = 0.03). We did not find significant differences between these groups in terms of other biochemical parameters (P > 0.05).
Table 1.
Demographic and Clinical Characteristics of the Patients With NAFLD and Control Subjectsa
| Parameter | NAFLD (n = 43) | Control (n = 20) | P Valueb |
|---|---|---|---|
| Gender (Male/Female) | 21/22 | 14/6 | 0.116 |
| Age, y | 42.37 ± 9.66 | 37.65 ± 12.84 | 0.110 |
| Body Mass Index, kg/m2 | 43.89 ± 8.39 | 33.89 ± 4.92 | < 0001c |
| Systolic blood pressure, mmHg | 12 (11 - 13) | 11.5 (10- 13) | 0.380 |
| Diastolic blood pressure, mmHg | 75 (70 - 80) | 70 (70 - 80) | 0.317 |
| LDL-Cholesterol, mmol/L | 2.81 ± 0.76 | 2.86 ± 0.60 | 0.797 |
| HDL-Cholesterol, mmol/L | 1.16 (1.00 - 1.42) | 1.24 (1.04 - 1.42) | 0.284 |
| Triglycerides, mmol/L | 1.98 (1.63 - 2.37) | 2.13 (1.47 - 2.45) | 0.465 |
| Total Cholesterol, mmol/L | 4.96 (4.31 - 5.34) | 2.17 (1.36 - 2.47) | 0.284 |
| FBS, mmol/L | 5.55 (5.20 - 6.36) | 5.55 (5.20 - 5.87) | 0.258 |
Abbreviations: FBS: fasting blood glucose; HDL: high-density lipoprotein; LDL: low-density lipoprotein.
aValues are presented as mean ± SD and median (interquartile range).
bP values were computed by χ2 test, t-test, and Mann-Whitney U test.
cStatistically significant.
Table 2.
Demographic and Clinical Characteristics of the Patients with NAFLDa
| Parameter | NAFL (n = 19) | NASH (n = 24) | P Valueb |
|---|---|---|---|
| Gender (Male/Female) | 4/15 | 10/14 | 0.152 |
| Age, y | 39.78 ± 11.47 | 44.41 ± 7.58 | 0.120 |
| Body Mass Index, kg/m2 | 45.26 ± 9.48 | 42.81 ± 7.45 | 0.347 |
| Systolic blood pressure, mmHg | 120 (110 - 125) | 120 (110 - 130) | 0.558 |
| Diastolic blood pressure, mmHg | 75 (70 - 80) | 80 (70 - 80) | 0.650 |
| LDL-Cholesterol, mmol/L | 2.85 ± 0.70 | 2.78 ± 0.83 | 0.781 |
| HDL-Cholesterol, mmol/L | 1.21 (1.03 - 1.52) | 1.16 (0.98 - 1.29) | 0.199 |
| Triglycerides, mmol/L | 1.97 (1.26 - 2.28) | 1.98 (1.82 - 2.46) | 0.099 |
| Total Cholesterol, mmol/L | 194.89 ± 29.59 | 185.72 ± 37.40 | 0.395 |
| ALT, U/L | 17 (14 - 33) | 23 (24 - 53) | 0.030c |
| AST, U/L | 20.25 ± 8.66 | 25.45 ± 12.68 | 0.137 |
| FBS, mmol/L | 5.77 (5.22 - 6.88) | 5.44 (5.16 - 5-77) | 0.477 |
Abbreviations: FBS: fasting blood glucose; HDL: high-density lipoprotein; LDL: low-density lipoprotein.
aValues are presented as mean ± SD and median (interquartile range).
bP values were computed by χ2 test, t-test, and Mann-Whitney U test.
cStatistically significant.
The comparison of mtDNA copy number between NAFLD cases and healthy controls is shown in Figure 1. The relative expression of mtDNA copy number was 3.7 fold higher in NAFLD patients than healthy controls (P < 0.0001). The results remained significant after adjustment for age, BMI, gender, and lipid profile (P = 0.02). Moreover, the relative expression of mtDNA copy number was 4.3 (P < 0.0001) and 3.2-fold (P < 0.0001) higher in NAFL and NASH patients than healthy controls, respectively. No significant differences were found in the expression of mtDNA copy number between the NAFL and NASH patients (P = 0.499).
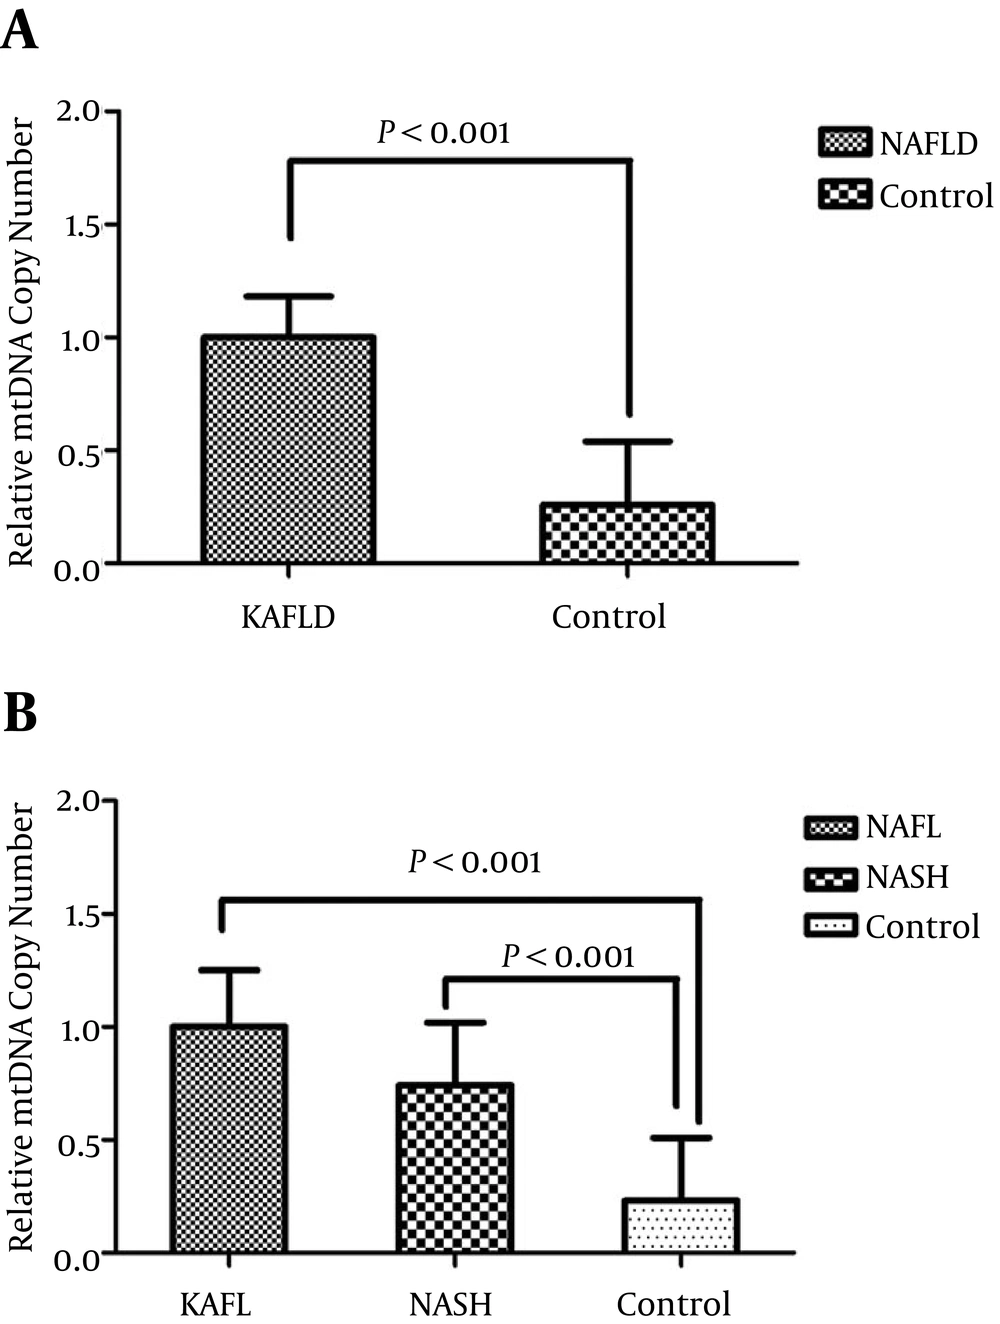
Figure 1.
A, comparison of the relative expression of mtDNA copy number in NAFLD and control subjects; B, comparison of the relative mtDNA copy number in liver tissue samples of patients with NAFL, NASH, and control subjects. P values were computed by χ2 test and t-test and data are shown as mean ± SD.
No significant differences were also observed in the expression of mtDNA copy number between male and female subjects (P = 0.494). Furthermore, our results showed that there was not a significant difference in mtDNA copy number level between older (> 42 years old) and younger participants (< 42 years old) (P = 0.118). Finally, there was not a significant correlation between mtDNA copy number and biochemical and anthropometrical parameters such as lipid levels, blood pressure, and BMI after adjusting for age and sex (P > 0.05).
Based on the results, the 4,977-bp deletion was detected in none of liver tissue samples obtained from the 20 control subjects. Whereas, 8 out of 43 NAFLD patients (18.6%) showed the 4,977 -bp deletion in their liver tissues (P = 0.039) (Figure 2). Then, the deletion levels were measured in the NAFLD patients carrying the deletion by Q-PCR. Our finding showed that the mtDNA deletion levels varied from 14.31% to 28.68% of the total mitochondrial DNA in tissues carrying this deletion. Of total 8 NAFLD cases carrying the 4,977-bp deletion, 7 cases (87.5%) belonged to the NASH patients.
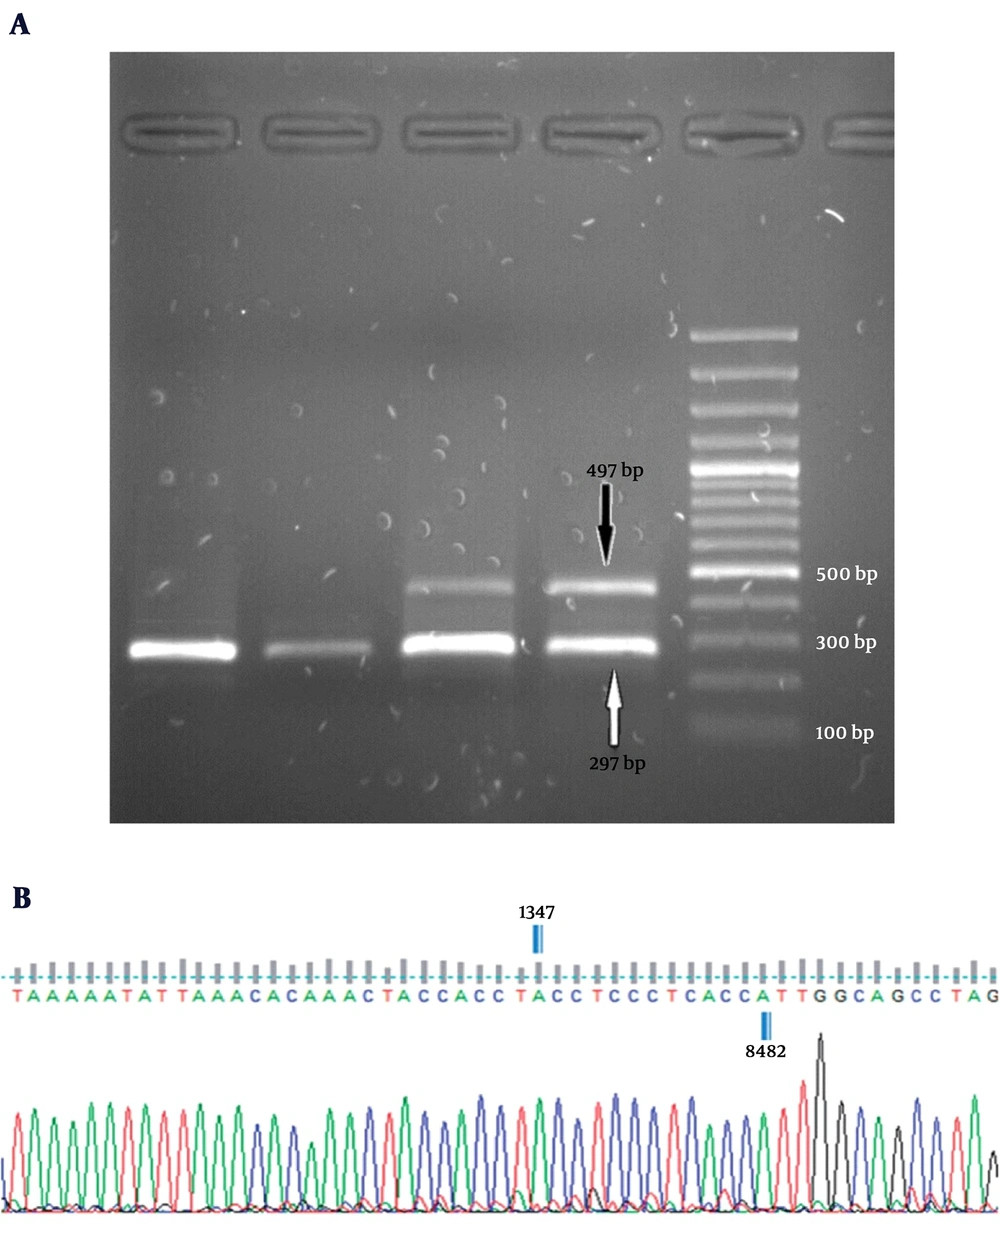
Figure 2.
A, electropherograms of multiplex PCR products on a 1.5% agarose gel along with a 100 bp DNA ladder. All subjects produced a single fragment of 279 bp as a control. The appearance of a 497-bp band was an expression of the 4,977-bp deletion; B, schematic presentation of mtDNA 4,977-bp deletion. Sequence analysis performed using the Finch TV 1.4.0 software (Geospiza, Inc., Seattle, WA).
5. Discussion
Deficiencies observed in mtDNA genome and functions along with oxidative stress could play an important role in the pathogenesis of NAFLD. This case-control study indicated an association between the level of mtDNA copy number in the liver tissue and risk of subsequent development of NAFLD. Actually, our results revealed that the mtDNA copy number in liver biopsy samples was significantly higher among 43 patients with NAFLD than control subjects (n = 20).
In agreement with our results, Chiappini et al. reported that the mean ratio of mitochondrial DNA to nDNA content was higher in liver steatosis compared to normal liver biopsies (20). However, the findings of the current investigation are in contrast with the results of two studies that showed decreased mtDNA copy number was associated with increased risk of NAFLD. Silvia Sookoian et al. evaluated the mtDNA copy number in liver biopsy samples obtained from 63 patients with NAFLD and 11 control subjects. They observed that the mtDNA/nDNA ratio was significantly lower in the liver of NAFLD patients than the liver of control subjects (21). In another study, Carlos et al. showed that patients with NAFLD (n = 90) have a significantly lower mtDNA copy number in fresh liver samples compared to control subjects (n = 23) (22). One possible reason for this contradictory result may be due to differences in sample size and ethnic diversity of participants. Moreover, several factors are likely to determine mtDNA copy number that could be a reason for these negative findings. This will be discussed more in the following.
In the recent years, several studies have demonstrated a possible association between mtDNA copy number and susceptibility to various disorders especially different cancer types. Both high and low levels of mtDNA copy number have been reported to be associated with an increased risk of malignancies. Elevated copy number was observed in tumor tissues of the breast, head, and neck cancers, lung cancer, papillary thyroid carcinoma, ovarian cancer, and prostate cancer (19, 25-29). The precise mechanism of increased risk of cancers and other pathologic situations with increased relative mtDNA copy number is not completely understood. However, multiple studies provided insights into the potential regulatory mechanism. Accumulating evidence suggests that elevated levels of mtDNA copy number could possibly be elucidated by an elevation in the level of oxidative stress markers (30, 31). Oxidative stress seems to be one of the major pathogenic mechanisms for progression of NAFLD (32). It has been shown that oxidant levels are significantly higher in NAFLD patients than healthy controls (33, 34). Mitochondria are the main target of attack by free radicals, and excessive ROS production may cause oxidative modifications of lipids and mtDNA damages (35). Several studies suggest that since mtDNA does not have protective histones and repair mechanisms; it is more prone to oxidative damage than nDNA (36). Therefore, increased mtDNA copy number could be resulted from a compensatory response to the cumulative exposures to oxidative damage that has been associated with NAFLD (31).
The finding that mtDNA copy number accumulates with age remains controversial. This study did not observe any association between mtDNA copy number and age. The results are in agreement with those of studies which failed to find a significant correlation between age and mtDNA copy number (37). However, some studies have found that mtDNA content is age-dependent and reported both positive and negative associations in this regard (38, 39).
To the best of our knowledge, there is no previous report on the association of the mtDNA 4,977-bp deletion with NAFLD. Our results showed that the 4977bp deletion was observed in 18.6% (8/43) of NAFLD patients, whereas this deletion was not detected in any of liver tissue samples obtained from the 20 control subjects. Several studies have found the mtDNA 4,977-bp deletion in various types of diseases (16, 17). The exact cause of the increased mtDNA deletion levels in different tissues remains unknown. Although, several lines of evidence indicated that oxidative stress inside mitochondria could be attributable to mtDNA large deletions (40). Further studies are needed to confirm this association and also evaluate oxidative stress-related factors that have an influence on mtDNA variations. Moreover, our results showed that the 4,977-bp deletion frequency was higher in NASH cases compared to NAFL patients. In addition, although the differences were not statistically significant, the research findings revealed that mtDNA content was higher in NAFL patients than NASH subjects. The decreases in mtDNA have been reported in the liver tissues of patients with NASH, whereas mtDNA content was shown to be significantly higher in patients with simple fatty liver (20). The reduced mtDNA level in NASH patients could induce progressive inflammation and fibrosis.
In conclusion, this case-control study indicated an association between mtDNA content in liver tissues and risk of subsequent development of NAFLD in a sample of Iranian population that might be a biological adaptation in the response to oxidative stress. This association requires to be confirmed in future investigations.