
1. Background
Non-alcoholic fatty liver disease (NAFLD), characterized by excessive accumulation of triglycerides in hepatocytes, is currently the most common chronic liver disease. It is etiologically associated with insulin resistance, obesity, and diabetes, and is considered a liver manifestation of metabolic syndrome (1, 2). Following the successful treatment of viral hepatitis and in line with the increasing prevalence of obesity, the number of patients with NAFLD is increasing rapidly worldwide (1, 3). Previous studies on the inflammatory process mediated by Non-alcoholic steatohepatitis (NASH) in mice have revealed the accumulation of neutrophils in the liver and the release of serine neutrophil protease mediators, such as neutrophil elastase (NE) in the blood circulation (4-6). Neutrophil elastase is a 29 kD protease deposited in azurophilic neutrophil granules that can be released in response to several inflammatory stimuli (5). It can be inhibited by alpha-1 antitrypsin (A1AT, also called serpinA1), endogenously. Alpha-1 antitrypsin is one of the most abundant sialoglycoproteins and protease inhibitors in the blood, encoded by the SERPINA1 gene on the long arm of chromosome 14. The reduced levels of A1AT in plasma as a severe classical form of alpha 1-antitrypsin deficiency (AATD), resulting from A1AT mutations, is an inherited disease that was defined first in patients with severe pulmonary emphysema (7, 8). The infiltration of neutrophils into the liver could predict fibrosis in patients with NAFLD, which is one of the important histological aspects of NASH (3, 9). A high plasma neutrophil elastase concentration has been documented in patients with NAFLD (10). A significant increase in the elastase-mediated insulin resistance has been reported in overweight individuals (3). In addition to the proteolytic degradation of neutrophil elastase, A1AT also has significant anti-inflammatory properties to inhibit TNF gene expression and prevent the migration of monocytes and neutrophils into human tissue when activated by lipopolysaccharides (11).
More than 90% of healthy subjects express normal M alleles and are considered to be PiMM. It is known that PiZ (rs28929474) and PiS (rs17580) are caused by the transition from G to A of nucleotide 11940 in exon 5 (Glu342Lys) and by transversion from A to T of nucleotide 9628 in exon 3 (Glu264Val) of the SERPINA1 gene (12, 13). The protease inhibitor (PI) system is used to explain a particular phenotype. In subjects with PiSS, PiMZ, and PiSZ genotypes, the A1AT plasma level dropped down to 60% of the normal range. This amount of A1AT is usually sufficient to maintain its levels at 15 µM, which is the critical point to proper functioning. However, in the PiZZ genotype, when the A1AT levels are below the lower normal range, patients are expected to develop cirrhosis-associated emphysema at an early age due to the accumulation of poorly folded A1AT in hepatocytes (8, 11, 14).
2. Objectives
The present study aimed to evaluate the circulating A1AT concentration and elastase activity as potential prognostic biomarkers in patients with NAFLD, as well as the A1AT most common deficient genotypes in terms of clinical outcomes in patients with NAFLD compared to healthy individuals.
3. Methods
3.1. Study Population
This observational study was conducted at the Department of Gastroenterology and Hepatology of Digestive Diseases Research Institute, Tehran, Iran, during the period from September 2014 to April 2016. Fifty-four patients who were diagnosed with NAFLD were included as the patient group. The inclusion criteria of this study were patients with increased plasma transaminase (ALT and AST) values, ultrasound (US) findings of fatty liver without evidence of cirrhosis and type-2 diabetes on treatment with insulin.
To provide a matched control group, 120 healthy controls were included using random sampling from the Health Examination Cohort. Since A1AT is an acute-phase protein, we excluded participants with alcohol consumption and any inflammatory condition, infections, viral hepatitis, use of hepatotoxic drugs, cancers, and pregnancy, as well as pulmonary diseases, metabolic or genetic diseases of the liver, kidneys, cardiovascular system, and diabetes. Physical examinations, anthropometric measurements, and blood biochemical tests were performed.
3.2. Ethical Considerations
Informed consent was taken from each patient and control subject. The study protocol was approved with ethics code 416/780 by the Institutional Review Board and the Ethics Committee of the Digestive Disease Research Institute, Shariati Hospital, Tehran University of Medical Sciences, in July 2014 in compliance with the Ethical Guidelines of the Declaration of Helsinki.
3.3. NAFLD Confirmation Using Ultrasonography
The presence of NAFLD was confirmed by a radiologist using an ultrasonographic fatty liver indicator (US-FLI) scoring system with a EUB-8500 scanner instrument, Hitachi Medical Corporation, Tokyo, Japan, after an 8 h overnight fasting. The US-FLI scores ranged from 2 to 8, based on the intensity contrast between the liver and right kidney, posterior attenuation of the ultrasound beam, and visualization of intrahepatic blood vessels, gallbladder wall, and diaphragm. In this study, NAFLD was diagnosed with a score of ≥ 2 (15).
3.4. Plasma Neutrophil Elastase Activity and A1AT Quantification
The A1AT concentration in plasma was determined using a commercially available Enzyme-Linked Immunosorbent assay (ELISA) kit (BioVendor, Heidelberg, Germany) according to the manufacturer’s instructions. Normal blood levels of A1AT may vary with the analytical method, but typically are about 100 - 300 mg/dL (1.0 - 2.7 g/L) (8). Plasma elastase activity was measured with N-methoxysuccinyl-Ala-Ala-Pro-Val p-nitroanilide (STANA, Sigma), a highly specific synthetic inhibition substrate for NE at 410 nm, according to the methods previously described by Adam and Bieth (16).
3.5. Genomic DNA Extraction and A1AT Genotyping
After centrifuging blood samples, buffy coats were manually separated. Genomic DNA was obtained from peripheral blood (EDTA anticoagulation) using the Gentra Puregene kit according to the manufacturer’s recommendations (Qiagen, Alameda, CA, USA). To recognize the two most important deficient variants of A1AT, S and Z, the Polymerase Chain Reaction (PCR) assay with specific primers and the creation of TaqI restriction sites (TCGA) was performed in the duplex mode as previously described (17). The primers used to distinguish the S mutation were 5-TGAGGGGAAACTACAGCACCTCG-3 and 5-AGGTGTGGGCAGCTTCTTGGTCA-3 and the primers for the Z mutation were 5-ATAAGGCTGTGCTGACCATCGTC-3 and 5-TTGGGTGGGATTCACCACTTTTC-3. Heterozygous and homozygous genotypes of the S and Z variants and the normal variant, M, were recognized based on the length of the fragment produced by TaqI.
3.6. Statistical Analysis
A student's t test was used for the comparison of the demographic and clinical data between the patient and normal groups. The Mann-Whitney rank-sum test was used to compare the plasma A1AT concentration and elastase activity between the two study groups. A p value of less than 0.05 was considered statistically significant. Continuous variables are expressed as mean (SD). Categorical variables are represented as absolute frequency and percentages. Multivariate logistic regression analysis was performed for the evaluation of NAFLD concerning the plasma level of A1AT and elastase activity.
4. Results
4.1. Basic Clinical Assessments
The demographic characteristics of the participants are shown in Table 1. The mean (SD) age of the participants was 57.3 (6.1) years in the NAFLD patient group and 58.2 (6.8) years in the control group. There was no significant difference in age and gender between the two groups (Table 1).
Table 1.
Basic Characteristics of Study Subjects with and Without Non-Alcoholic Fatty Liver Diseasea
| Variable | Controls (N = 120) | NAFLD Patients (N = 54) | P Value |
|---|---|---|---|
| Age, y | 58.2 ± 6.8 | 57.3 ± 6.1 | |
| Gender, % | |||
| Male | 60 (50) | 25 (46.3) | |
| Female | 60 (50) | 29 (53.7) | |
| Plasma elastase activity, U/mL | 1.3 (0.5) | 1.7 (0.5) | 0.01 |
| Alpha 1 anit-trypsin (A1AT), mg/dL | 244.6 (152.9) | 216.1 (171.3) | 0.01b |
| WBC × 109/L | 6.8 (1.5) | 6.9 (1.7) | 0.7625 |
| Platelet × 109/L | 252.9 (52.6) | 255.3 (57.1) | 0.7905 |
| Cholesterol, mg/dL | 203.2 (47.1) | 220.8 (39.1) | 0.7421 |
| TG, mg/dL | 153.2 (69.5) | 187.9 (84.7) | 0.19 |
| FBS, mg/dL | 111.3 (46.4) | 119.8 (55.8) | 0.2936 |
| US-FLI score | 0.9 (0.8) | 2.24 ± 1.92 | 0.01 |
| ALT, U/L | 21.1 (8.0) | 40.4 (12.8) | 0.002 |
| AST, U/L | 21.6 (10.8) | 24.3 (15.7) | 0.1983 |
Abbreviations: ALT, alanine aminotransferase; AST, aspartate aminotransferase; NAFLD, non-alcoholic fatty liver disease; TG, triglycerides.
aValues are expressed as No. (%) or mean ± SD.
bP value computed using two-sample Wilcoxon rank-sum (Mann-Whitney) test.
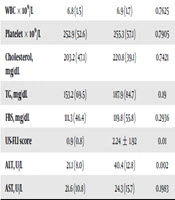
Patients with NAFLD had significantly higher plasma elastase activity (1.7 (0.5) vs. 1.3 (0.5) (U/mL), P = 0.01), serum ALT (40.4 (12.8) vs. 21.1 (8.0) (IU), P = 0.002), and US-FLI (2.24 (1.92) vs. 0.9 (0.8), P = 0, 01) than healthy controls. Healthy subjects without NAFLD showed significantly higher plasma levels of A1AT than patients with NAFLD (244.6 (152.9) vs. 216.1 (171.3) mg/dL, P = 0.01). There were no significant differences in FBS, WBC, platelet, cholesterol, triglyceride, and AST levels between the two study groups (Table 1). There was a positive association of elastase activity but an inverse association of A1AT levels with serum ALT (r = 0.31, P = 0.01 and r = -0.155, P = 0.02).
4.2. Multivariate Logistic Regression Analysis of Elastase and A1AT Variants
As shown in Table 2, the results of multivariate logistic regression analysis revealed that patients with NAFLD had significantly increased plasma elastase activity (OR, 10.10, 95% CI, 3.73 - 27.29, P < 0.001) and A1AT levels (OR, 1.003, 95% CI, 1.001 - 1.006, P = 0.004).
Table 2.
Association of Elastase and A1AT with NAFLD Using Multivariate Logistic Regression
| Group | Coef. | Std. Err. | OR | 95% CI | P |
|---|---|---|---|---|---|
| Elastase | 2.3 | 0.50 | 10.10 | 3.73 - 27.29 | < 0.001 |
| A1AT | 0.004 | 0.001 | 1.003 | 1.001 - 1.006 | 0.004 |
| Constant | -5.05 | 0.96 | 0.006 | 0.0009 - 0.042 | < 0.001 |
Abbreviations: CI, confidence interval; OR, odds ratio.
4.3. Genotyping Analysis of SERPINA1 Variants, rs28929474 (PiZ) and rs17580 (PiS)
The A1AT genotypes are reported in Table 3. No statistically significant differences were found in A1AT genotypes between the groups. Minor allele frequency (MAF, %) in subjects without NAFLD and patients with NAFLD was 2% and 2.7% for rs17580 (PiS) and 0.8% and 0.9% for rs28929474 (PiZ), respectively.
Table 3.
Genotype and Allele Frequency for rs28929474 (PiZ) and rs17580 (PiS) in NAFLD Patients and Controlsa
| Variantsb | Controls (N = 120) | NAFLD Patients (N = 54) | ||
|---|---|---|---|---|
| N | GF/AF, % | N | GF, % | |
| PiZ (rs28929474) | ||||
| Genotype | ||||
| GG PiMM | 118 | 98.3 | 53 | 98.1 |
| GA PiMZ | 2 | 1.7 | 1 | 1.8 |
| AA PiZZ | 0 | 0 | 0 | 0 |
| Allele | ||||
| G (ancestral) | 238 | 0.991 (99.1) | 107 | 0.99 (99.0) |
| A (minor) | 2 | 0.008 (0.8) | 1 | 0.009 (0.9) |
| PiS (rs17580) | ||||
| Genotype | ||||
| AA PiMM | 115 | 95.8 | 51 | 94.4 |
| AT PiMS | 5 | 4.2 | 3 | 5.5 |
| TT PiSS | 0 | 0 | 0 | 0 |
| Allele | ||||
| A (ancestral) | 235 | 0.979 (97.9) | 105 | 0.972 (97.2) |
| T (minor) | 5 | 0.020 (2.0) | 3 | 0.027 (2.7) |
aValues are expressed as No. (%).
bThe GG and AA genotypes correspond to PiM. The GA and AA variants are the genotypes coded on PiZ, while the AT and TT codes are the Pis variant.
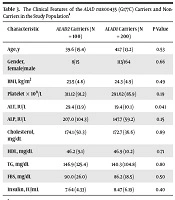
No homozygous carriers of PiSS or PiZZ or the combined heterozygous PiSZ genotype were found in the study groups. Heterozygous carriers of PiMZ and PiMS genotypes did not vary from non-carriers in serum ALT or US-FLI scores although they presented lower levels of A1AT than non-carriers (194.3 (49.1) vs. 252, 7 (158.6) mg/dL; P = 0.001).
5. Discussion
This study revealed an increase in plasma elastase activity independently in the NAFLD group and a reduction in plasma A1AT levels. Furthermore, the serum ALT level in patients with NAFLD was related to elastase activity, but had an inverse association with plasma A1AT levels.
Our results highlighted the importance of neutrophils and their released elastase in the pathogenesis of NAFLD. Being one of the most common causes of chronic liver damage, NAFLD is characterized by hepatocyte ballooning, as well as cytoskeletal and apoptotic changes in hepatocytes that may also increase the risk of cardiovascular disease (CVD) (15-20). The accumulation of neutrophils in the liver with elevated levels of immunoreactive neutrophil elastase explains inflammation in steatohepatitis. The imbalance between A1AT and elastase contributes to the development of obesity and relates to inflammation, insulin resistance, and steatosis of the liver (3). An increase in the neutrophil-to-lymphocyte ratio in addition to neutrophil elastase has been reported in steatohepatitis with advanced fibrosis. Neutrophil elastase along with AATD has shown to induce hepatic fibrosis with the onset of hepatic stellate cell proliferation in steatosis (5, 9). The systemic administration of AAT has shown to be a promising therapy for the treatment of acute liver failure (21). Similarly, the protective effects of A1AT in the prevention of atherosclerosis and aortic stiffness while maintaining elastic tissue have been attenuated in the common variants of A1AT (10, 22, 23).
The results of our study are consistent with the recent publication by Zang et al. (10) in which patients with NAFLD had a high serum neutrophil elastase concentration and a reduced A1AT level, which makes more sense for A1AT to be a neutrophil elastase inhibitor. We also clarified that the genotype and allele frequency belonged to PiZ and PiS in the Serpina1 gene. The PiZZ and PiMZ genotypes are known as genetic risk factors for cirrhosis and HCC (24). Although an increased risk of liver cirrhosis was seen in subjects with PiZZ (25), no homozygous PiZZ individuals were observed in this study, probably due to a relatively small size of the study groups. Likewise, the relevant AATD by the PiZ variant of A1AT was the strongest risk factor for cirrhosis in NAFLD (26).
Additional studies with follow-up of subjects are required to determine the importance of elastase and A1AT in the pathogenesis of NAFLD. In conclusion, the findings suggest that increased plasma elastase activity could be significant in evaluating the inflammatory processes of NAFLD. Furthermore, the prevalence of SERPINA1 variants for A1AT deficiency did not show a deviation from normal frequency; therefore, it was indifferent to NAFLD in our population study. However, we emphasize the measurement of serum A1AT phenotypes, which is a relatively easy and inexpensive method to exclude severe AATD and genetic counseling of affected individuals. Further studies with longitudinal follow-up of subjects with NAFLD are necessary to determine the impact of plasma elastase and A1AT on liver disease progression.