
1. Background
Colorectal cancer (CRC) is among the most prevalent cancers in both women and men (1). According to the global cancer observatory, the number of new CRC cases and deaths in Iran during 2018 was 9864 and 4083, respectively, thus making it the fourth most prevalent and the twelfth most lethal cancer in the country (2). The role of obesity in the development of CRC has previously been established and studies have shown that patients with a body mass index (BMI) higher than 30 have a substantially higher risk of developing this disease (3, 4). Reports are suggesting the prognostic role of BMI in colorectal cancer. However, its independent contribution to predicting survival and the response to treatments has yet to be defined.
Over the last decade, the role of obesity and BMI in CRC has been investigated by several observational and cross-sectional studies with conflicting results (5-7). Doleman et al.’s review article of 18 observational studies showed that both obese and underweight patients with CRC have a worse prognosis (8). A cohort study by Shahjehan et al. of 3799 Mayo Clinic CRC patients found that the influence of BMI on the prognosis of CRC is stage-dependent, i.e. no relationship in the early stages. In advanced stages, however, underweight was a significant predictor of a negative outcome (9). On the contrary, Alipour et al. reported no association between BMI and the outcomes of patients with stage II and III colon cancer (7).
2. Objectives
We aimed at determining the potential effects of BMI on the prognosis of patients with colorectal cancer.
3. Methods
The current retrospective cohort identified 920 patients with non-metastatic disease out of 1550 patients with colorectal cancer who had been treated at Omid hospital and Emam Reza hospital in Mashhad, Iran, between 2002 and 2020. Omid and Emam Reza hospitals are 2 referral hospitals for patients from northeast Iran and abroad.
The protocol of the study was approved by the Ethics Committee of Mashhad University of Medical Sciences (IR.MUMS.fm.REC.1395.441). Weight, height, gender, age, comorbidities, tumor location, tumor grade, tumor stage, disease-free survival (DFS), and overall survival (OS) were obtained by reviewing medical records. BMI was calculated by kg/m2. DFS and OS were defined based on the time interval between diagnosis and recurrence and death/last visit, respectively.
The tumor stage was described based on pathologic TNM staging of colorectal carcinoma (AJCC 7th edition).
Data was analyzed by SPSS v. 21 software using the chi-square test. Also, multivariable logistic regression and Cox proportional hazard regressions were utilized to examine the difference in the clinicopathologic and survival characteristics of postoperative patients with colorectal cancer in different BMI categories. A P-value less than 0.05 was considered significant.
4. Results
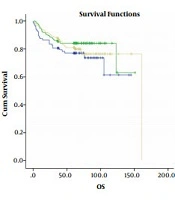
Nine hundred twenty patients were enrolled in the present research. Postoperative height and weight determined the classification of patients as underweight (n = 241, BMI > 20 kg/m2), normal weight (n = 358, BMI 20 - 25 kg/m2), and overweight/obese (n = 170, BMI > 25 kg/m2). Table 1 provides a summary of the demographic data. Overweight patients significantly suffered more from ischemic heart disease (P = 0.05) and diabetes (P = 0.01). With all stages combined, the mean overall survival for underweight, normal weight, and overweight/obese patients were 108.2 ± 7.0 months, 124.0 ± 6.2 months, and 130.9 ± 4.5 months, respectively (P = 0.2) and the mean disease-free survival was 97.0 ± 6.5, 110.0 ± 5.6, and 113.7 ± 5.0, respectively (P = 0.3). The current study reported a trend in which the overweight patients have better overall -and disease- free survival in comparison with the underweight group (HR = 1.14, P = 0.367 and HR = 1.10, P = 0.883, respectively) (Tables 2 - 4 and Figure 1).
Table 1.
Demographic Characteristics of Patients a
| BMI | Underweight | Normal | Overweight/ Obese | P-Value |
|---|---|---|---|---|
| Age (y) | 0.07 | |||
| < 40 | 45 (31) | 63 (43.4) | 37 (25.5) | |
| 41-75 | 169 (24.6) | 261 (38) | 257 (37.4) | |
| >75 | 26 (29.9) | 34 (39.1) | 27 (31) | |
| Sex | 0.01 | |||
| Male | 147 (28) | 215 (41) | 163 (31) | |
| Female | 94 (23.8) | 143 (36.2) | 158 (40) | |
| Tumor location | 0.4 | |||
| Colon | 87 (27.6) | 127 (40.3) | 101 (32.1) | |
| Rectum | 127 (26.1) | 179 (36.8) | 180 (37) | |
| Both | 27 (22.7) | 52 (43.7) | 40 (33.6) | |
| Tumor grade | 0.2 | |||
| 1 | 71 (22) | 134 (41.5) | 118 (36.5) | |
| 2 | 70 (25.9) | 109 (40.4) | 91 (33.7) | |
| 3 | 16 (35.6) | 19 (42.2) | 10 (22.2) | |
| Tumor stage | 0.6 | |||
| 1 | 6 (37.5) | 4 (25) | 6 (37.5) | |
| 2 | 41 (26.8) | 61 (39.9) | 51 (33.3) | |
| 3 | 107 (25.4) | 170 (40.4) | 144 (34.2) | |
| 4 | 17 (22.7) | 37 (49.3) | 21 (28) | |
| Hypertension | 12 (16.9) | 27 (38) | 32 (45.1) | 0.08 |
| Ischemic heart disease | 7 (15.6) | 15 (33.3) | 23 (51.1) | 0.05 |
| Diabetes | 2 (5.9) | 15 (44.1) | 17 (50) | 0.01 |
Abbreviation: BMI, body mass index.
a Values are expressed as No. (%) unless otherwise indicated.
Table 2.
Disease-free Survival and Overall Survival in Patients with Colorectal Cancer with Different Body Mass Indices a
| BMI | DFS | OS |
|---|---|---|
| Underweight | 97.017 (6.505) | 108.286 (7.047) |
| Normal weight | 110.052 (5.613) | 124.019 (6.206) |
| Overweight | 113.796 (5.038) | 130.995 (4.506) |
| logRank | 1.531 | 2.793 |
| P-value | 0.4 | 0.2 |
Abbreviations: DFS, disease-free survival; OS, overall survival.
a Values are expressed as mean (SD) unless otherwise indicated.
Table 3.
Risk of Tumor Recurrence in Patients with CRC According to BMI a
| Variables | P-Value | HR | 95% CI for HR | |
|---|---|---|---|---|
| Lower | Upper | |||
| BMI | ||||
| Underweight | 0.883 | 1.102 | 0.432 | 2.812 |
| Overweight | 0.767 | 0.948 | 0.464 | 1.937 |
| Age (y) | ||||
| 41 - 75 | 0.601 | 0.659 | 0.138 | 3.143 |
| > 75 | 0.859 | 0.895 | 0.261 | 3.071 |
| Sex | ||||
| Male/female | 0.286 | 1.415 | 0.748 | 2.677 |
| Location | ||||
| Rectum vs colon | 0.850 | 0.913 | 0.354 | 2.355 |
| Grade | ||||
| 1 vs 2 | 0.056 | 0.286 | 0.079 | 1.030 |
| 1 vs 3 | 0.179 | 0.424 | 0.121 | 1.483 |
| Tumor Stage | ||||
| 1 vs 2 | 0.969 | 0 | 0 | 0 |
| 1 vs 3 | 0.017 | 0.274 | 0.095 | 0.791 |
| 1 vs 4 | 0.018 | 0.362 | 0.156 | 0.840 |
| Comorbidity a | ||||
| 1 vs >1 | 0.006 | 0.355 | 0.171 | 0.738 |
Abbreviation: CRC, colorectal cancer; BMI, body max index; HR, hazard ratio.
a Presence of comorbidity of at least 2 or more.
Table 4.
Risk of Death in Patients with CRC According to BMI
| Variables | P-Value | Hazard Ratio (HR) | 95.0 % for HR | |
|---|---|---|---|---|
| Upper | Lower | |||
| BMI | 0.632 | |||
| Underweight | 0.367 | 1.147 | 0.515 | 2.553 |
| Overweight | 0.936 | 0.977 | 0.559 | 1.708 |
| Age (y) | 0.557 | |||
| 41 - 75 | 0.306 | 0.569 | 0.194 | 1.673 |
| > 75 | 0.610 | 0.800 | 0.340 | 1.884 |
| Sex | ||||
| Male, female | 0.181 | 1.350 | 0.870 | 2.094 |
| Tumor location | 0.883 | |||
| Rectum vs colon | 0.760 | 1.112 | 0.562 | 2.199 |
| Grade | 0.059 | |||
| 1 vs 2 | 0.02 | 0.355 | 0.145 | 0.865 |
| 1 vs 3 | 0.098 | 0.474 | 0.195 | 1.149 |
| Tumor stage | 0.201 | |||
| 1 vs 2 | 0.953 | 0.0 | 0.0 | 0.0 |
| 1 vs 3 | 0.036 | 0.434 | 0.199 | 0.946 |
| 1 vs 4 | 0.073 | 0.551 | 0.287 | 1.057 |
| Comorbidity a | ||||
| 1 vs < 1 | 0.033 | 0.550 | 0.318 | 0.952 |
Abbreviations: CRC, colorectal cancer; BMI, body max index; HR, hazard ratio.
a Presence of comorbidity of at least 2 or more.
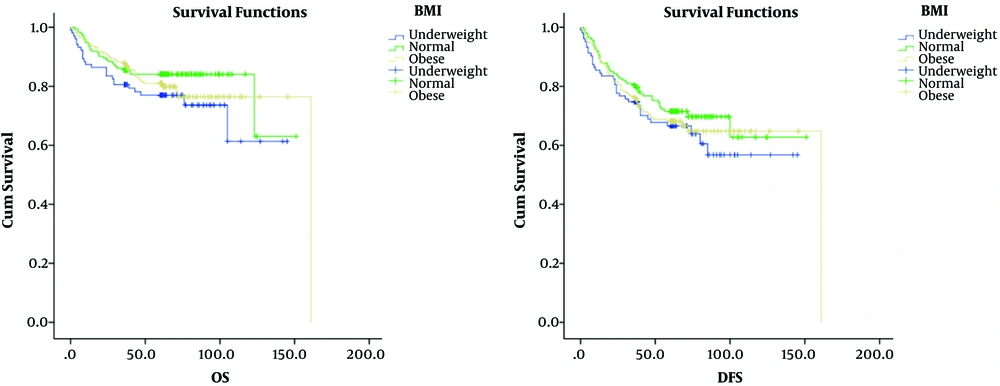
Figure 1.
OS and DFS based on BMI
5. Discussion
The role of obesity as a modifiable risk factor in the development of CRC has been previously established. However, there are conflicting results regarding its prognostic and predictive role in patients with CRC (5-7). The present research is a large population-based cohort study involving more than 900 patients suffering from non-metastatic CRC. A long-term 18-year follow-up was conducted and reported that obesity (estimated based on BMI) bears no relationship to outcomes. A subgroup analysis revealed a trend in which the overweight patients had a better overall and disease-free survival in comparison to the underweight group.
The current paper’s findings are supported by other clinical trial-based and non-clinical trial-based studies that evaluated the prognostic role of obesity in CRC patients. Chin et al. assessed the role of BMI in 2138 Taiwanese CRC patients. Although their results showed that DFS and OS were worse in underweight patients, a multivariate reported that obesity did not predict a worse survival (10). Evaluating the association between BMI and the outcomes of 913 Canadian Stage II-III CRC patients, Alipour et al. found that survival rates were similar among patients in different BMI categories, a result confirmed by multivariate regression analysis (7). Similar to the present study, Chin et al. and Alipour et al. assessed non-clinical trial patients (7, 10). Results from the intergroup trial 0114 and the cancer and leukemia group B 89803 also support the current study’s findings (11, 12). Studying the impact of BMI on patients with rectal cancer enrolled in the intergroup trial 0114, Meyerhardt et al. showed that, according to body mass index classes, the 5-year survival and cancer recurrence were similar (12). Meyerhardt et al. conducted another study on patients with stage III colon cancer enrolled in the cancer and leukemia group B 89803 trial, which was a randomized clinical trial comparing types of adjuvant chemotherapy. They found no relationship between BMI and risk of death, OS, and DFS (11). Of note, the present study’s results differ from those of Doleman et al.’s systematic review and meta-analysis of 18 observational studies, which showed significantly higher mortality rates in obese and underweight CRC patients (8). On the other hand, some studies have recognized a stage-based relationship between BMI and the prognosis of CRC patients. A cohort study by Shahjehan et al. on 3,799 Mayo Clinic CRC patients reported that the influence of BMI on the prognosis of CRC is stage-dependent, i.e. no relationship between BMI and survival rates in early stages. In advanced stages, however, the study found underweight to be a significant negative predictor of outcomes (9). Moreover, in an assessment of 633 women, Doria-Rose observed that underweight postmenopausal women with colon cancer were at an increased risk of death (13). It is noteworthy that the potential underlying malnutrition of underweight patients can influence outcomes, thus rendering underweight as a poor prognosis factor for the long-term survival of colorectal cancer after a curative operation (14, 15). Furthermore, malnutrition in underweight patients with colorectal cancer lowers patient compliance in completing treatment that may impact their survival (16).
The interaction between obesity and the prognosis of CRC patients is a matter of complex processes. These interactions are more pronounced in hormone-related cancers including those of the breast and ovaries. The results of Hebert et al.’s report indicated that patients with breast cancer with obesity were at a higher risk of recurrence (17). Similar results were reported in obese patients with ovarian cancer (18). Since adipose tissue acts as an endocrine modulator in the human body, obesity is thought to induce a hormonal change in the body which alters the level of sex hormones, insulin, and the insulin-like growth factor-1 (19, 20). Therefore, besides changes in BMI during the treatment and follow-up of CRC patients, future studies should pay greater attention to the baseline levels of these hormones and their fluctuation.
As its main strength, the present work is a large-scale population-based study providing data from real-world evidence outside of clinical trials. However, its retrospective approach and possible biases due to the nature of such studies can be considered as its main limitation. Moreover, the current research only assessed outcomes based on patient BMI from the initial consultation visit and so any changes in BMI and how they may influence patient prognosis were not addressed.
In conclusion, the present study showed that BMI had no significant effect on the long-term outcomes of patients with colorectal cancer. However, there was an insignificant trend to a better outcome in patients with higher BMI comparing the underweight group, a subject recommended for future study.