
1. Background
Breast cancer is the most frequent diagnosed solid cancer and accounts for, approximately, one-third of all cancers in women and the second leading cause of cancer-related death in women, all over the world (1).
Breast cancer, among Iranian women, comprises 25% of all cancer new cases. There are 9,795 new cases, annually, in Iran, based on the cancer registry system, with 24.8% distribution among the most prevalent cancer types in women (2).
Breast cancer is a heterogeneous disease, clinically, affected by a variety of risk factors, such as tumor size, lymph node involvement, estrogen, and progesterone; human epidermal growth factor receptor 2 (HER2) receptors are prognostic factors with important roles in recurrence, metastasis, and the death of patients with breast cancer (3).
There still remain controversies on the definition of “very young age”. International multicenter clinical trials considered 35 years as the age boundary (4). In western countries, breast cancer is uncommon in very young women and accounts for only fewer than 4% (5); however in Asian countries, the incidence rate is up to 9.5% to 12%, which is significantly higher than western countries.
Since now, whether age is an independent prognostic factor remains a controversy with few well-designed studies, investigating in this group. Nevertheless, the limit results still show that very young patients with breast cancer have worse outcomes compared with patients with their peers with more than 35 years (6).
To date, studies on very young (age ≤ 35 years) Iranian women with breast cancer have been limited by small sample sizes and short follow-up duration. In the current study, we retrospectively, investigated the incidence and clinicopathological profiles of 597 patients with breast cancer in Shahid Beheshti University of Medical Sciences Cancer Research Center, Iran. We also compared these factors between 2002 and 2014 among very young patients and patients with age more than 35 years.
2. Methods
Medical records of 1,900 teenager patients with breast cancer treated in Shahid Beheshti University of Medical Sciences Cancer Research Center between September 2002 and December 2014 were reviewed. A total of 199 patients (10.4%) with breast cancer were identified as very young group (age ≤ 35 years, group A) and 1,711 patients (89.6%) as not very young group (age > 35 years). Of patients with age > 35 years, 398 patients (group B) were selected and matched based on a time- stratified 2:1 approach (patients were matched by date of diagnosis). Finally, 597 patients with breast cancer were selected for the present study.
We excluded patients who had not followed up after initial diagnosis. Breast cancer diagnosis was made by biopsy or surgery of the breast tumor.
Patients’ information, such as age at diagnosis (in years), tumor type, tumor grade, lymph vascular invasion (LVI), lymph node positive or negative, the number of pathologic lymph node involvement, pathologic tumor size, staging, type of surgery (breast conserving surgery or modified radical mastectomy), follow up duration, recurrence (if present), and hormone receptor status were recorded.
Immunohistochemical (IHC) analysis was performed to determine estrogen (ER) and progesterone receptor (PR) status, using standard procedures on paraffin embedded tissue specimens stained. Over-expression of HER2 status would have been determined positive if HER2 was 3 + by IHC and negative if HER2 score was 0 or 1. Confirmation was carried out by Flourescence in‑situ hybridisation (FISH) for all those with receptor status 2 +.
Once the treatment was completely over, the patients with breast cancer were examined every 3 to 6 months for 5 years, and annually afterwards. In case of clinical suspicion or detection of any symptoms, patients would have undergone tests to identify recurrence; patients were followed up until April, 2015. Progression free survival (PFS) was determined as the time interval among diagnosis and recurrence.
The ethical regulations dictated in the act provided by Shahid Beheshti University of Medical Sciences (reference number of research ethics committee: IR.SBMU.MSP.REC.1395.390) were strictly observed, and the retrospective cohort review of the medical records was approved for the purposes of this study.
Differences in categorical variables were analyzed, using the Chi-square test. PFS rates were estimated by Kaplan-Meier analysis and compared by Log-rank test. The associations between independent variables and PFS were evaluated by cox regression analysis. The variables, which were found to be significant by univariable analysis, were entered into multivariable analysis. A forward stepwise procedure was applied with a cutoff P value of 0.05 for inclusion of variables in the model and a cutoff P value of 0.1 for exclusion from the model. A P value < 0.05 (2-sided test) was considered significant. All statistical analyses were performed, using the IBM SPSS Statistics for Windows, Version 22.0 (IBM Corp., Armonk, N.Y., USA).
3. Results
The mean age of the patients (± standard deviation) was 32 years (17 - 35 years) in group A and 49 years (36 - 86 years) in group B. In group A, 171 patients (86%) had infiltrating ductal carcinoma, 22 patients (11%) had other pathology except infiltrating ductal carcinoma, and 6 patients (3%) were with unknown pathology reports. In group B, 338 patients (85%) had infiltrating ductal carcinoma, 50 patients (12.5%) had other pathology except infiltrating ductal carcinoma, and 10 patients (2.5%) were with unknown pathology reports.
Seventy-nine patients (40%) were grade III, 81 patients (41%) were grade II, 15 (7%) were grade I, and 24 patients (12%) were with unknown grade in group A. Likewise, 111 patients (28%) were grade III, 216 patients (54%) were grade II, 32 (8%) were grade I, and 39 (10%) were with unknown grade in group B. Lymph vascular invasion was found in 78 patients (39%) and 152 patients (38%) in group A and B, respectively.
Regarding the lymph node involvement, in group A, 84 patients (42%) had pathologic negative lymph nodes, 59 patients (30%) had 1 - 3 pathologic positive lymph nodes, 50 patients (25%) had ≥ 4 pathologic positive lymph nodes, and 6 patients (3%) were with unknown pathologic lymph nodes. In group B, 118 patients (30%) had pathologic negative lymph nodes, 150 patients (38 %) had 1 - 3 pathologic positive lymph nodes, 89 patients (22%) had ≥ 4 pathologic positive lymph nodes, and 41 patients (10%) were with unknown pathologic lymph nodes.
In group A, 124 patients (62%) had tumor size ≤ 5 cm, 31 patients (16%) had tumor size > 5 cm, and 44 patients (22%) were with unknown tumor size. A total of 266 patients (67%) had tumor size ≤ 5 cm, 24 patients (6%) had tumor size>5 cm, and 108 patients (27%) were with unknown tumor size in group B.
According to TNM (Tumor, Node, Metastatis) staging, in group A, 20 patients (10%) had stage I, 76 patients (38%) had stage II , 76 (38%) had stage III, 8(4%) patients had stage IV at first diagnosis, and 19 patients (10%) with unknown stage. According to TNM staging, in group B, 35 patients (9%) had stage I, 216 patients (54%) had stage II, 122 (31%) had stage III, 5 (1%) patients had stage IV at first diagnosis, and 20 patients (5%) with unknown stage.
After breast cancer diagnosis, surgical treatment was performed in all patients. A total of 111 patients (56%) underwent breast conserving surgery, 76 patients (38%) underwent modified radical mastectomy, and 12 patients (6%) were with unknown surgery in group A. In group B, 239 patients (60%) underwent breast conserving surgery, 135 patients (34%) underwent modified radical mastectomy, 4 patients (34%) underwent subcutaneous mastectomy, and 20 patients (5%) were with unknown surgery.
Regarding the hormone receptor status, in group A, 114 (57%) patients were ER positive, 62 patients (31%) were ER negative, and 23 (12%) patients were with unknown ER receptor status. In group B, 259 patients (65%), 94 patients (24%), and 45 patients (11%) were with ER positive, ER negative, and unknown ER receptor status, respectively.
Regarding PR receptor status, in group A, 103 patients (52%) were PR positive, 72 patients (36%) were PR negative, and 24 patients (12%) were with unknown PR receptor status. In group B, 242 patients (60%), 110 patients (28%), and 46 patients (12%) were with PR positive, PR negative, and unknown PR receptor status, respectively.
In group A, 45 patients (22.7%) had HER 2 positive, 120 patients (60.3%) had HER 2 negative, and 34 patients (17%) were with unknown HER 2 status. In group B, 86 patients (21.7%) had HER 2 positive, 244 patients (61.3%) had HER 2 negative, and 68 patients (17%) were with unknown HER 2 status. Table 1 summarizes baseline characteristics and the clinical-pathological features of 597 adult patients with breast cancer.
Table 1.
Baseline Characteristics and the Clinical-Pathological Features of 597 Adult Patients with Breast Cancera
| Characteristics | Group A, ≤ 35 y (n = 199) | Group B, > 35y (n = 398) |
|---|---|---|
| Age, median (range), y | 32 (17 - 35) | 49 (36 - 86) |
| Tumor histology | ||
| IDC | 171 (86) | 338 (85) |
| Others | 22 (11) | 50 12.5) |
| Unknown | 6 (3) | 10 (2.5) |
| Surgery type | ||
| BCS | 111 (56) | 239 (60) |
| MRM | 76 (38) | 135 (34) |
| Subcutaneous mastectomy | 0 (0) | 4 (1) |
| Unknown | 12 (6) | 20 (5) |
| Tumor size | ||
| ≤ 5 | 124 (62) | 266 (67) |
| > 5 | 31 (16) | 24 (6) |
| Unknown | 44 (22) | 108 (27) |
| Nodal status | ||
| Node-negative | 84 (42) | 118 (30) |
| 1 - 3 positive nodes | 59 (30) | 150 (38) |
| ≥ 4 positive nodes | 50 (25) | 89 (22) |
| Unknown | 6 (3) | 41 (10) |
| Tumor Stage | ||
| I | 20 (10) | 35 (9) |
| II | 76 (38) | 216 (54) |
| III | 76 (38) | 122 (31) |
| IV | 8 (4) | 5 (1) |
| Unknown | 19 (10) | 20 (5) |
| Tumor grade | ||
| Well differentiated | 15 (7) | 32 (8) |
| Moderately differentiated | 81 (41) | 216 (54) |
| Poorly differentiated | 79 (40) | 111 (28) |
| Unknown | 24 (12) | 39 (10) |
| LVI | ||
| Positive | 78 (39) | 152 (38) |
| Negative | 87 (44) | 189 (48) |
| Unknown | 34 (17) | 57 (14) |
| Receptor status | ||
| ER positive | 114(57) | 259(65) |
| ER negative | 62 (31) | 94 (24) |
| Unknown | 23 (12) | 45 (11) |
| PR positive | 103(52) | 242(60) |
| PR negative | 72 (36) | 110 (28) |
| Unknown | 24 (12) | 46 (12) |
| HER2 positive | 45(22.7) | 86(21.7) |
| HER2 negative | 120(60.3) | 244 (61.3) |
| Unknown | 34 (17) | 68 (17) |
aValues are expressed as No. (%).
According to univariate cox regression progression analysis, 5 factors had a statistical significant relationship with progression in both groups. These 5 factors, determined by univariate analysis (Table 2), are listed here: 1) Age ≤ 35 years versus age > 35 years (P < 0.001), Odds ratio (OR) = 3.96, 95% confidence interval (CI) = 2.52 - 6.22, 2) Positive LVI versus negative LVI (P < 0. 001, OR = 2.63, 95% CI = 1.56 - 4.42, 3) Grade III versus grade I of tumor at diagnosis (P = 0.04, OR = 2.90, 95% CI = 1.01 - 8.30), 4) Tumor size > 5 cm versus tumor size ≤ 5 cm at diagnosis (P = 0.002, OR = 2.48, 95% CI = 1.41 - 4.37), and 5) Stage III and stage IV at diagnosis versus stage I and stage II (P = 0. 001, OR = 2.13, 95% CI = 1.35 - 3.36). Then, the unfavorable prognostic factors in the present study, based on univariate analysis in both groups, were as follow: age ≤ 35 years, grade III of tumor, positive LVI, Tumor size > 5 cm, and stage III, stage IV at diagnosis (Table 2). Based on the univariate analysis, there were no statistical significant relationships between progression and nodal status ≥ 4 positive versus negative, ER negative versus positive, PR negative versus positive, HER 2 negative versus positive, and breast conserving surgery versus modified radical mastectomy (Table 2).
Table 2.
Univariable Analysis Between the Candidate Prognostic Factors and Progression in 597 Breast Cancer Patients (Cox-Regression)
| Candidate Prognostic Factor | Odds Ratio (CI) | P Value |
|---|---|---|
| Age | 3.96 (2.52 - 6.22) | < 0.001 |
| ≤ 35 y vs. > 35y | ||
| Tumor size | ||
| > 5 cm vs. ≤ 5 cm | 2.48 (1.41 - 4.37) | 0.002 |
| Nodal status | ||
| positive vs. negative | 1.15 (0.69 - 1.79) | 0.652 |
| Nodal status | ||
| ≥ 4 positive vs. negative | 1.58 (0.92 - 2.70) | 0.09 |
| Stage | ||
| III-IV vs. I-II | 2.13 (1.35 - 3.36) | 0.001 |
| Grade | ||
| Poorly diff. Vs. well diff. | 2.90 (1.01 - 8.30) | 0.04 |
| LVI | ||
| Positive vs. negative | 2.63 (1.56 - 4.42) | < 0.001 |
| ER | ||
| Negative vs. positive | 1.17 (0.70 - 1.96) | 0.537 |
| PR | ||
| Negative vs. positive | 1.45 (0.89 - 2.38) | 0.132 |
| Her2 | ||
| Negative vs. positive | 1.54 (0.83 - 2.86) | 0.163 |
| Surgery type | ||
| BCS vs. MRM | 0.82 (0.51 - 1.31) | 0.413 |
Abbreviation: CI, Confidence Interval.
The multivariate analysis indicated that 3 factors had a statistical significant relationship with progression in both groups: 1) Age ≤ 35 years versus age > 35 (P < 0. 001, OR = 3.53, 95% CI = 2.18 - 5.63), 2) Positive LVI versus negative LVI (P = 0.002, OR = 2.39, 95% CI = 1.39 - 4.11), and 3) Stage III ,stage IV at diagnosis versus stage I, stage II (P = 0.037, OR = 1.64, 95% CI = 1.02 - 2.61) (Table 3).
Table 3.
Multivariable Analysis Between the Prognostic Factors and Progression (Cox-Regression)
| Candidate Prognostic Factor | Odds Ratio (CI) | P Value |
|---|---|---|
| Age | ||
| ≤ 35 y vs. > 35y | 3.53 (2.18 - 5.63) | < 0.001 |
| LVI | ||
| Positive vs. negative | 2.39 (1.39 - 4.11) | 0.002 |
| Stage | ||
| III-IV vs. I-II | 1.64 (1.02 - 2.61) | 0.037 |
In group A, more tumors were classified than group B, as tumor was size > 5 cm (20% versus 8.3%) (P < 0.001). They also had more tumors with grade III (poorly differentiated tumors) than group B (45.1% versus 31%) (P = 0.001). Patients in group A had more tumors classified than group B, as stage III and IV (46.7% versus 33.5%) (P = 0.003) despite less positive nodes in very young patients than patients with age > 35 years (56% versus 67.6%, respectively) (P = 0.007). Table 4 shows a comparison of clinical and pathological features between group A and group B.
Table 4.
Comparison of Clinical Features Between Group A and Group B Breast Cancer (Patients with Unknown Prognostic Factors Were Deleted in Both Groups)
| Candidate Prognostic Factor | Group A, ≤ 35 y, No. (%) | Group B, >35y, No. (%) | P Value |
|---|---|---|---|
| IDC histology | 171/193 (88.6) | 338/388 (87.1) | 0.608 |
| Tumor size > 5 cm | 31/155 (20) | 24/289 (8.3) | < 0.001 |
| positive nodes | 108/193 (56) | 240/355 (67.6) | 0.007 |
| ≥ 4 positive nodes | 50/193 (25.9) | 89/355 (25.1) | 0.830 |
| Stage III-IV | 84/180 (46.7) | 125/373 (33.5) | 0.003 |
| Grade III | 79/175 (45.1) | 111/358 (31) | 0.001 |
| LVI Positive | 78/165 (47.3) | 152/341 (44.6) | 0.568 |
| ER Negative | 62/176 (35.2) | 94/353 (26.6) | 0.041 |
| PR Negative | 72/175 (41.1) | 110/352 (31.3) | 0.024 |
| Her2 Negative | 120/165 (72.7) | 244/330 (73.9) | 0.773 |
Regarding the hormone receptor status, patients with age ≤ 35 years had higher ER negative (35.2% versus 26.6%) than patients with age > 35 years (P = 0.041); very young patients had higher ER negative (41.1% versus 31.3%) than patients with age > 35 years (P = 0.024).
There were no statistical significant differences as invasive ductal histology, nodal status≥4 positive nodes, HER2 negative, and LVI positive among very young patients and patients with age > 35 years (Table 4).
The mean follow-up time was 50 months (12 - 332 months). In group A, 33.5% of patients were with recurrences at 5 years of follow up and 10.8% of patients in group B were with recurrence at 5 years of follow up. The 5 years progression free survival (PFS) rate was 66% and 91% in group A and B, respectively (P < 0.001) (Table 5). Figure 1 shows Kaplan-Meier curve of 5 years PFS in group A and B. According to log-rank test 5-year PFS analysis, there was a significant relationship with the 5-year PFS and age ≤ 35 years (group A) and age > 35 years (group B) (P < 0.001). Then, regarding age, very young group (A) showed worse 5-year PFS than not very young group (B).
Table 5.
Comparison of the Five Years Progression Free Survival (PFS) Rate Between Group A and Group B Breast Cancera
| Variables | Included Patients, No | 5-year PFS Rate, % | Progression During 5-Years, No. (%) | P Value (Log-Rank Test) |
|---|---|---|---|---|
| Group A Age ≤ 35 y | 146 | 66 | 49 (33.5) | < 0.001 |
| Group B Age > 35y | 287 | 91 | 31 (10.8) |
aPatients with unknown prognostic factors were deleted in both groups
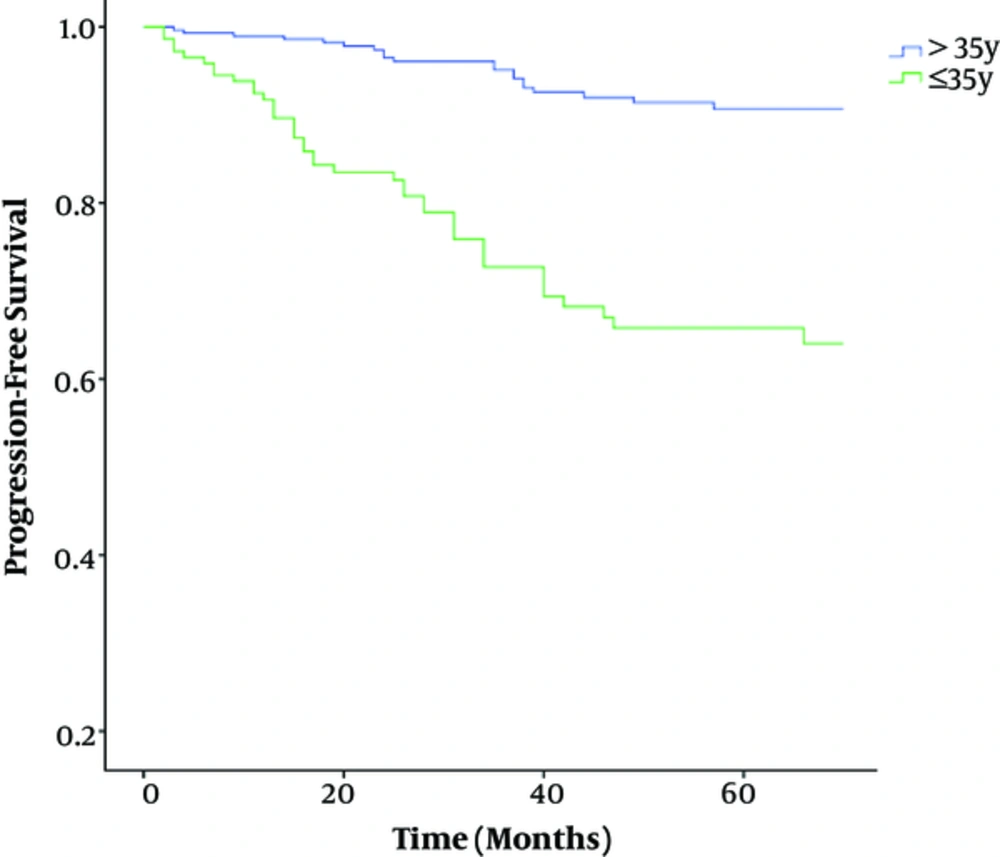
Figure 1.
Comparison of PFS Between Group A (Age ≤ 35 Years) and Group B (Age > 35 Years) Breast Cancer (P < 0.001) (Kaplan-Meier Curve)
A highly significant association was found between the progression and death in this retrospective cohort study (P < 0.001, OR = 56, 95% CI = 13 - 236). Once we analyzed the groups A and B according to age, very young group (A) showed worse outcomes and more deaths than less young group (B).
4. Discussion
The present study was conducted at Shahid Beheshti University of Medical Sciences Cancer Research Center with analyzed clinical, pathological, epidemiological characteristics. Moreover, very young patients and less young patients were compared with each other. To the best of the researcher’s knowledge, no report has evaluated these factors in Iranian population. The current study represents a large retrospective cohort review of 597 patients with a diagnosis of breast cancer in Shahid Beheshti University of Medical Sciences Cancer Research Center, which is, to the best of our knowledge, the largest series in Iran.
Of 1,910 breast patients diagnosed with breast cancer, 199 patients were identified having age ≤ 35 years (10.4%). In the west countries, approximately 4% of patients with breast cancer were identified with age ≤ 35 years. However, some studies have suggested that its incidence differs between countries and races. For instance, in Asian countries, the incidence rate is up to 9.5% to 12%, which is higher than Western countries (7). The findings of Asian study were consistent with our findings with incidence rate of 10.4% (7).
Consensus has been reached that breast cancer in very young age is different from not very young age. Young patients often show more aggressive biologic behavior, such as advanced stage, less ER and PR positive expression, higher histological, grade and more LVI invasion (8).
Gajdos et al. found that patients with breast cancer with age ≤ 35 years had more frequently presented tumors with large tumor size, advanced stage, and node positive (9). These findings were consistent with the present study, showing that women with stage III, stage IV, and tumor size > 5 cm were more frequently seen in group with age ≤ 35 years than among patients with breast cancer with age > 35 years (P = 0.003 and P < 0.001, respectively), and were inconsistent and convers with our findings, showing that patients with breast cancer with age>35 years had node positive than patients breast cancer with age ≤ 35 years (67.6% versus 56%, respectively) (P = 0.007).
Meng J et al. pathologically showed very young patients with breast cancer had a higher histological grade in primary tumors (10). Similarly, in our series, 45.1% of very young patients had grade III of tumor (poorly diff tumors), but 31% of patients with age > 35 years had grade III of tumor and these difference was statistical significant (P = 0.001).
Xue-Qing Wei showed that very young patients did not have more invasive ductal histology than patients with age > 35 years (83.9% vs. 83.9%, P = 0.997) (11). These findings were consistent with our study, indicating that women with age ≤ 35 years did not have more invasive ductal histology, and the difference was not significant for patients with age > 35 years (88.6% versus 87.1%, P = 0.608).
Ahn et al. found (12) that ER negativity in patients with age ≤ 35 years, than patients with age > 35 years (35.2% versus 26.6%, P = 0.041) and more PR negativity in very young patients than not very young patients (41.1% versus 31.3%, P = 0.024).
Xue-Qing Wei showed that patients with age ≤ 35 years patients tended to be more HER2 over-expression, and the difference was significant for patients with age > 35 years (49.2% vs. 32.5%, P = 0.000). These findings were inconsistent with our study, confirming that women with age ≤ 35 years patients did not tend to be more HER2 over-expression; the difference was not significant for patients with age > 35 years (27.3% versus 26.1%, P = 0.773).
The result of present study showed very young patients and not very young patients had significant difference in 5-year PFS rate (66% vs. 91%, P < 0.001). Similar tendency could be observed in other studies. Kothari et al. (2002) compared the prognosis of very young patients and patients with age ≥ 35 years, and found that the 5-year PFS rate was remarkably lower in very young patients than not very young patients (13). Chung M et al. also showed younger women with breast carcinoma had a poorer prognosis than older (14, 15), but Muscolino G et al. found young age is not an ominous prognostic factor in patients with breast cancer (16, 17)
4.1. Conclusions
In conclusion, the results of current study suggested that incidence rate of breast cancer in very young Iranian women is 2.5 times higher than the incidence rate in west countries women, but is equal with incidence rate in Asian countries; compared with not very young breast cancer, very young patients have advanced pathologic stage, primary large tumors, more poorly differentiated grades of tumors, lower ER and PR expression, and shorter 5-years PFS.
According to the findings of this study, a better understanding of invasive tumor features in very young patients with breast cancer together with the risk factors in individual patients can lead to individual treatments not general guidelines. Future research can be conducted on investigating more young patients with breast cancer as well as treatment types.