
1. Background
According to the World Health Organization (WHO), cancer is the second leading cause of death globally (1). Thyroid cancer, the most frequent endocrine malignancy, affected roughly half a million people worldwide in 2020, with an 8% fatality rate (2), comparable to rates seen in Southeast Asia and North Africa (3). The increasing prevalence of thyroid cancer is attributed to improved primary tumor diagnosis, individual risk factors such as obesity, and environmental exposures, including radiation incidents and pollution (2). Around 90% of thyroid cancer-related fatalities occur in affected individuals; therefore, the early diagnosis of tumor recurrence is crucial for enhancing the quality of life in patients with thyroid cancer (4, 5).
For decades, surgery has been the foundation of treatment, followed by radioactive iodine therapy with 131I (6). Neck ultrasonography (US) is required both preoperatively and during follow-up, though whole-body iodine scans (WBIS) and PET/CT may also be beneficial. Regular measurements of serum thyroglobulin (Tg) and anti-Tg antibody levels are essential to detect abnormalities (7, 8). Thyroglobulin testing alone may miss up to 10% of recurring and metastatic cancers, despite the sensitivity of TSH stimulation in patients without anti-Tg antibodies (9). Ultrasonography -guided fine needle aspiration (FNA) is the most sensitive and specific method to detect neck recurrences (10).
Recurrent malignant tissue in the thyroid bed, as well as chronic metastatic adenopathy, have an impact on post-surgery treatment and outcomes. There are 4 major differences between remaining or recurring thyroidectomy tumors and lymph node metastases. First, recurrence following thyroidectomy may result from remaining malignant tissue growth in the postoperative bed, necessitating vascularization. Second, lymph node metastasis affects preexisting lymph nodes, with malignancy modifying their structure (11). Cystic alterations, calcifications, hyper-echogenicity (lack of hilum), and round shapes in presumed recurrent lymph nodes can all be seen with ultrasound.
Third, thyroid bed recurrences following thorough thyroidectomy typically occur in deeper lymph nodes, requiring extensive neck surgery due to scar tissue from the previous operation. This increases the likelihood of recurrent laryngeal nerve (RLN) destruction and hypoparathyroidism (12). Lastly, bed recurrences are 5 times more likely to be lethal than lymph node recurrences, emphasizing the value of a comprehensive thyroid bed examination. Up to 20% of thyroid cancer patients experience a local recurrence after resection or treatment, which emphasizes the importance of US (13).
To get the best treatment, it is important to distinguish between benign conditions like granulation tissue or remnant normal thyroid and malignant conditions like metastatic adenopathy.
2. Objectives
This study aimed at evaluating US-based criteria for diagnosing local recurrence.
3. Methods
3.1. Study Population
This single-center cross-sectional study involved 177 patients with a history of thyroid cancer referred to Omid Mashhad Hospital between 2021 and 2023 for cancer follow-up. The study was approved by the Ethics Committee of Mashhad University of Medical Sciences (code: IR.MUMS.MEDICAL.REC.1400.784), and written informed consent was obtained from all participants. Patients underwent a neck ultrasound more than 6 weeks after thyroidectomy to check for cancer recurrence or residual adenopathy.
3.2. Study Procedure
Clinical and demographic information, along with pathology results and levels of Tg, anti-Tg antibodies, and TSH were recorded. Neck ultrasonography (Maylab Class C, estate) was conducted in a supine position and the neck was slightly hyperextended. A high-frequency linear transducer (12 - 16 MHz) was used for diagnostic ultrasound imaging in grayscale and color Doppler mode. Our local approach (Figure 1) was followed for performing US-guided FNA.
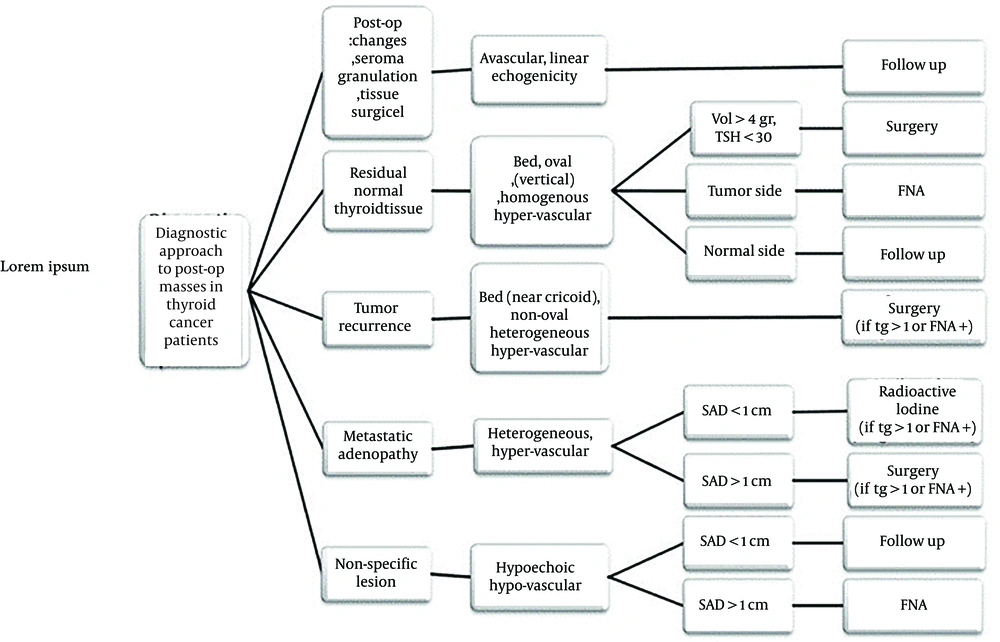
Figure 1.
Our local protocol for ultrasound-guided fine needle aspiration (FNA) in the study for post-thyroidectomy neck masses
The following characteristics were recorded for each lesion: Shape, location, echogenicity (hypoechoic or isoechoic in comparison to adjacent connective tissue), presence or absence of vessels on color Doppler images, type of vascularity (avascular, hypo-vascular, or hyper-vascular [non-hilar]), micro-calcification or echogenic sutures, and size (shortest and longest diameters). Since thyroidectomy often leaves no remaining thyroid tissue in the bed, echogenicity was compared to the neck’s connective tissue, which is predominantly composed of fibroblasts and fat and is usually isoechoic. Micro-calcifications were characterized as small punctate echogenic foci with no acoustic shadowing, while echogenic sutures were classified as lesion-centered echogenic lines.
According to our local protocol, lesions were categorized into 5 groups:
(1) Post-operative changes (e.g., seroma, granulation tissue, or Surgicel material), which appeared as avascular masses with or without net or linear echogenicity.
(2) Residual normal thyroid tissue, defined as homogeneous, oval tissue located in the thyroid lobe bed (near the cricoid cartilage) with vertical orientation and hypervascularity (non-hilar vessels).
(3) Tumor remnants, defined as heterogeneous, non-oval tissue in the thyroid bed (near the cricoid cartilage) with non-vertical orientation, showing either hypo- or hypervascularity.
(4) Metastatic adenopathy, defined as lymph nodes with heterogeneous echotexture and hypervascular non-hilar vessels.
(5) Borderline lesions, which were characterized by a non-specific appearance, typically showing a hypoechoic echotexture with hypo-vascularity (Figures 2 and 3).
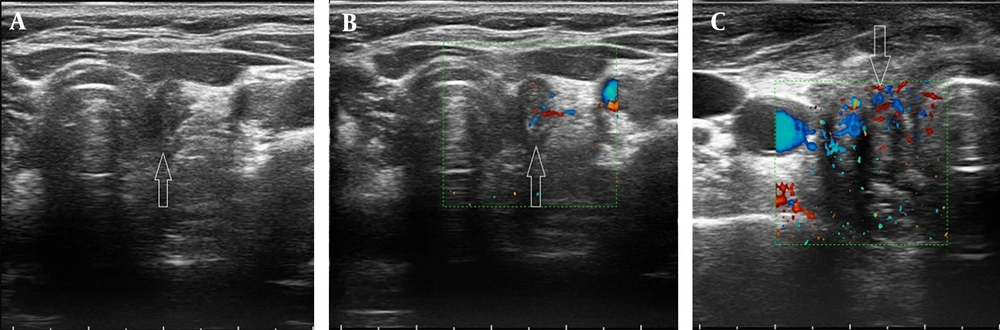
Figure 2.
A tumor remnant, seen as heterogeneous, non-oval tissue in the thyroid lobe bed (near the cricoid cartilage) with non-vertical orientation and hypo- or hypervascularity.
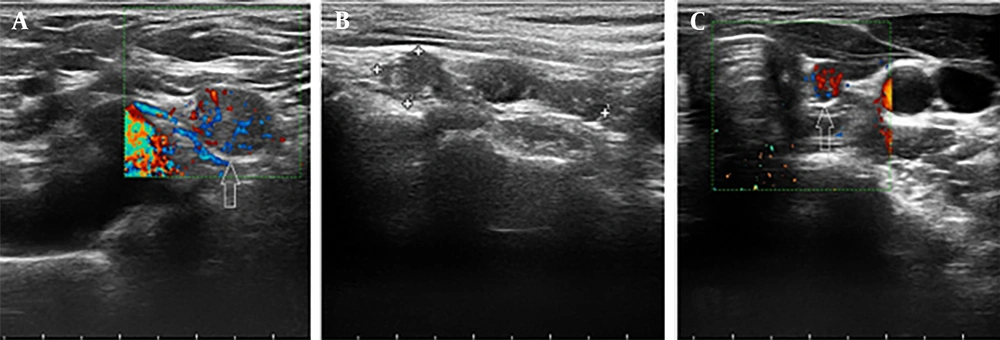
Figure 3.
Metastatic adenopathy, characterized by heterogeneous echotexture and hypervascular non-hilar vessels.
A professional cytopathologist analyzed all samples collected with a 25-gauge needle under sterile conditions. Patients were monitored until a lesion diagnosis was made. The diagnosis was determined, using a combination of needle aspiration, Tg washout, serum TSH, Tg, and anti-Tg antibody levels, as well as diagnostic or therapeutic WBIS results. The final diagnoses were compared to US findings. Additionally, patient ultrasounds and color Doppler videos were recorded.
3.3. Statistical Analysis
Data was analyzed, using SPSS 16.0 (IBM SPSS Statistics for Windows, Armonk, NY: IBM Corp). Continuous variables were presented as mean ± SD, and categorical variables were presented as numbers (percentages), using descriptive statistics. Independent sample t tests were used to compare means between treatment groups for normally distributed variables, while the Mann-Whitney U test was employed for non-normally distributed data. Dependent quantitative variables were analyzed, using paired samples t tests or Wilcoxon signed-rank tests based on normality. Chi-square tests were used to compare categorical distributions. Repeated measures analysis of variance was applied to compare mean factor scores between groups over time. A P-value of less than 0.05 was considered statistically significant.
4. Results
4.1. Patient Demographics
The study included 176 patients, most of whom were female (76.3%, n = 135). Most patients were in their forties (28.2%, n = 50). The average age was 43.4 ± 13.6 years. Men were slightly older than women, but there was no statistically significant difference (44.1 ± 16.3 vs. 43.3 ± 12.7, P = 0.232).
4.2. Ultrasonographic Findings
All patients had ultrasound results, and 71.8% (n = 125) of the lesions were classified as malignant. The number of lesions localized to the central and lateral necks was mostly 1 (total = 83; central neck = 61, lateral neck = 21), 2 (total = 37; central neck = 19, lateral neck = 16), or 3 (total = 21; central neck = 15, lateral neck = 5). Lateral neck abnormalities were found in 28.2% (n = 50) patients, predominantly on the left side (90%, n = 45).
4.3. Diagnostic Methods and Findings
Of the 125 patients with malignant findings, 113 were diagnosed via ultrasound, whereas 12 were diagnosed based on laboratory data (data on US diagnosis and final diagnosis were missing in 3 cases). Seventeen patients had residual tissue, 8 had tumor remnants, and 21 had post-operative alterations.
Follow-up was the most used diagnostic approach (45.8%, n = 81), preceded by FNA (39%) and Tg level measurement (14.1%).
Ultrasound criteria classified 67.8% (n = 118) of lesions as malignant and 32.2% (n = 56) were benign. The FNA results revealed that 37.9% (n = 67) of the patients had papillary thyroid carcinoma.
4.4. Lesion and Echogenicity Analysis
Local criteria identified 49 patients (28.2%) with benign findings and 125 patients (71.8%) with malignant findings. Most patients (71%, 120 out of 169) had 1 or 2 detectable lesions (data for 8 patients regarding the number of lesions were missing). Lesions were more common on the left side (25.9%) compared to the right (16.7%), and involvement of the lateral neck was frequent but not more prevalent than the central neck (28.2%, n = 50; region of involvement was missing for 8 cases). Echogenicity analysis revealed that 40.1% (n = 67) of the lesions were hypoechoic, whereas 59.9% (n = 100) were mixed-echoic. Adenopathy morphologies varied: Irregular in 13.1% (n = 20), lobular in 22.8% (n = 35), and oval in 64.1% (n = 98).
4.5. Vascular Pattern
Vascular pattern analysis of 151 cases showed that the hypervascular (non-hilar) type was the most prevalent (54.3%, n = 82). Most patients (92%, n = 148) showed no cysts or tissue necrosis, however, 31 individuals (19.2%) developed calcification.
4.6. Malignant vs. Benign Group Comparison
Patients were categorized into malignant and benign groups based on cytopathologic and laboratory data. Variables such as age, gender, number of lesions, side, short axis, long axis, calcification, and cyst or tissue necrosis showed no significant difference between the groups. However, lateral neck involvement was more common in the malignant group (88%, n = 44/50), indicating a significant difference (P = 0.011). In benign cases, irregular and oval adenopathy shapes were more common, but malignant patients had lobular shapes (P = 0.023). The vascular pattern and echogenicity were also significantly different between the groups (P < 0.01), with malignancies exhibiting more non-hilar and mixed-echo patterns. Table 1 contains this information.
Table 1.
| Characteristic | Malignant Group | Benign Group | P-Value |
|---|---|---|---|
| Gender | 0.172 | ||
| Female | 94 (73.4) | 41 (83.7) | |
| Male | 34 (26.6) | 8 (16.3) | |
| Number of lesions involved | 0.430 | ||
| 1 | 54 (42.2) | 29 (59.2) | |
| 2 | 28 (21.9) | 9 (18.4) | |
| 3 | 17 (13.3) | 4 (8.2) | |
| 4 | 10 (7.8) | 1 (2) | |
| 5 | 3 (2.3) | 1 (2) | |
| 6 | 1 (0.8) | 0 (0) | |
| 7 | 0 (0) | 1 (2) | |
| 12 | 2 (1.6) | 0 (0) | |
| Multiple | 7 (5.5) | 1 (2) | |
| Involvement of the lateral neck levels | 0.011 | ||
| Yes | 44 (34.4) | 6 (12.2) | |
| No | 80 (62.5) | 39 (79.6) | |
| Side | 0.248 | ||
| Bed | 25 (19.5) | 11 (22.4) | |
| Left | 33 (25.8) | 12 (24.5) | |
| Right | 21 (16.4) | 8 (16.3) | |
| Bilateral | 16 (12.5) | 1 (2) | |
| Superficial | 5 (3.9) | 1 (2) | |
| Pretracheal | 18 (14.1) | 12 (24.5) | |
| Echogenicity | 0.010 | ||
| Hypoechoic | 43 (33.6) | 24 (49) | |
| Mix | 77 (60.2) | 23 (46.9) | |
| Adenopathy shape | |||
| Irregular | 10 (7.8) | 10 (20.4) | 0.023 |
| Lobular | 26 (20.3) | 9 (18.4) | |
| Oval | 70 (54.7) | 28 (57.1) | |
| Short axis | 8.89 ± 0.60 | 7.06 ± 0.54 | 0.176 |
| Long axis | 15.69 ± 0.88 | 34.53 ± 12.05 | 0.076 |
| Vascular pattern | < 0.01 | ||
| Hypo-vascular (hilar) | 2 (1.6) | 3 (6.1) | |
| Hypo-vascular (few vessels) | 21 (16.4) | 22 (44.9) | |
| No vessels | 3 (2.3) | 18 (36.7) | |
| Hypervascular (non-hilar) | 80 (62.5) | 2 (4.1) | |
| Malignant (non-hilar) | 80 (75.5) | 2 (4.5) | |
| Benign (others) | 26 (25.5) | 43 (95.5) | |
| Cyst or tissue necrosis | 0.227 | ||
| Yes | 12 (9.4) | 1 (2) | |
| No | 104 (81.3) | 44 (89.8) | |
| Calcification | 0.149 | ||
| Yes | 18 (14.1) | 13 (26.5) | |
| No | 98 (76.6) | 32 (65.3) | |
| FNA results | 0.009 | ||
| Follicular neoplasm | 1 (0.8) | 0 (0) | |
| Metastatic carcinoma | 1 (0.8) | 0 (0) | |
| Benign follicular lesion | 5 (3.9) | 1 (2) | |
| Granulation tissue | 0 (0) | 2 (4.1) | |
| Lymphadenitis | 0 (0) | 1 (2) | |
| PTC | 56 (43.8) | 11 (22.4) | |
| MTC | 4 (3.1) | 0 (0) | |
| Hashimoto-PTC | 0 (0) | 1 (2) | |
| Patient follow-up results | < 0.01 | ||
| Stable | 9 (7) | 23 (46.9) | |
| Disappeared | 3 (2.3) | 10 (20.4) | |
| Development | 26 (20.3) | 0 (0) | |
| Regress | 20 (15.6) | 8 (16.3) |
Abbreviation: FNA, fine needle aspiration.
a Values are expressed as No. (%) unless otherwise indicated.
b The missed data in variables is as follows: Number of lesions involved: 8 cases, involvement of the lateral neck levels: 8 cases, echogenicity: 10 cases, adenopathy shape: 24 cases, vascular pattern: 26 cases, cyst or tissue necrosis: 16 cases, calcification: 16 cases, FNA results: 93 cases, patient follow-up results: 78 cases.
4.7. Ultrasound Diagnostic Performance
The ultrasound diagnosis was significantly associated with the final pathology results (P < 0.01), with a sensitivity of 95.8% for detecting malignancies and 78.6% for benign lesions (Table 2).
Table 2.
Comparison of Pathology Results with Ultrasound Diagnosis a
| Classification Based on Ultrasound Criteria | Malignant Group | Benign Group | Total | P-Value |
|---|---|---|---|---|
| Final pathology diagnostic criteria | < 0.01 | |||
| Malignant | 113 | 12 | 125 | |
| Benign | 5 | 44 | 49 | |
| Total | 118 | 56 | 174 |
a Values are expressed as Number.
The diagnostic accuracy, sensitivity, specificity, positive predictive value (PPV), and negative predictive value (NPV) of ultrasound were 90.23%, 90.4%, 89.80%, 95.76%, and 78.57%, respectively. Among diagnostic variables, the vascular pattern had the highest sensitivity (75.47%), specificity (95.56%), accuracy (81.46%), NPV (62.32%), and PPV (97.56%) (Table 3).
Table 3.
Results of Sensitivity, Specificity, Accuracy, and Positive and Negative Predictive Value of Our Variables
| Test Types and Scales | Values | 95% CI (Minimum - Maximum) |
|---|---|---|
| Ultrasound diagnosis | ||
| Sensitivity (%) | 90.40 | 83.83 - 94.94 |
| Specificity (%) | 89.80 | 77.77 - 96.60 |
| Positive likelihood ratios | 8.86 | 3.85 - 20.37 |
| Negative likelihood ratios | 0.11 | 0.06 - 0.18 |
| Prevalence (%) | 71.84 | 64.53 - 78.38 |
| Positive predictive value (%) | 95.76 | 90.77 - 98.11 |
| Negative predictive value (%) | 78.57 | 67.99 - 86.36 |
| Accuracy (%) | 90.23 | 84.82 - 94.20 |
| Vascular pattern | ||
| Sensitivity (%) | 75.47 | 66.16 - 83.31 |
| Specificity (%) | 95.56 | 84.85 - 99.46 |
| Positive likelihood ratios | 16.98 | 4.36 - 66.10 |
| Negative likelihood ratios | 0.26 | 0.18 - 0.36 |
| Prevalence (%) | 70.20 | 62.22 - 77.36 |
| Positive predictive value (%) | 97.56 | 91.13 - 99.36 |
| Negative predictive value (%) | 62.32 | 54.07 - 69.91 |
| Accuracy (%) | 81.46 | 74.33 - 87.31 |
| Echogenicity | ||
| Sensitivity (%) | 64.17 | 54.90 - 72.71 |
| Specificity (%) | 51.06 | 36.06 - 65.92 |
| Positive likelihood ratios | 1.31 | 0.95 - 1.81 |
| Negative likelihood ratios | 0.70 | 0.49 - 1.01 |
| Prevalence (%) | 71.86 | 64.39 - 78.53 |
| Positive predictive value (%) | 77.00 | 70.83 - 82.19 |
| Negative predictive value (%) | 35.82 | 27.86 - 44.65 |
| Accuracy (%) | 60.48 | 25.63 - 67.95 |
Abbreviation: CI, confidence interval.
5. Discussion
This study presented an ensemble criterion for evaluating malignancy in thyroid cancer lesions, as not all central neck lesions undergo tissue sampling. This approach is particularly important as many lesions are assessed non-invasively, and ultrasound plays a crucial role in identifying malignancies.
The ultrasound-guided method demonstrated adequate sensitivity and specificity in differentiating residual or recurrent illness from benign lesions. The patient demographic predominantly comprises individuals in their fifties, consistent with findings from previous studies. However, in some countries, there is a 2-decade increase in the mean age of patients, even though a declining trend in the overall incidence has been observed (14). Interestingly, the majority of patients were female, reflecting the global male-to-female ratio of 1:2.9, a common finding in thyroid cancer studies (15).
One of the key ultrasound markers, echogenic foci, often referred to as "bright spots", is well-established in identifying malignancy in thyroid nodules and lymphadenopathy (16). In the absence of a formal scoring system for malignant lymphadenopathy, factors such as shape and vascular patterns provide additional diagnostic value.
For instance, metastatic lymph nodes often exhibit a short-to-long axis (S/L) greater than 0.5, indicating a round shape, whereas benign nodes tend to be oval with an S/L ratio of less than 0.5. The results of this study confirmed that round shapes were more frequently associated with malignancy (P = 0.023), though the short and long-axis diameters did not significantly correlate with malignancy.
Furthermore, the vascular patterns observed in ultrasound play a critical role in identifying malignant lymphadenopathy. Malignant nodes typically display non-hilar vascular patterns, such as peripheral or diffuse patterns, while benign nodes are more likely to exhibit hilar or central vascular patterns (17). Previous research by Leboulleux et al. found that vascular patterns were among the most accurate (86% of the time) and sensitive (82% of the time) sonographic features in diagnosing lymph node metastasis, highlighting the importance of Doppler ultrasound in managing thyroid cancer patients (18). In this study, non-hilar vascular patterns were exclusively observed in malignant samples, with approximately 75% of these patients being pathologically confirmed as malignant.
Given the complexity of accurately diagnosing thyroid cancer recurrence, a multidisciplinary team approach is essential. A thorough neck ultrasound that evaluates the thyroid bed and all lymph node drainage areas is crucial for successful radiologic diagnosis. Missed or occult lesions can lead to the need for additional surgery or radioiodine treatment. While specific sonographic features are usually sufficient to diagnose cancer recurrence or persistence, operator-dependent variability underscores the importance of a multidisciplinary approach. Diagnostic findings must always be considered in the context of the patient’s medical history, physical examination, and other relevant clinical data (19).
The sensitivity of ultrasound in this study aligns with previous research. For instance, Alam et al. reported a sensitivity of 91.7%, deeming the test clinically reliable for diagnosing malignant lesions and guiding treatment decisions (20). Similarly, the sensitivity and specificity results fall within the range reported by other studies, such as Youssef et al., who found a sensitivity of 100% and specificity of 94.1% for thyroid nodules (21). In this study, the PPV was 95.8%, and the NPV was 78%, which are higher than those reported by Kim et al., who noted a PPV of 66% for ultrasound-guided cytology of thyroid nodes (22). These variations may be attributed to differences in referral patterns or diagnostic workflows.
Although factors such as vascular pattern, adenopathy shape, and echogenicity are critical components of ultrasound assessments, none of these variables alone are sufficient for a definitive diagnosis of tissue conditions or cancer recurrence. This study demonstrated that the specificity, sensitivity, PPV, NPV, and accuracy of each variable in isolation were relatively low. However, when all factors were considered together, neck ultrasound remained a highly accurate and efficient tool for diagnosing thyroid bed lesions.
To enhance the consistency of ultrasound evaluations for thyroid cancer recurrence, a checklist was developed for radiologists to assess key diagnostic variables, which are provided in Table 4.
Table 4.
Thyroid Cancer Ultrasound Evaluation Checklist a
| Criterion Options | Score (Point) |
| Lesion location | |
| Central neck | 2 |
| Lateral neck (left/right) | 3 |
| Thyroid bed | 2 |
| Other | 1 |
| Lesion shape | |
| Oval (benign indicator) | 1 |
| Lobular | 2 |
| Irregular (malignant indicator) | 3 |
| Echogenicity | |
| Hypoechoic (malignant indicator) | 3 |
| Mixed-echoic | 2 |
| Isoechoic (benign indicator) | 1 |
| Vascular pattern | |
| Hypervascular (non-hilar) (malignant) | 4 |
| Hypovascular (few vessels) | 2 |
| Hypovascular (hilar) | 1 |
| Avascular | 0 |
| Calcification | |
| Present | 3 |
| Absent | 1 |
| Cyst or tissue necrosis | |
| Present (malignant indicator) | 3 |
| Absent | 1 |
a Total score interpretation: 0 - 7 points: Likely benign; 8 - 14 points: Indeterminate, further evaluation needed; 15+ points: Likely malignant.
Despite the strengths of this study, including the use of a novel composite standard of truth for determining malignancy, there are some limitations. The single-center, retrospective design limits the ability to generalize findings across broader populations, and not all patients underwent tissue sampling, which may have led to an overestimation of the diagnostic value indices. Nonetheless, external validation by other groups will be essential to confirm the reliability of these criteria in future studies.
5.1. Conclusions
In conclusion, based on ultrasound findings, post-operative lesions in thyroid cancer patients can be categorized into 5 distinct groups: Post-operative changes (such as seroma, granulation tissue, and surgical material), residual normal thyroid tissue, tumor remnants, metastatic adenopathy, and non-specific lesions. The study demonstrated that ultrasound remains a highly reliable tool in detecting malignancy in postoperative thyroid cancer patients, with an overall sensitivity and specificity of approximately 90%. However, given the operator-dependent nature of ultrasound and the variability of findings, a multidisciplinary approach remains essential for enhancing diagnostic accuracy.