1. Background
Blood levels of lipids, especially total cholesterol (TC) and high density lipoprotein cholesterol (HDL-C) are widely used to predict cardiovascular disease (CVD). Although, due to the inverse relationship between triglycerides (TG) and HDL-C, inclusion of HDL-C in multivariate predicting models removes TG from the model; some studies have shown that TG was independently related to CVD risk (1). Studies have shown intra-individual variability of TC, HDL-C and TG, the latter had more variability than the two others (2, 3). Some studies showed about 60% of the average total intra-individual variation for cholesterol and HDL-C and 90% of TG's intra-individual variability were attributable to biological fluctuations (2).
Most epidemiological studies used a single measurement of blood lipids to determine their relationship with CVDs. However, single measures of these variables are subject to random measurement error (technical errors in measurements, short/long-term biologic variations or both). When the measurements are replicated, unusual or extreme values usually tend to be followed by less extreme values that are closer to the mean of distribution of variable in the population, the phenomenon which is known as regression to the mean (4). Using baseline measurements in univariate analysis would distort the strength of associations between true values of risk factors and disease incidence (i.e. relative risk, risk ratio, odds ratio or hazard ratio) toward the unity, which is well-known as regression dilution bias (RDB) (5). It can be assumed that this bias resulted from the regression to the mean (6). In prospective epidemiologic studies, participants’ characteristics are usually measured in given time intervals, for example in biennial intervals. These replicate measurements can be used to correct the effect of RDB by calculating regression dilution ratios (RDR), a measure that quantifies the amount of random measurement error in variable of interest. The effect of random measurement error of risk factors, such as TC and HDL-C, due to RDB on the occurrence of diseases have been evaluated in many cohort studies (7-11), however; there are few studies examining these issues by age and sex (7, 8).
2. Objectives
The aim of the present study was to determine underestimation of the importance of TC, TG and HDL-C in relation to CVD incidence in Tehran lipid and glucose study (TLGS) by different age, gender and body mass index (BMI) categories.
3. Patients and Methods
3.1. Study Population
TLGS is a prospective cohort study for evaluating the prevalence and importance of non-communicable disease risk factors, especially CVDs. At the beginning of study, 15005 people aged ≥ 3 years were enrolled between February 1999 and August 2001. Participants were invited to take part in reexaminations every three years (3, 6 and 9 years after baseline shown here as exam2, exam3 and exam4, respectively).
There were 7907 people aged 30 - 74 years in the original cohort. Of whom 487 had a history of cardiovascular disease, 332 had missing data and 758 lost to follow-up for annually measuring of the outcome. From the remaining (6327), 3545 subjects participated in all reexaminations until March 2010. We excluded people who had missing data in at least one of the following exams (n = 384) or a CVD event before exam2 and 3 (n = 98). Finally, 3063 subjects (1224 men and 1839 women) remained to calculate the RDRs (Figure 1).
The design of the study was approved by the Ethics Committee of the Research Institute for endocrine sciences, Shahid Beheshti university of medical science, and all participants provided a written informed consent.
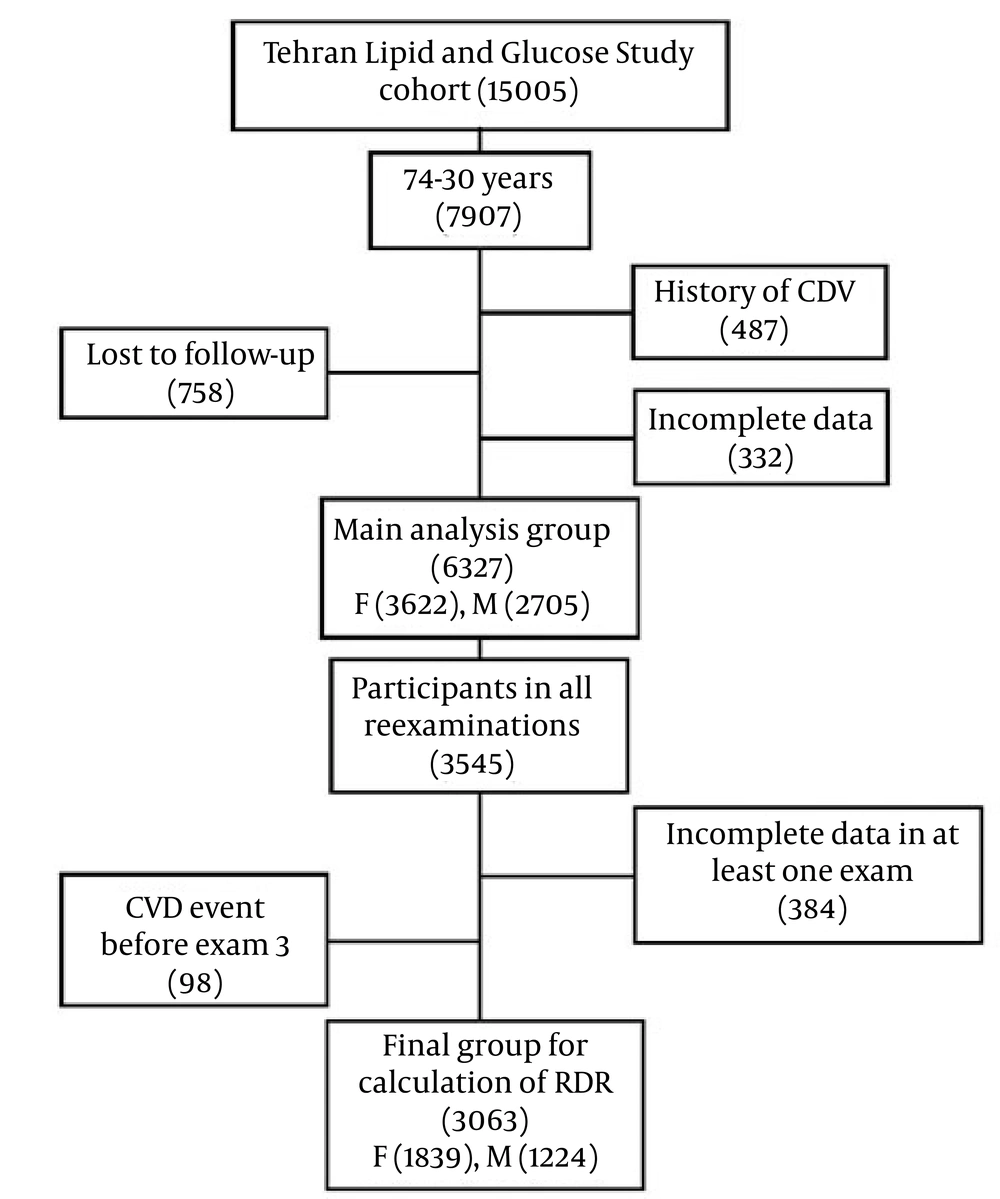
Figure 1.
Flow Chart of the Study Population
3.2. Laboratory Measurements
In the baseline (exam1) and reexaminations, blood samples were collected for all participants in the morning between 7 - 9 AM after 12 hours fasting. All analyses were performed at TLGS research laboratory on the day of blood collection. The details of measurements were published elsewhere (12).
3.3. Statistical Methods
Repeated measurements of the risk factors can be used to quantify the extent of RDB by calculation of RDR, a measure of within-person variability (5). RDR is defined as the ratio of between-person variance (variance of true values) to the total variance (the variance of observed values) (13). Also, it can be described as the ratio of observed slop of the association between risk factor and outcome to the true underlying slope. It has a range of 0 to 1; smaller values indicate greater within-person variability.
RDR can be estimated parametrically and non-parametrically using pairs of measurements made on the same individuals in separate and appropriate time intervals (5, 8, 14, 15). MacMahon’s method is the widely accepted and used nonparametric method for estimating the RDR (5). This method has no assumption on the exact shape of association between baseline measurement of risk factor and the disease risk. In this method, participants are arbitrarily categorized into a few groups based on their baseline measurements. The ranges of group means for upper and lower groups, for baseline and reexamination measures, are calculated. RDR is calculated as the ratio of reexamination range to the baseline range. This method uses the fact that provided the first measurements, the means of the second measurements in each group would be unbiased estimate of the mean usual levels of variable (5), and its range would be substantially narrower than the range of the baseline values. The estimated RDRs are independent of the numbers of groups and range of values (8). In the present study, individuals were divided into five groups based on their baseline measurements. Classification was performed based on ATP III classifications (16) for these variables, but we had to modify classes to have five groups.Therefore, we used the following categories: TC: ≤ 159, 160 - 199, 200 - 239, 240 - 279, ≥ 280, TG: ≤ 99, 100 - 149, 150 - 199, 200 - 399, ≥ 400, HDL-C: ≤ 29, 30 - 39, 40 - 49, 50 - 59, ≥ 60. The log normal transformation of variables was used to calculate the RDRs.
Different parametric methods based on regression and correlation can be used to calculate the RDR (14). Among them, Rosner’s regression method (15) has found wider use. It uses the same fact as MacMahon’s method and gives unbiased estimates of RDR when the means of replicate measurements are not the same. In this method, second measurement of the variable regresses on the first one. The estimated regression coefficient is an unbiased estimation of the reliability of measurements (14). In the absence of measurement error, the slope of the regression line would be 1, but in its presence the slope of the regression line would be decreased, the more the magnitude of measurement error, the more the reduction in the slope of regression line.
Until the time of the present analysis, three reexaminations were conducted. The third examination was completed on October 2011, but the data of annually measuring of the outcome were available until March 2010; therefore, we estimated two RDRs based on measurements of exam2, exam1 and exam3-exam shown here as RDR1 and RDR2, respectively.
Since RDRs by parametric method were actually regression coefficient, we compared RDRs of men and women and RDRs for age groups using a z test (17) as follows:
Where β1 and β2 were RDR1 and RDR2, respectively and SE was standard error of RDR. Due to multiple comparison between RDRs, we considered significance level at P Value = 0.01.
To obtain the true underlying slope, which relates disease risk to the usual level of the risk factor and corresponding standard error, the observed regression coefficient and its standard error was divided by the estimated RDR. Estimated Hazard ratios (HRs) from Cox proportional hazard analysis were corrected to show the effect of RDB. Corrections were made using RDR2 derived by parametric method. The corrected HRs were calculated as the exponentiation of observed regression coefficient divided by RDR. The percentage of underestimation in actual relationships between risk factors and outcomes were obtained by the reciprocal of RDRs minus one multiplied by 100. The percent change in HRs after correction was computed as the difference of corrected and uncorrected HRs divided by uncorrected HR, then multiplied by 100. All statistical analyses were performed by SPSS 20 (Chicago. IL, USA) and Excel 2007.
4. Results
Table 1 shows means of natural log transformed values for TC, TG and HDL-C in the groups of participants in exam1 (baseline), exam2 and exam3. This table shows the convergence of mean values, especially in upper groups from baseline to exam3. The convergence of group means between baseline and exam2 is greater than the convergence between exam2 and 3 in all lipid measurements. However, this table shows shows that the difference between upper and lower groups decreased from baseline to exam3 in all variables.
Table 1.
Groups Means of Cholesterol, Triglyceride and High Density Lipoprotein (Log-Transformed) and the Difference Between Upper and Lower Groups in TLGS a
| Groups | TC b | TG c | HDL-C d | ||||||
|---|---|---|---|---|---|---|---|---|---|
| Exam1 | Exam2 | Exam3 | Exam1 | Exam2 | Exam3 | Exam1 | Exam2 | Exam3 | |
| Men | |||||||||
| 1 | 4.976 | 4.999 | 4.997 | 4.321 | 4.496 | 4.513 | 3.265 | 3.339 | 3.435 |
| 2 | 5.207 | 5.160 | 5.163 | 4.825 | 4.853 | 4.855 | 3.564 | 3.486 | 3.560 |
| 3 | 5.385 | 5.294 | 5.286 | 5.148 | 5.076 | 5.072 | 3.802 | 3.639 | 3.733 |
| 4 | 5.543 | 5.394 | 5.384 | 5.553 | 5.342 | 5.287 | 3.989 | 3.728 | 3.813 |
| 5 | 5.719 | 5.527 | 5.505 | 6.249 | 5.797 | 5.684 | 4.155 | 3.822 | 3.906 |
| Diff | 0.743 | 0.528 | 0.508 | 1.929 | 1.302 | 1.171 | 0.891 | 0.483 | 0.471 |
| Women | |||||||||
| 1 | 4.973 | 5.011 | 5.053 | 4.315 | 4.518 | 4.562 | 3.237 | 3.384 | 3.498 |
| 2 | 5.201 | 5.172 | 5.193 | 4.807 | 4.807 | 4.842 | 3.583 | 3.546 | 3.623 |
| 3 | 5.391 | 5.310 | 5.316 | 5.150 | 5.084 | 5.085 | 3.812 | 3.711 | 3.779 |
| 4 | 5.546 | 5.438 | 5.412 | 5.567 | 5.382 | 5.334 | 3.994 | 3.831 | 3.901 |
| 5 | 5.731 | 5.536 | 5.493 | 6.210 | 5.830 | 5.775 | 4.183 | 3.930 | 4.017 |
| Diff | 0.759 | 0.525 | 0.440 | 1.895 | 1.312 | 1.213 | 0.947 | 0.545 | 0.520 |
| Total | |||||||||
| 1 | 4.975 | 5.005 | 5.026 | 4.317 | 4.511 | 4.545 | 3.255 | 3.354 | 3.456 |
| 2 | 5.204 | 5.167 | 5.180 | 4.814 | 4.824 | 4.8467 | 3.574 | 3.517 | 3.592 |
| 3 | 5.389 | 5.303 | 5.303 | 5.149 | 5.081 | 5.079 | 3.809 | 3.687 | 3.764 |
| 4 | 5.545 | 5.423 | 5.403 | 5.561 | 5.364 | 5.313 | 3.993 | 3.809 | 3.883 |
| 5 | 5.729 | 5.534 | 5.496 | 6.230 | 5.813 | 5.728 | 4.180 | 3.915 | 4.003 |
| Diff | 0.754 | 0.529 | 0.470 | 1.914 | 1.302 | 1.182 | 0.924 | 0.561 | 0.546 |
a Abbreviations: Diff: the difference between upper and lower groups, Ln: Natural Logarithm.
b TC: Total Cholesterol. Groups 1 to five indicate the following categories: ≤ 159, 160 - 199, 200 - 239, 240 - 279, ≥ 280 mg/dL.
c TG: Triglycerides. Groups 1 to five indicate the following categories: ≤ 99, 100 - 149, 150 - 199, 200 - 399, ≥ 400 mg/dL.
d HDL-C: High Density Lipoprotein. Groups one to five indicate the following categories: ≤ 29, 30 - 39, 40 - 49, 50 - 59, ≥ 60 mg/dL.
Parametric and nonparametric RDRs of TC, TG and HDL-C for men and women are shown in Table 2. Both methods yielded relatively similar results. RDRs of men were nearly similar to those of women, except for RDR2 for TC. RDR of TC in men were smaller than RDR of women (P = 0.005).
Table 2.
Regression Dilution Ratios of Cholesterol, Triglyceride and High Density Lipoprotein (Log-Transformed) by Macmahon and Rosner Regression Methods in TLGS a
| Variables | All | Men | Women | P Value | |||
|---|---|---|---|---|---|---|---|
| MacMahon | Rosner | MacMahon | Rosner | MacMahon | Rosner | ||
| Ln (TC) | |||||||
| RDR1 | 0.701 | 0.716 (0.693 - 0.740) | 0.711 | 0.706 (0.667 - 0.745) | 0.692 | 0.714 (0.684 - 0.744) | 0.749 |
| RDR2 | 0.623 | 0.637 (0.612 - 0.661) | 0.684 | 0.678 (0.637 - 0.719) | 0.580 | 0.603 (0.572 - 0.633) | 0.005 |
| Ln (TG) | |||||||
| RDR1 | 0.681 | 0.683 (0.658 - 0.708) | 0.675 | 0.664 (0.624 - 0.704) | 0.706 | 0.697 (0.666 - 0.729) | 0.198 |
| RDR2 | 0.618 | 0.619 (0.594 - 0.644) | 0.607 | 0.610 (0.570 - 0.650) | 0.640 | 0.628 (0.597 - 0.660) | 0.482 |
| Ln (HDL-C) | |||||||
| RDR1 | 0.607 | 0.631 (0.602 - 0.659) | 0.542 | 0.553 (0.506 - 0.601) | 0.576 | 0.618 (0.580 - 0.656) | 0.034 |
| RDR2 | 0.591 | 0.612 (0.587 - 0.637) | 0.529 | 0.552 (0.511 - 0.594) | 0.549 | 0.594 (0.560 - 0.627) | 0.121 |
a Abbreviations: HDL-C, high density lipoprotein; Ln, Natural Logarithm; RDR1, regression dilution ratio based on measurements three years after baseline; RDR2, regression dilution ratio based on measurements six years after baseline; TC, total cholesterol; TG, triglyceride ; HDL-C, high density lipoprotein.
RDR2s were smaller than RDR1s; it showed that RDRs decreased with increasing time interval between baseline and remeasurements. The differences between RDR1 and RDR2 in TC and TG in the whole group and women were significant (P < 0.001). TC in women had the greatest decrease (about 16%). RDRs of TG showed on average 9% reduction from RDR1 to RDR2. RDRs of HDL-C in men had no change from exam2 to exam3.
RDR1 and RDR2 for TC by parametric method were 0.717 and 0.637, respectively, which means 39% and 57% underestimation [i.e. (1/RDR) -1] in the estimates of effects for TC. These underestimations were 42% and 48% for men and 40% and 66% for women, respectively. For TG, there were 46% and 62% underestimation after three and six years from follow-up (51% and 64% in men and 44% and 59% in women). HDL-C had the greatest underestimation (58% and 63% after three and six years from follow-up, respectively); especially in men it was 81%. For women the corresponding underestimations were 62% and 68% after three and six years from follow-up. These results indicated that HDL-C had the greatest within person variability.
There were no differences in RDRs of variables in participants who were < 50 years and ≥ 50 years at baseline (Table 3). Generally there were no differences in RDRs based on body mass index of participants at baseline, except between RDR2 for TC (Table 4).
Table 5 shows uncorrected and corrected hazard ratios (adjusted for age, systolic blood pressure, current smoking status, diabetes and family history of CVD) for TC, TG and HDL-C. Variables with larger regression coefficient or smaller RDR had greater changes in corrected HR. For example, HR of TC and TG in men for model (b) were 3.05 and 1.25. Correction with RDRs resulted in hazard ratio of 4.85 for TC (59.1% change) and 1.40 (11.5% change) for TG. Corrected HRs had wider confidence intervals than uncorrected ones.
Table 3.
Parametric Regression Dilution Ratios (95% Confidence Interval) for Natural Log Transformation of Cholesterol, Triglyceride and High Density Lipoprotein Measurements in TLGS in Men and Women by Age Groups at Baseline a
| Age at Baseline, y | Men | Women | ||||||
|---|---|---|---|---|---|---|---|---|
| RDR1 (95%CI) | P Value | RDR2 (95%CI) | P Value | RDR1 (95%CI) | P Value | RDR2 (95%CI) | P Value | |
| Ln (TC) | 0.164 | 0.562 | 0.737 | 0.198 | ||||
| < 50 | 0.730 (0.680 - 0.779) | 0.689 (0.637 - 0.740) | 0.686 (0.646 - 0.726) | 0.619 (0.578 - 0.659) | ||||
| ≥ 50 | 0.672 (0.608 - 0.736) | 0.664 (0.597 - 0.731) | 0.698 (0.641 - 0.755) | 0.572 (0.512 - 0.631) | ||||
| Ln (TG) | 0.136 | 0.517 | 0.261 | 0.616 | ||||
| < 50 | 0.686 (0.635 - 0.737) | 0.618 (0.565 - 0.672) | 0.680 (0.640 - 0.720) | 0.639 (0.598 - 0.680) | ||||
| ≥ 50 | 0.624 (0.560 - 0.687) | 0.592 (0.534 - 0.650) | 0.719 (0.663 - 0.775) | 0.622 (0.569 - 0.675) | ||||
| Ln (HDL-C) | 0.619 | 0.060 | 0.364 | 0.060 | ||||
| < 50 | 0.512 (0.450 - 0.574) | 0.516 (0.462 - 0.570) | 0.600 (0.554 - 0.645) | 0.571 (0.529 - 0.612) | ||||
| ≥ 50 | 0.604 (0.529 - 0.680) | 0.596 (0.532 - 0.660) | 0.638 (0.568 - 0.709) | 0.639 (0.581 - 0.697) | ||||
a Abbreviations: HDL-C, high density lipoprotein; Ln, Natural Logarithm; RDR1, regression dilution ratio based on measurements three years after baseline; RDR2, regression dilution ratio based on measurements six years after baseline; TC, total cholesterol; TG, triglyceride ; HDL-C, high density lipoprotein.
Table 4.
Parametric Regression Dilution Ratios (95% Confidence Interval) for Natural Log Transformation of Cholesterol, Triglyceride and High Density Lipoprotein Measurements in TLGS in Men and Women by Body Mass Index Groups at Baseline a
| BMI at Baseline, Kg/m2 | Men | Women | ||||||
|---|---|---|---|---|---|---|---|---|
| RDR1 (95%CI) | P Value | RDR2 (95%CI) | P Value | RDR1 (95%CI) | P Value | RDR2 (95%CI) | P Value | |
| Ln (TC) | 0.388 | 0.270 | 0.779 | 0.822 | ||||
| < 30 | 0.700 (0.657 - 0.743) | 0.674 (0.629 - 0.718) | 0.709 (0.672 - 0.746) | 0.599 (0.561 - 0.637) | ||||
| ≥ 30 | 0.747 (0.648 - 0.846) | 0.736 (0.634 - 0.839) | 0.718 (0.665 - 0.772) | 0.607 (0.552 - 0.661) | ||||
| Ln (TG) | 0.175 | 0.020 | 0.656 | 0.403 | ||||
| < 30 | 0.640 (0.596 - 0.684) | 0.592 (0.547 - 0.636) | 0.696 (0.656 - 0.735) | 0.616 (0.577 - 0.655) | ||||
| ≥ 30 | 0.773 (0.672 - 0.874) | 0.720 (0.620 - 0.820) | 0.680 (0.625 - 0.736) | 0.646 (0.588 - 0.703) | ||||
| Ln (HDL-C) | 0.972 | 0.655 | 0.282 | 0.817 | ||||
| < 30 | 0.556 (0.504 - 0.609) | 0.566 (0.521 - 0.611) | 0.602 (0.556 - 0.648) | 0.589 (0.549 - 0.629) | ||||
| ≥ 30 | 0.558 (0.441 - 0.676) | 0.478 (0.372 - 0.584) | 0.647 (0.578 - 0.716) | 0.603 (0.542 - 0.664) | ||||
a Abbreviations: Ln, Natural Logarithm; TC, total cholesterol; TG, triglyceride; HDL-C: high density lipoprotein; RDR1, regression dilution ratio based on measurements three years after baseline; RDR2, regression dilution ratio based on measurements six years after baseline.
Table 5.
Hazard Ratios for 10 Years CVD Events in Men and Women With a Change of One Natural Log Unit of TC, TG and HDL-C Based on Correction Factor of Exam2 by Parametric Method a
| Variables | Men | Women | ||||
|---|---|---|---|---|---|---|
| HRUb (95%CI) | HRCc (95%CI) | %Change d | HRU (95%CI) b | HRC (95%CI) c | %Change | |
| Ln (CHOL) | ||||||
| (a) e | 3.49 (2.00 - 6.11) | 5.91 (2.67 - 13.06) | 69.3 | 4.30 (2.55 - 10.51) | 7.71 (3.11 - 19.10) | 79.3 |
| (b) f | 3.05 (1.74 - 5.33) | 4.85 (2.20 - 10.71) | 59.1 | 3.03 (1.58 - 5.84) | 4.73 (1.89-11.84) | 56.0 |
| Ln (TG) | ||||||
| (a) | 1.46 (1.21 - 1.77) | 1.78 (1.33 - 2.38) | 16.9 | 1.88 (1.48 - 2.39) | 2.47 (1.74 - 3.48) | 31.4 |
| (b) | 1.25 (1.03 - 1.53) | 1.40 (1.04 - 1.88) | 11.5 | 1.52 (1.19 - 1.96) | 1.83 (1.28 - 2.62) | 20.1 |
| Ln (HDL-C) | ||||||
| (a) | 0.58 (0.37 - 0.91) | 0.37 (0.17 - 0.84) | -36.2 | 0.49 (0.29 - 0.81) | 0.31 (0.14 - 0.71) | -36.7 |
| (b) | 0.70 (0.45 - 1.11) | 0.52 (0.23 - 1.21) | -25.8 | 0.54 (0.32 - 0.90) | 0.37 (0.16 - 0.84) | -31.8 |
a Abbreviation: Ln, Natural Logarithm; TC, total cholesterol; TG, triglyceride; HDL-C, high density lipoprotein.
b HRU, Uncorrected Hazard ratio.
c HRC, Corrected Hazard ratio.
d % change computed as ((HRC-HRU)/HRU) × 100.
e (a) adjusted for age, (b) adjusted for age, systolic blood pressure, current smoking status, diabetes, and family history of CVD.
f Correction was made based on correction factor obtained by using exam2 data.
5. Discussion
In this study, we found moderate underestimation in the real association of TC, TG and HDL-C with CVD risk due to regression dilution bias in Tehran lipid and glucose study. This bias is the result of technical errors in measurement and short- and long-term biologic fluctuations in the levels of plasma lipids. Our study confirmed that the use of baseline measurements of these factors, without correction for regression dilution bias, distorts the true relationships of these variables with the risk of diseases toward the null value.
Underestimation in the effect of TC after three years from baseline in our study (about 40%) is comparable with RDRs found in other studies. In a study from Finland for the same time interval from baseline, underestimation in the effect of TC was 44% and 49% in men and women (18). Other studies found 25% - 64% attenuation in association with at least one year time interval between baselines and replicate measurements (11, 19-22). In a recent study, RDR of TC was calculated 0.644 in men and 0.660 in women for six years interval from baseline, which means 55% and 52% inflation in the exposure-disease relationship (23). Attenuation for TG in our study was about 50% and 60% after three and six years from baseline. Eberly et al. found an underestimation about 48% for TG (24). For a 15-year interval from baseline, attenuation for non-fasting TG in men and women were 75% and 67%, respectively (25). In this analysis, HDL-C had an overall underestimation about 67% in the reverse association between HDL-C and the risk of CVDs. Underestimation in men was larger than women (81% vs. 62% three years after baseline). In Framingham study, underestimation in association for HDL-C were 48% and 66% in men and women, respectively (19). In other studies, the real inverse relations for HDL-C were 37% and 43% stronger than uncorrected ones (21). The difference between our findings with other studies can be the result of time interval between replicate measurements from baseline, variance of true values, variance of replicate measurements (error variance) and other characteristics of participants such as age. In general, our findings revealed that real associations between usual TC, TG and HDL-C with cardiovascular disease were about 40% to 80% stronger than those between baseline measures of these variables, which have been estimated in previous studies.
In our data, HDL-C had the greatest within-person variability. There was a decline in total mean and the group means of HDL-C (Table 1) in all groups in exam2, which was increased in exam3. The same results were found in a paper by Hadaegh et al. regarding trend of lipids in TLGS (26). Population level changes in mean values of variables between two time points increase within person variability. Part of the larger within-person variability in the HDL-C might be attributed to technical error in the assessment of HDL-C. Correction for RDB increased the slope of inverse associations between HDL-C with cardiovascular disease about 80% and 60% for men and women, then its corresponding HR adjusted for age, smoking, diabetes mellitus and family history of CVD changed from 0.72 to 0.56 in men and from 0.54 to 0.37 in women. Although, corrected HR had wider confidence intervals, they showed strong preventive effect. Therefore, non-significant relationship of HDL-C with CVD in TLGS might be partly the result of relatively large amount of RDB.
Our results demonstrated convergence between group means from baseline to exam3. The convergence between measures of baseline with exam2 was greater than that between exams 2 and 3. This reveals that baseline measurements were more variable than latter measurements. It could be in part attributed to the effect of entering the study, which causes an increase in participants’ awareness of their health status and lipid levels and therefore more attention to lower lipids level; a Hawthorne effect (27). We found similar results when we restricted the analysis to those who did not use lipid lowering drugs.
There was a modest decrease in estimated RDRs for exam2 to exam3; the greater decrease was seen in TC for women and smaller ones for HDL-C. Similar decreases in RDR between reexaminations were found in other studies; for example, Clarke et al. showed that the RDR for TC varied from 0.7 after six years to 0.52 after 16 years, which corresponds to 26% decline (8). It was greater than the observed decrease in our study, but the time interval between two measurements from baseline in that study was longer. It has been shown that within-person variability increases with time, the larger the time interval, the more the increase in within person variability (27). Our results confirmed the increase in the underestimation of association with the elapsed time interval between baselines and repeated measurements.
For variables with a strong relation with the occurrence of diseases, correcting the effect of measurement error is more important and would have a large influence on the estimated risk for patients. In contrast, for risk factors with poor relations, even large random measurement errors would have low impact on the estimated risk for disease. In our data, 42% underestimation in the real association of TC leads to 62% increase in the HR of TC adjusted for age, smoking, diabetes mellitus and family history of CVD, whereas for TG, 51% underestimation in the real association increased the HR of TG adjusted for the same variables for about 14%.
There were differences in RDRs of TC and TG between men and women. However, in other studies there were no variations in RDRs between men and women, for example Clrake et al. (8) found a decrease in RDRs between age groups that increased with follow-up time and participants aged 70 - 79 years had lower RDRs. In our analysis, the differences in RDRs between age groups and in each age group between RDR1 and RDR2 were not significant. However, the number of our participants in each age group was smaller than that study.
Our results shows that, considering HR as the effect measure, underestimation in the real association of risk factors with disease occurrence can have greater impact on the estimated risk when there is stronger association between risk factor and disease. Although, HDL-C had more attenuation in the real association, TC showed more percent changes in the corrected HR, due to stronger association with cardiovascular disease risk. As we have previously shown, the effect of hypercholesterolemia on CHD is more than TG and HDL-C; this effect in the TLGS is as high as the Framingham study (28, 29). Thus, considerable underestimation in the estimated HR of TC on CVDs, due to RDB, can reduce the fraction of cardiovascular risk attributed to hypercholesterolemia in population (30).
5.1. Strengths and Limitations
The obtained RDRs in this study might be influenced by several factors. The reliability study should be the representative of the cohort at baseline. We checked the distributions of variables in main and reliability study and evaluated the similarity of means and standard deviation of repeated measures. Furthermore, we used the log transformation of the variables that removes some effects of extreme values in skewed distributions.
We used parametric and nonparametric methods to estimate RDRs. The nonparametric method has no assumption on the distribution of data and form of exposure-disease relationship. Since this method uses differences in mean ranges of groups based on baseline measurement, it does not have any assumption about the equality of variances (5). Therefore, it might be suitable for studies with longer term follow-up (8), in which the assumptions of parametric methods can be violated by changes in population parameters, due to increasing age or changes in life style. Rosner’s regression method provides unbiased estimates when the means of replicate measurements are not equal (15). Both parametric and nonparametric methods give similar results when the variables have similar variances in baseline and repeated measures. Amouzegar et al. found similar RDRs by these two methods for FT4 and TSH in Tehran thyroid study (31). We found relatively similar RDRs from these two methods, especially RDRs of TC in men and TG in both men and women.
In this study, we evaluated the extent of random measurement error in exposure variables. However, it is possible to have random measurement error in outcome variables. Although the presence of random error in outcome variables would not introduce bias to the association of exposure and outcome, it would increase the standard error of estimates and widen confidence intervals, which lowers the power of study to detect the true association between exposure and outcome (32). In our study the outcome variable was binary, and in the TLGS, all information about CVD events gathered by verifying hospital records and discharge sheets, death certificates, legal medicine and if needed verbal autopsy. Then an outcome committee in TLGS verified all evidences and determined the cause of events. Therefore, we assumed negligible error in the outcome variable.
In conclusion, there were mild to moderate underestimation in the strength of real association of TC, TG and HDL-C with the risk of cardiovascular disease in the TLGS. The underestimation of the association between these variables with cardiovascular diseases for men and women were similar and did not change significantly between age groups or by body mass index of participants. This attenuation had more effect on the estimated HR for TC that had stronger relations with risk of cardiovascular disease.