
1. Background
Kidney transplantation is the most advantageous treatment for end-stage kidney disease, which is a main public health concern with escalating prevalence worldwide (1). Morbidity and mortality due to cardiovascular disease (CVD) remain substantially higher in kidney transplant recipients compared to the general population, although less frequent than dialysis patients (2-4).
Associations of hyperglycemia and post-transplant diabetes mellitus (PTDM) with premature CVD, increased risk of infection, decreased graft and patient’s survival are well-known among kidney transplant recipients (5, 6).
The incidence rate of this multifactorial complication varies in the literature, and it has been reported between 2% - 50% in the first year of transplantation (7). Family history of diabetes mellitus (DM), HCV infection, age, use of tacrolimus as maintenance therapy, low serum magnesium level, history of acute rejections early post-transplant and high body mass index (BMI) are considered as possible risk factors for development of PTDM (8-10).
Magnesium (Mg) as a dominant intracellular cation has an essential role in glucose metabolism, and hypomagnesemia has been commonly associated with type 2 DM among the general population (11, 12). Association of post-transplant hypomagnesemia with PTDM is a matter of debate (13-15), as its relationship with low pre-transplant magnesemia (9, 16, 17).
2. Objective
The aim of this retrospective cohort was to evaluate the association of pre-transplant serum magnesium level with blood glucose disturbances within the first 6 months of kidney transplantation. The existence of such an association could lead to implementation of preventive measures, resulting in better graft function and patient survival.
3. Methods
3.1. Study Population
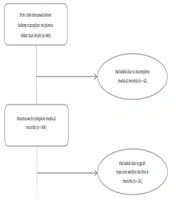
In this retrospective study, we reviewed medical records of deceased-donor kidney transplant recipients who received their transplant between September 2017 and December 2018 at the Imam Khomeini Hospital Complex (IKHC), Tehran, Iran. Eighty-nine first time kidney transplant recipients who received the same immunosuppressive treatment protocol following kidney transplantation and were followed for six months were included in the study (Figure 1). All the patients received induction therapy with anti-thymocyte globulin 1 mg/kg infusion (6 - 8 hours) in the operating room prior to the incision, which was repeated daily for 3 - 4 days, and also with methyl prednisolone 500, 250, and 125 mg on the day of transplant, as well as on the first and second day post-transplant surgery, respectively. Maintenance immunosuppressive therapy consisted of tacrolimus with the desired trough blood concentration of 8 - 10 ng/mL within the first three months post-transplantation and 5 - 7 ng/mL thereafter, mycophenolate sodium 360 mg thrice daily, and 1 mg/kg/day prednisolone (maximum 60 mg/day) which was rapidly tapered to 5 mg/day one month post-transplantation. All donors were standard heart beating, brain death donors. Unfortunately, due to the retrospective nature of the study, detailed information (height and weight) was not available about the donors. Patients with incomplete medical records, less than 18 years of age, multi-organ transplant, graft rejection, and history of DM or fasting plasma glucose (FPG) ≥ 100 mg/dL pre-transplantation were excluded (n = 91). Only one patient was HCV-positive. Pre-transplant serum magnesium levels were measured within 24 hours pre-kidney transplantation.

Figure 1.
Study flow diagram showing the results of applying exclusion and inclusion criteria.
3.2. Laboratory Evaluations
Venous blood samples were collected from all kidney transplant recipients after 12 - 14 hours of overnight fasting in the central laboratory at IKHC. Serum magnesium level was measured using a calorimetric method with a calmagite indicator (Pars Azmoon, Karaj, Iran; coefficient of variation [CV] = 0.7%) and an auto-analyzer (Cobas Mira). Fasting plasma glucose was determined with enzymatic calorimetric methods using the glucose oxidase test (Pars Azmoon; CV = 2.1%). Moreover, serum concentrations of triglyceride (TG), total cholesterol, low-density lipoprotein cholesterol (LDL-C), and high-density lipoprotein cholesterol (HDL-C) were measured by enzymatic methods on a multiple sample analyzer (Pars Azmoon, Karaj, Iran).
3.3. Definitions and Variables
Impaired fasting glucose (IFG) and PTDM were defined using American Diabetes Association criteria, i.e. an FPG of 100 to 125 mg/dL for IFG and 126 mg/dL or more on two different occasions or presence of diabetic symptoms plus a non-fasting plasma glucose more than 200 mg/dL for PTDM (18).
3.4. Ethics Statement
The study protocol was approved by the local ethics committee of Tehran University of Medical Sciences (#IR.TUMS.IKHC.REC.1396.4218). As no intervention was performed in this research and due to the anonymity of the patients under study, the prerequisite of written consent was waived.
3.5. Statistical Methods
SPSS (SPSS Inc., Chicago, IL, USA) version 16.0 software was used to report descriptive statistics. Statistical analyses of categorical and continuous variables were performed using chi-square and student’s t-test, respectively. Moreover, confounding variables were selected based on literature review and univariate analysis (P value less than 0.3). Odds ratio (OR) and 95% confidence interval (CI) were calculated, and multivariate logistic regression analysis was used to determine adjusted odds ratios (AORs) using STATA version 13.0 in order to select the best fit model. A P value less than 0.05 was considered statistically significant.
4. Results
Medical records of 180 kidney transplant recipients were reviewed, and a total of 89 patients were included in the study (Figure 1). The mean age of the recipients and donors was 41.90 ± 12.16 and 34.2 ± 12.5, respectively (n = 89). Demographic data are shown in Table 1.
Table 1.
Baseline Characteristics of the Study Populationa
| Normoglycemic (N = 45) | IFG (N = 37) | PTDM (N = 7) | IFG/PTDM (N = 44) | P Value (Normoglycemic vs. IFG/PTDM) | |
|---|---|---|---|---|---|
| Age, y | 41.24 ± 12.12 | 41.27 ± 12.44 | 49.43 ± 9.55 | 42.57 ± 12.30 | 0.610 |
| Sex | 0.220 | ||||
| Female | 20 (44.4) | 14 (37.8) | 0 (0) | 14 (31.8) | |
| Male | 25 (55.6) | 23 (62.2) | 7 (100) | 30 (68.2) | |
| BMI, kg/m2 | 24.25 ± 4.47 | 23.87 ± 5.09 | 26.30 ± 2.83 | 23.80 ± 5.34 | 0.666 |
| Pre-transplant serum Mg, mg/dL | 2.00 ± 0.27 | 1.83 ± 0.31 | 1.94 ± 0.30 | 1.84 ± 0.31 | 0.012 |
| Recipient eGFRb | 72.42 ± 22.21 | 70.75 ± 27.88 | 72.39 ± 17.05 | 71.01 ± 26.30 | 0.785 |
| Pre-transplant total cholesterol, mg/dL | 138.04 ± 36.95 | 141.89 ± 30.10 | 168.14 ± 33.66 | 146.07 ± 31.80 | 0.276 |
| Pre-transplant LDL-C, mg/dL | 101.65 ± 24.65; n = 26 | 105.68 ± 29.00; n = 25 | 115.40 ± 24.91; n = 5 | 107.30 ± 29.05; n = 30 | 0.440 |
| Pre-transplant HDL-C, mg/dL | 48.00 ± 5.83; n = 17 | 45.63 ± 3.93; n = 19 | 42.20 ± 4.55; n = 5 | 44.92 ± 4.21; n = 24 | 0.056 |
| Pre-transplant triglyceride, mg/dL | 157.86 ± 96.60; n = 42 | 157.83 ± 86.62; n = 36 | 193.67 ± 53.38; n = 6 | 162.95 ± 83.15 | 0.796 |
| Pre-transplant RRT | 0.924 | ||||
| Peritoneal dialysis | 0 (0) | 2 (5.4) | 1 (14.3) | 3 (6.8) | |
| Hemodialysis | 43 (95.6) | 33 (89.2) | 6 (85.7) | 39 (88.6) | |
| Pre-emptive | 2 (4.4) | 2 (5.4) | 0 (0) | 2 (4.5) | |
| Family history of DM | 8 (17.8) | 5 (13.5) | 1 (14.3) | 6 (13.6) | 0.592 |
| History of smoking | 4 (8.9) | 8 (21.6) | 3 (42.9) | 11 (25.0) | 0.042 |
| Donor age | 35.52 ± 11.82 | 32.41 ± 13.41 | 35.14 ± 12.79 | 32.84 ± 13.21 | 0.318 |
| Donor sex | 0.411 | ||||
| Female | 17 (37.8) | 10 (27.0) | 3 (42.9) | 13 (29.5) | |
| Male | 28 (62.2) | 27 (73.0) | 4 (57.1) | 31 (70.5) |
Abbreviations: BMI, body mass index; DM, diabetes mellitus; eGFR, estimated glomerular filtration rate; HDL-C, high density lipoprotein cholesterol; LDL-C, low density lipoprotein cholesterol; Mg, magnesium; RRT, renal replacement therapy.
aValues are expressed as No. (%) or mean ± SD.
beGFR was calculated using the chronic kidney disease epidemiology collaboration (CKD-EPI) equation 6 months post-kidney transplantation.
There were no statistically significant differences in terms of age, sex, estimated glomerular filtration rate, BMI, family history of DM, type of renal replacement therapy, serum TG and serum total cholesterol levels between patients with IFG or IFG/PTDM and normoglycemic kidney transplant recipients.
Family history of DM and history of smoking were positive in 16.1% and 16.9% of the patients, respectively. Frequency of PTDM and IFG 6 months post-transplant was 7.9% (n = 7) and 41.6% (n = 37), respectively; all the PTDM patients were male. There was no statistically significant difference in terms of pre-transplant serum Mg level between the PTDM and non-PTDM patients (1.94 ± 0.30 vs. 1.92 ± 0.30, P = 0.87). The mean pre-transplant serum Mg level was 1.92 ± 0.30 mg/dL in the study population (n = 89), and it was significantly lower in the IFG (n = 37) and IFG/PTDM (n = 44) groups compared to the normoglycemic (n = 45) recipients (1.83 ± 0.31 mg/dL vs. 2.00 ± 0.27 mg/dL, P = 0.008, and 1.84 ± 0.31 mg/dL vs. 2.00 ± 0.27 mg/dL, P = 0.012, respectively).
Prevalence of pre-transplant serum Mg less than 1.9 mg/dL was 34.8% in our study population, and it was more prevalent in the IFG and IFG/PTDM cases than in the normoglycemic patients (45.9% vs. 24.4%, n = 82, P = 0.041, and 45.5% vs. 24.4%, n = 89, P = 0.038, respectively). Patients with serum Mg less than 1.9 mg/dL were nearly 2.6 times more likely to develop IFG or IFG/PTDM within 6 months post-transplant (OR, 2.63; n = 82; 95% CI, 1.03 - 6.71, P = 0.044; OR, 2.57; n = 89; 95% CI, 1.04 - 6.35, P = 0.040, respectively). The anticipated confounding variables consisting of age, sex, BMI, pre-transplant total cholesterol, history of smoking, family history of DM and pre-transplant serum Mg less than 1.9 mg/dL were applied in the model 1. Moreover, considering the small number of the participants, variables with a p value less than 0.3 including sex, pre-transplant total cholesterol, history of smoking, and pre-transplant serum Mg less than 1.9 mg/dL were used in the model 2. AORs for serum Mg less than 1.9 mg/dL in the models 1 and 2 were only marginally significant in the IFG patients (Table 2). Although in the both adjusted models, patients with serum Mg less than 1.9 mg/dL were more likely to be in the IFG/PTDM group; AORs are shown in Table 2.
Table 2.
Crude and Adjusted Odds Ratios for IFG and IFG/PTDM 6 Months Post-Kidney Transplantation
| Unadjusted Odds Ratios for IFG/PTDMa | Adjusted Odds Ratios for IFG/PTDMa | Unadjusted Odds Ratios for IFGa | Adjusted Odds Ratios for IFGa | |||
|---|---|---|---|---|---|---|
| Model 1b | Model 2c | Model 1b | Model 2c | |||
| Sex (male) | 1.71 (0.72 - 4.07) | 2.31 (0.81 - 6.55) | 2.02 (0.75 - 5.41) | 1.31 (0.54 - 3.19) | 1.77 (0.61 - 5.21) | 1.62 (0.59 - 4.46) |
| Age, y | 1.01 (0.97 - 1.04) | 1.02 (0.98 - 1.06) | - | 1.00 (0.96 - 1.04) | 1.01 (0.67 - 1.05) | - |
| BMI, kg/m2 | 1.00 (0.91 - 1.09) | 0.98 (0.88 - 1.09) | - | 0.98 (0.891.08) | 0.98 (0.88 - 1.09) | - |
| Pre-transplant total cholesterol | 1.00 (0.99 - 1.02) | 1.00 (0.99 - 1.02) | 1.00 (0.99 - 1.02) | 1.00 (0.99 - 1.02) | 1.00 (0.99 - 1.02) | 1.00 (0.99 - 1.02) |
| History of smoking | 3.42 (0.99 - 11.72) | 2.30 (0.61 - 8.67) | 2.45 (0.66 - 9.15) | 2.83 (0.78 - 10.28) | 1.92 (0.47 - 7.75) | 2.02 (0.50 - 8.08) |
| Family history of diabetes mellitus | 0.73 (0.23 - 2.31) | 0.73 (0.21 - 2.50) | - | 0.72 (0.21 - 2.43) | 0.70 (0.19 - 2.55) | - |
| Pre-transplant Mg < 1.9 mg/dL | 2.57 (1.04 - 6.35) | 3.04 (1.09 - 8.48) | 2.83 (1.04 - 7.66) | 2.63 (1.03 - 6.71) | 2.93 (1.01 - 8.47) | 2.80 (1.00 - 7.84) |
Abbreviation: BMI, body mass index.
aOdds ratio (95% confidence interval).
bIncludes sex, age, BMI, pre-transplant total cholesterol, history of smoking, family history of diabetes mellitus, and pre-transplant serum Mg < 1.9 mg/dL.
cIncludes sex, pre-transplant total cholesterol, history of smoking, and pre-transplant serum Mg < 1.9 mg/dL.
Positive history of smoking was higher in the IFG/PTDM group than in the normoglycemic participants (25% vs. 8.9%, n = 89, P = 0.042), and AOR was not statistically significant between them (AOR, 2.3; 95% CI, 0.61 - 8.67).
5. Discussion
In this study, the incidence of 6-month post-transplant glycemic disturbances was high. PTDM and IFG were recognized in 7.9% and 41.6% of the participants, respectively. PTDM incidence is comparable with those reported in the literature (7). Mean serum Mg level was significantly lower in patients developing IFG or IFG/PTDM. The prevalence of pre-transplant serum magnesium less than 1.9 mg/dL was 34.8%. Patients with pre-transplant serum Mg level less than 1.9 mg/dL were 2.6 times more likely to develop IFG/PTDM within six months post-transplant. This association was still persistent after multivariate analysis. However, no relationship was found between pre-transplant magnesemia and PTDM.
PTDM is a frequent metabolic disorder following solid organ transplantation (9, 19). The reported incidence varies from 2 to 50% in kidney transplantation, depending on criteria used for diagnosis, duration of follow-up and immunosuppressive regimen (9, 20). This metabolic disorder not only enhances the risk of CVD and infections, but also affects patient and graft survival (9, 21).
PTDM is characterized by a combination of insulin resistance and decompensated insulin release, which is similar to type 2 DM (22). Various risk factors including unmodifiable (i.e., older age, genetic background, family history of DM) and modifiable (i.e., central obesity, immunosuppressive agents, hepatitis C infection, and smoking) risk factors have been implicated for the development of PTDM in previous studies (8, 23, 24). In addition, post-transplant glycemic disturbances and impaired glucose tolerance (IGT) are well-known risk factors for development of PTDM and are associated with increased mortality and graft loss (20, 25, 26).
In a study by Sezer et al. (24), PTDM was reported in 12.7% of kidney transplant recipients. In their study, the prevalence of smoking was 34.6% in PTDM participants and was reported as an independent risk factor for developing PTDM. HCV infection, older age, and higher BMI at the time of kidney transplantation have also been recognized as risk factors for PTDM (24). In our study, the prevalence of smoking was higher in the IFG/PTDM patients than in the normoglycemic recipients.
The actual role of the aforementioned risk factors for PTDM in kidney transplant recipients is a matter of debate (7, 24, 27). Pre-transplant hypomagnesemia has gained attention as an independent risk factor for PTDM in the past few years (16, 19). The diabetogenic effects of low serum Mg level have not yet been identified. Altered cellular glucose transport, decreased insulin secretion by pancreas and reduced insulin sensitivity through impairment in the insulin signal transduction pathway, have all been proposed in comprehensive studies (28-31).
Augusto et al. (16) evaluated the effect of pre-transplant serum Mg level on the development of PTDM in 154 kidney transplant recipients. They found that pre-transplant magnesium level was lower in patients with PTDM during one-year follow-up (2.04 ± 0.32 mg/dL vs. 2.22 ± 0.35 mg/dL, P = 0.014). In addition, when the patients were stratified into tertiles of magnesium level, patients in the lowest tertile developed PTDM more frequently than those in the highest tertile (Mg < 2 mg/dL vs. Mg > 2.3 mg/dL, P = 0.039) (16). In another study, Sinangil et al. (19) investigated this relationship among 419 non-diabetic kidney transplant recipients. Similarly, they reported that pre-transplant serum Mg level was lower in patients who developed PTDM. They classified the patients according to magnesium level quartiles and observed that the frequency of PTDM was significantly higher in the lower quartile group (Mg < 2.1 mg/dL, P < 0.001) (19).
In the present study, the relationship was evaluated between pre-transplant serum magnesium level and post-transplant glycemic disturbances. Patients who developed IFG/PTDM within 6 months post-transplant had lower pre-transplant serum magnesium level compared to the normoglycemic patients (1.84 ± 0.31 mg/dL vs. 2.00 ± 0.27 mg/dL, P = 0.012). We found an association between pre-transplant serum Mg less than 1.9 mg/dL and the development of post-transplant IFG or IFG/PTDM. However, pre-transplant magnesemia and PTDM were not associated in our study, which could be explained by the small size of our retrospective cohort.
Oral glucose tolerance test (OGTT) is defined as the gold standard test for diagnosis of PTDM. However, FPG as a screening test can identify high risk population and may curtail the need for OGTT (18). Early detection of conditions such as IFG and IGT is important in kidney transplant recipients to prevent further deterioration in transplant outcomes. Recently, a randomized controlled trial has been designed by Alnasrallah et al. (20), in which the efficacy of metformin after renal transplant is assessed in patients with IGT. In their study, the prevalence of IGT and PTDM was 30.8% and 12.8% using OGTT, respectively. The results of their pilot study showed that metformin was tolerable with no serious adverse effects in kidney recipients (20). Although they showed the safety and feasibility of metformin in kidney transplants with IGT, further research is required to safely use metformin in patients with IGT for prevention of PTDM.
It should be pointed out that we had some limitations in our study. The small number of our cases, single measurement of pre-transplant serum Mg and retrospective nature of this study were the most important limitations.
5.1. Conclusions
Pre-transplant hypomagnesemia may be considered as a risk factor for developing post-transplant glycemic disturbances. Patients with lower pre-transplant serum magnesium level could be at a higher risk for developing IFG or IFG/PTDM. Further multicenter prospective cohort studies are required to clarify this causal association. Measuring of serum magnesium concentration before kidney transplant and using proper supplementation may diminish the risk of post-transplant hyperglycemia which are proposed for future studies.