
1. Background
Immunization is a lifesaving and cost-effective intervention globally (1, 2). For over two centuries, vaccines have safely reduced the burden of diseases such as polio, measles, and smallpox, helping children grow up healthier and happier (1).
In 1984, the Islamic Republic of Iran launched the expanded program on immunization (EPI). The national immunization program of Iran provides the following vaccines free of charge: At birth, Bacillus Calmette-Guerin (BCG), hepatitis B, and OPV zero (bivalent oral polio vaccine containing type 1 and 3 serotypes). At 2 months, children receive Pentavalent 1 (diphtheria, pertussis, tetanus, hepatitis B, and Haemophilus influenzae type b) and OPV1. At 4 months, Pentavalent 2, bOPV2, and inactivated polio vaccine (IPV) are administered. At 6 months, Pentavalent 3 and bOPV3 are given. At 1 year, MMR1 (measles, mumps, and rubella) is provided, followed by MMR2, DTP1 (diphtheria, tetanus, and pertussis), and OPV (first booster) at 18 months. At 6 years, DTP2 and OPV (second booster) are administered (3).
The COVID-19 pandemic disrupted childhood immunization coverage and increased vaccine misinformation globally, leaving children at risk of preventable diseases such as polio (4). Information from 14 countries in the Eastern Mediterranean Region Office (EMRO) indicates that, as of early April 2020, vaccination campaigns were halted, and routine service delivery was significantly reduced in many areas (5).
The global polio eradication initiative (GPEI), established by the World Health Assembly in 1988 (6), redirected resources to address the impact of COVID-19. From March to May 2020, house-to-house supplementary immunization activities (SIAs) were suspended, resulting in 62 halted polio vaccine SIAs across 28 countries (7). Although polio cases in Pakistan had decreased from 2014 to 2018, a dramatic increase in cases was observed in 2019 (8).
According to the World Health Organization's (WHO) interim report on the "Fourth round of the global pulse survey on continuity of essential health services during the COVID-19 pandemic", health systems are showing signs of recovery. By early 2023, disruptions in routine health services decreased from 56% in mid-2020 to 23% in early 2023 among 84 countries surveyed. However, ongoing disruptions are attributed to factors such as low healthcare-seeking behavior and limited resources. Dr. Rudi Eggers of the WHO emphasized the need for continued investment in health service recovery and resilience (9).
Sistan and Baluchistan, one of Iran’s least developed provinces, borders two polio-endemic countries, Pakistan and Afghanistan (10). The health of children in Sistan and Baluchistan is crucial not only locally but also for the global goal of polio eradication. According to the 2019 study by Zahraei et al., vaccination coverage for children aged 24 - 35 months in Sistan and Baluchistan Province was 95% (11).
2. Objectives
This study aims to compare on-time vaccination rates as a healthcare index among under-five children in Zahedan, the provincial capital, before and after the pandemic.
3. Methods
3.1. Study Design and Subjects
This cross-sectional study was conducted in two periods: Six months before the COVID-19 pandemic (March-September 2019, n = 75,863 children) and six months during the pandemic onset (March-September 2020, n = 75,960 children). The study population comprised all children under the age of five registered in the integrated comprehensive health information system (ICHIS) in both rural and urban areas of Zahedan, the capital of Sistan and Baluchistan province. This province is one of Iran’s least developed regions and shares a long border with Pakistan and Afghanistan. Sampling was performed using a census approach. The study was approved by the Ethics Council of Zahedan University of Medical Sciences (ethical code: IR.ZAUMS.REC.1400.174).
3.2. Measurement
Data on the target population and vaccination status were extracted from the electronic vaccination registry available through the ICHIS. The percentages of on-time vaccinations and those not vaccinated (including delayed or missed vaccinations) were calculated by vaccine type, number of vaccine doses, and place of residence. A vaccination delay was defined as being more than two weeks past the recommended schedule.
3.3. Statistical Analysis
Descriptive statistics and chi-square tests were used for data analysis, with the significance level set at 0.05. Statistical analyses were conducted using the statistical package for the social sciences (SPSS) version 22.0 (IBM Corp., Armonk, NY, USA).
4. Results
A total of 75,863 children under the age of 5 were studied from March to September 2019, and 75,960 children were studied from March to September 2020. The percentages of on-time and not vaccinated (including delayed or missed vaccinations) by place of residence are detailed in Tables 1 - 7.
Table 1.
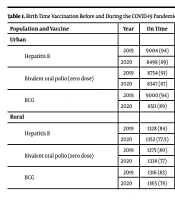
Birth Time Vaccination Before and During the COVID-19 Pandemic in Zahedan Urban and Rural Areas a
| Population and Vaccine | Year | On Time | Not-vaccinated or Delayed Vaccination | Total Eligible Population | P-Value |
|---|---|---|---|---|---|
| Urban | |||||
| Hepatitis B | 2019 | 9004 (94) | 601 (6) | 9605 (100) | < 0.001 |
| 2020 | 8498 (89) | 1050 (11) | 9548 (100) | ||
| Bivalent oral polio (zero dose) | 2019 | 8754 (91) | 851 (9) | 9605 (100) | < 0.001 |
| 2020 | 8347 (87) | 1201 (13) | 9548 (100) | ||
| BCG | 2019 | 9000 (94) | 605 (6) | 9605 (100) | < 0.001 |
| 2020 | 8511 (89) | 1037 (11) | 9548 (100) | ||
| Rural | |||||
| Hepatitis B | 2019 | 1328 (84) | 258 (16) | 1586 (100) | < 0.001 |
| 2020 | 1352 (77.5) | 393 (22.5) | 1745 (100) | ||
| Bivalent oral polio (zero dose) | 2019 | 1275 (80) | 311 (20) | 1586 (100) | 0.009 |
| 2020 | 1338 (77) | 407 (23) | 1745 (100) | ||
| BCG | 2019 | 1316 (83) | 270 (17) | 1586 (100) | 0.001 |
| 2020 | 1365 (78) | 380 (22) | 1745 (100) |
Abbreviation: BCG, Bacillus Calmette-Guerin.
a Values are expressed as No. (%).
Table 2.
Two Months Old Vaccination Before and During the COVID-19 Pandemic in the Zahedan Urban and Rural Areas a
| Populations and Vaccines | Year | On Time | Not-vaccinated or Delayed Vaccination | Total Eligible Population | P-Value |
|---|---|---|---|---|---|
| Urban | |||||
| Bivalent oral polio (first dose) | 2019 | 8859 (97.8) | 197 (2.2) | 9056 (100) | < 0.001 |
| 2020 | 8847 (98.6) | 128 (1.4) | 8975 (100) | ||
| Pentavalent vaccine (first dose) | 2019 | 8852 (98.6) | 123 (1.4) | 9056 (100) | < 0.001 |
| 2020 | 8852 (97.7) | 204 (2.3) | 8975 (100) | ||
| Rural | |||||
| Bivalent oral polio (first dose) | 2019 | 1354 (90) | 146 (10) | 1500 (100) | < 0.004 |
| 2020 | 1459 (87) | 218 (13) | 1677 (100) | ||
| Pentavalent vaccine (first dose) | 2019 | 1355 (90) | 145 (10) | 1500 (100) | 0.002 |
| 2020 | 1456 (87) | 221 (13) | 1677 (100) |
a Values are expressed as No. (%).
Table 3.
Four Months Old Vaccination Before and During the COVID-19 Pandemic in the Zahedan Urban and Rural Areas a
| Populations and Vaccines | Year | On Time | Not-vaccinated or Delayed Vaccination | Total Eligible Population | P-Value |
|---|---|---|---|---|---|
| Urban | |||||
| Bivalent oral polio (second dose) | 2019 | 8422 (95) | 441 (5) | 8863 (100) | 0.283 |
| 2020 | 8398 (94.7) | 473 (5.3) | 8871 (100) | ||
| IPV | 2019 | 8319 (93.9) | 544 (6.1) | 8863 (100) | 0.056 |
| 2020 | 8386 (96.2) | 485 (3.8) | 8871 (100) | ||
| Pentavalent vaccine (second dose) | 2019 | 8403 (94.8) | 460 (5.2) | 8863 (100) | 0.418 |
| 2020 | 8393 (94.5) | 485 (5.5) | 8871 (100) | ||
| Rural | |||||
| Bivalent oral polio (second dose) | 2019 | 1255 (85) | 230 (15) | 1485 (100) | 0.064 |
| 2020 | 1366 (82) | 299 (18) | 1665 (100) | ||
| IPV | 2019 | 1223 (82) | 262 (18) | 1485 (100) | 0.378 |
| 2020 | 1351 (81) | 314 (19) | 1665 (100) | ||
| Pentavalent vaccine (second dose) | 2019 | 1253 (84) | 232 (16) | 1485 (100) | 0.026 |
| 2020 | 1355 (81) | 310 (19) | 1665 (100) |
a Values are expressed as No. (%).
Table 4.
Six Months Old Vaccination Before and During the COVID-19 Pandemic in the Zahedan Urban and Rural Areas a
| Populations and Vaccines | Year | On Time | Not-vaccinated or Delayed Vaccination | Total Eligible Population | P-Value |
|---|---|---|---|---|---|
| Urban | |||||
| Bivalent oral polio (third dode) | 2019 | 8155 (93) | 613 (3.9) | 8768 (100) | < 0.001 |
| 2020 | 7608 (87.7) | 1071 (12.3) | 8679 (100) | ||
| Pentavalent vaccine (third dose) | 2019 | 8033 (91.6) | 735 (8.4) | 8768 (100) | < 0.001 |
| 2020 | 7569 (87.2) | 1110 (12.8) | 8679 (100) | ||
| Rural | |||||
| Bivalent oral polio (third dode) | 2019 | 1190 (81) | 276 (19) | 1466 (100) | 0.052 |
| 2020 | 1271 (78) | 351 (22) | 1622 (100) | ||
| Pentavalent vaccine (third dose) | 2019 | 1166 (80) | 300 (20) | 1466 (100) | 0.089 |
| 2020 | 1249 (77) | 373 (23) | 1622 (100) |
a Values are expressed as No. (%).
Table 5.
Twelve Months Old Vaccination Before and During the COVID-19 Pandemic in the Zahedan Urban and Rural Areas a
| Population | Vaccine | Year | On Time | Not-vaccinated or Delayed Vaccination | Total Eligible Population | P-Value |
|---|---|---|---|---|---|---|
| Urban | MMR (first dose) | 2019 | 8018 (79.9) | 2011 (20.1) | 10029 (100) | < 0.001 |
| 2020 | 8738 (91) | 867 (9) | 9605 (100) | |||
| Rural | 2019 | 855 (56) | 677 (44) | 1532 (100) | ||
| 2020 | 1039 (71) | 427 (29) | 1466 (100) |
a Values are expressed as No. (%).
Table 6.
Eighteen Months Old Vaccination Before and During the COVID-19 Pandemic in the Zahedan Urban and Rural Areas a
| Populations and Vaccines | Year | On Time | Not-vaccinated or Delayed Vaccination | Total Eligible Population | P-Value |
|---|---|---|---|---|---|
| Urban | |||||
| Bivalent oral polio (first booster) | 2019 | 6496 (69.9) | 2801 (30.1) | 9297 (100) | < 0.001 |
| 2020 | 7087 (80.8) | 1681 (19.2) | 8768 (100) | ||
| MMR (second dose) | 2019 | 6415 (69) | 2882 (31) | 9297 (100) | < 0.001 |
| 2020 | 6961 (79.4) | 1807 (20.6) | 8768 (100) | ||
| Trivalent vaccine (first booster) | 2019 | 6504 (70) | 2793 (30) | 9297 (100) | < 0.001 |
| 2020 | 7110 (81.1) | 1658 (18.9) | 8768 (100) | ||
| Rural | |||||
| Bivalent oral polio (first booster) | 2019 | 855 (56) | 677 (44) | 1532 (100) | < 0.001 |
| 2020 | 1039 (71) | 427 (29) | 1466 (100) | ||
| MMR (second dose) | 2019 | 852 (56) | 680 (44) | 1532 (100) | < 0.001 |
| 2020 | 1021 (70) | 445 (30) | 1466 (100) | ||
| Trivalent vaccine (first booster) | 2019 | 851 (56) | 681 (44) | 1532 (100) | < 0.001 |
| 2020 | 1041 (71) | 425 (29) | 1466 (100) |
a Values are expressed as No. (%).
Table 7.
Six Years Old Vaccination Before and During the COVID-19 Pandemic in the Zahedan Urban and Rural Areas a
| Populations and Vaccines | Year | On Time | Not-vaccinated or Delayed Vaccination | Total Eligible Population | P-Value |
|---|---|---|---|---|---|
| Urban | |||||
| Bivalent oral polio (second booster) | 2019 | 9078 (96.4) | 340 (3.6) | 9418 (100) | < 0.001 |
| 2020 | 8354 (87.8) | 1161 (12.2) | 9506 (100) | ||
| Trivalent vaccine (second booster) | 2019 | 8539 (90.7) | 879 (9.3) | 9418 (100) | < 0.001 |
| 2020 | 7932 (83.4) | 1574 (16.6) | 9605 (100) | ||
| Rural | |||||
| Bivalent oral polio (second booster) | 2019 | 851 (50.3) | 841 (49.7) | 1692 (100) | 0.863 |
| 2020 | 859 (50) | 859 (50) | 1718 (100) | ||
| Trivalent vaccine (second booster) | 2019 | 788 (46.6) | 904 (53.4) | 1692 (100) | 0.410 |
| 2020 | 825 (48) | 893 (52) | 1718 (100) |
a Values are expressed as No. (%).
Table 1 demonstrates a significant increase in the percentage of delayed or missed vaccinations at birth (Hepatitis B, OPV zero, and BCG) in both urban and rural areas (P < 0.001).
Table 2 shows a significant improvement in the percentage of on-time vaccinations at 2 months (Pentavalent 1 and OPV1) in urban areas. Conversely, in rural areas, the percentage of delayed or missed vaccinations increased significantly (P < 0.001).
Table 3 indicates a different trend for 4-month vaccinations between urban and rural areas. Rural areas experienced a significant decrease in on-time Bivalent Oral Polio 2 and Pentavalent 2 vaccinations (P = 0.064, P = 0.026), while urban areas did not show a significant change before and after the pandemic.
Table 4 reveals a significant decrease in on-time vaccinations at 6 months (Bivalent Oral Polio 3 and Pentavalent 3) in urban areas (P < 0.001). In contrast, rural areas did not exhibit a statistically significant change.
Table 5 summarizes a significant improvement in MMR1 vaccination rates in both urban and rural areas (P < 0.001).
Table 6 shows significant improvements in 18-month vaccinations [bivalent oral polio (first booster), Trivalent (first booster), and MMR2] in both urban and rural areas (P < 0.001).
Table 7 reports a significant decline in on-time vaccinations for 6-year-olds [bivalent oral polio (second booster) and Trivalent Vaccine (second booster)] in urban populations (P < 0.001).
Additionally, all tables indicate that on-time vaccination rates were consistently lower in rural populations compared to urban populations both before and during the pandemic.
5. Discussion
Our study revealed significant disruptions in vaccination coverage for children under five, with noticeable delays particularly in vaccinations at birth in both urban and rural populations. The delays were more pronounced for specific vaccines administered at two and four months in rural areas and at six months and six years in urban areas. Among the most affected were the pentavalent, trivalent, and oral polio vaccines. Additionally, our findings demonstrated that rural populations exhibited lower rates of on-time vaccination compared to their urban counterparts, both before and after the COVID-19 pandemic.
These findings align with studies from various countries that reported declines in vaccination coverage during the early phases of the COVID-19 pandemic (4, 12-20). For example, the WHO European Region highlighted instances of missed first doses of the measles-containing vaccine in 2019, underscoring the heightened risk of disease outbreaks when routine vaccinations are missed. In that year, over 100,000 individuals across all age groups in Europe were infected with the measles virus due to an immunity gap (1).
Alhaddad et al. (16) observed a reduction in vaccination coverage rates for the MMR vaccine post-pandemic in southeastern Iraq. However, our study found an improvement in on-time MMR vaccination after the pandemic. Similarly, Causey et al. (21) estimated that globally, 30 million children missed doses of the DTP3 vaccine and 27.2 million missed the first dose of the measles-containing vaccine between January and December 2020, aligning with our findings for DTP3 but contrasting with the measles vaccination data. Furthermore, the WHO reported that in 2021, approximately 25 million children missed one or more doses of DTP through routine immunization services. This represents an increase of 2 million compared to 2020 and 6 million compared to 2019, highlighting the growing number of children susceptible to preventable diseases.
The primary reasons for these disruptions include misinformation, supply chain issues, and a lack of resources caused by the pandemic.
The majority of children who missed DTP doses are from low- and middle-income countries, with India, Nigeria, Indonesia, Ethiopia, and the Philippines reporting the highest numbers. Countries such as Myanmar and Mozambique experienced significant relative increases in unvaccinated children between 2019 and 2021 (22). Similarly, in our study, both rural and urban areas experienced disruptions in DTP (trivalent or pentavalent) vaccination after the pandemic.
Polio remains another critical area of concern. The GPEI was launched in 1988, and by 2020, only Pakistan and Afghanistan had reported polio as endemic (23, 24). Although Iran has been polio-free since 2001 (3, 25, 26), there has been a resurgence of polio cases in neighboring countries, particularly in Pakistan and Afghanistan. Polio cases in these countries increased from 12 and 21 in 2018 to 147 and 29, respectively, in 2019 (27). Pakistan experienced severe disruptions in its polio vaccination efforts due to the pandemic, with approximately 40 million children missing their polio vaccinations as mass campaigns were halted in March 2020 under GPEI directives.
The reallocation of resources from polio eradication to COVID-19 mitigation efforts further delayed immunization campaigns. From March to May 2020, 28 countries suspended a total of 62 polio vaccine campaigns (7). In Pakistan, the reemergence of the P2 strain of the poliovirus, which had been eradicated in 2014, was reported in 22 cases in 2020 (28). Pakistan reported 306 polio cases in 2014, which decreased to 8 cases in 2017 but rose again to 147 cases in 2019 and 84 in 2020, with 65% of environmental samples testing positive for poliovirus (29). These developments are particularly concerning for Iran, especially in its southeastern regions, such as Sistan and Baluchistan, which share borders with Pakistan. The disruption of polio vaccination observed in our study could exacerbate the situation and pose a global threat to polio eradication efforts.
Missed or delayed routine vaccinations increase the risk of vaccine-preventable disease outbreaks and related mortality (19, 20, 30, 31). The reasons for missed childhood vaccinations reported in various studies include concerns about contracting COVID-19 at vaccination clinics (15%), fears of infection while leaving the house (11%), healthcare provider recommendations (10%), clinic closures (10%), and prioritization of services for those in greater need (10%) (32). Other studies have identified additional factors such as inadequate availability of personal protective equipment (PPE), reduced clinic hours, lack of transportation, and parental fear of infection (5, 33).
Despite the prioritization of vaccination services in primary care settings, the emphasis on protecting against COVID-19 diminished the perceived importance of routine immunizations. This shift in focus contributed to the substantial impairments in childhood vaccination coverage observed during the pandemic.
5.1. Limitation
Electronic vaccination registries often rely on healthcare provider participation, and variations in the use or updating of these systems across regions can result in inconsistencies. This issue is particularly pronounced in rural areas, where less developed healthcare infrastructure may contribute to underreporting of vaccination rates.
5.2. Conclusions
The COVID-19 pandemic significantly disrupted childhood vaccination programs, causing delays and missed doses, particularly in rural populations and for key vaccines such as pentavalent, trivalent, and oral polio. These findings align with global patterns observed in other studies and emphasize the broader impact of the pandemic on immunization services worldwide. The differential impact on rural and urban areas, along with the notable recovery in some vaccine coverage post-pandemic, underscores the need for targeted interventions to address vaccination gaps.
5.3. Implications for Practice
Healthcare practitioners must prioritize routine immunization alongside pandemic-related care to ensure vaccination schedules are maintained. Strengthening community outreach in rural areas, improving access to vaccination clinics, and addressing parental concerns about safety in healthcare settings are essential measures to mitigate the long-term consequences of missed vaccinations.
5.4. Implications for Policy
Policymakers should strengthen the resilience of immunization systems, particularly during times of crisis. This involves integrating routine vaccinations into emergency preparedness plans and ensuring sufficient resources for vaccine delivery during disruptions. Additionally, addressing misinformation and maintaining supply chain stability are essential to prevent future declines in vaccination coverage.
5.5. Implications for Future Research
Future research should investigate the long-term effects of delayed childhood vaccinations on public health outcomes, particularly in low- and middle-income countries. Additionally, studies should evaluate the effectiveness of post-pandemic recovery strategies for immunization programs and explore the role of digital health technologies in improving vaccination coverage and monitoring.