
1. Background
The prevalence of obesity has increased all over the world in the last two decades (1). Pediatric obesity is a significant global problem as the number of overweight or obese children increased more than tenfold from 1975 to 2016 (2). Although the frequency of obesity is reported to be stable in many high-income countries, there are emerging reports that the severity of obesity is increasing (3). Obesity is a disordered state of lipid metabolism that leads to intracellular lipid and lipoprotein accumulation as a result of increased free fatty acid synthesis and decreased free fatty acid oxidation. This process can cause cellular dysfunction in various tissues, including cardiac myocytes, hepatocytes, and pancreatic beta cells (4). The mechanisms underpinning the pathogenic effects of adipocyte hypertrophy (in response to excessive caloric intake) on the cardiovascular and metabolic systems are well documented. Increased adipose tissue and adipokine dysregulation lead to sodium retention, activation of the renin-angiotensin-aldosterone system (RAAS), hypertension, insulin resistance, and increased inflammation (1, 4). It is well known that obesity is a risk factor for dyslipidemia (5).
It is anticipated that obese children may become obese adults at increased risk for cardiovascular disease (CVD). Regardless of the method of measurement, it has been shown that excess fat in children is strongly associated with the development of atherosclerosis and hypertension (4-7). The atherogenic lipid pattern associated with childhood obesity consists of a combination of elevated triglycerides (TG), low high-density lipoprotein (HDL-C), and low-density lipoprotein (LDL-C) elevated slightly above the upper limit of normal (8). The prevalence of dyslipidemia in obese children has been reported to be between 45.8 - 69.9% (9-11). In Turkey, this rate has been reported to be between 42.9 - 51.9% (12-14). Preventing or reducing obesity, dyslipidemia, and hypertension in children and adolescents can result in reduced mortality and morbidity associated with CVD in adults.
This retrospective cohort study was conducted on a large population of Turkish children.
2. Objectives
We aimed to evaluate the frequency of dyslipidemia and related factors in obese children and adolescents.
3. Methods
This study included children and adolescents who attended our outpatient clinic between March 2013 and September 2017 with the complaint of obesity. The study was designed as a single-center retrospective cohort study.
We included children in the age range of 6 - 18 years with body mass index (BMI) greater than the 95th percentile for age and gender, according to the Centers for Disease Control and Prevention (CDC) standards (15). Exclusion criteria were: (1) Patients with hypothyroidism (except subclinical hypothyroidism), Cushing syndrome, or receiving glucocorticoid drugs; (2) patients with familial dyslipidemia; and (3) patients with syndromic and monogenic obesity. The database of obese children was reviewed retrospectively.
The children underwent a complete examination, including anthropometric measurements. Pubertal development was assessed by a pediatric endocrinologist based on Tanner stage. A testicular volume of 4 mL or more in boys and a score of ≥ 2 in breast development in girls, according to Tanner staging, was accepted as indicating puberty onset (16, 17), and subjects were simply grouped into pre-pubertal or pubertal. The axillae and back of the neck were inspected for acanthosis nigricans. Skin fissures (striae) on the abdomen and buttocks were examined. Anthropometric assessments were performed in the morning after a night fasting with underwear and no shoes on. Height was measured with a Harpenden stadiometer (with an accuracy of 0.1 mm). Weight was calculated with a SECA scale (with an accuracy of 0.1 kg). The BMI measurement was calculated by the standard formula of weight in kilograms divided by the square of the height in meters. Waist circumference was measured at the level of the umbilicus while standing, undressed, and breathing regularly. Hip circumference was measured only with underwear and at the level of the iliac crest. Blood pressure was measured with a standard mercury sphygmomanometer while relaxed. Hypertension was defined as systolic blood pressure above the 95th percentile for age and gender (18).
Homeostasis model assessment for insulin ratio (HOMA-IR) was calculated according to the following formula: [Fasting insulin (mIU/mL) × fasting glucose (mmol/L)/22.5] (19). HOMA-IR > 3.16 in pubertal children and > 2.5 in pre-pubertal children were accepted as indicating insulin resistance (20, 21). Samples were taken from the patients for determination of blood glucose, insulin, alanine aminotransferase (ALT), aspartate aminotransferase (AST), total serum cholesterol (TC), LDL-C, HDL-C, and triglyceride levels after at least 12 - 14 hours of fasting. Any of the following findings were accepted as indicating dyslipidemia: (1) Serum TC levels over 200 mg/dL (> 95th percentile); (2) triglyceride (TG) levels over 150 mg/dL; (3) LDL-C level over 130 mg/dL, or HDL-C level under 40 mg/dL (22). Subclinical hypothyroidism was defined as a moderate to mild (5.5 - 10 mIU/L) increase in serum TSH levels with normal serum fT4 levels (23).
The glucose oxidase method was used for blood glucose measurement, and lipid measurement was performed using the Olympus AU 2700 device. Serum insulin level was measured by electrochemiluminescence method with Roche Modular Analytics E170 immunoassay analyzer (Roche Diagnostics, Indianapolis, IN, USA). Serum TSH, fT4, and free tri-iodothyronine (fT3) levels were analyzed by electrochemical irradiance immunoassay using the Elecsys 2010 modular analytical E170 device (Roche Diagnostics, Indianapolis, IN, USA). Upper abdominal ultrasonographic examination was performed to diagnose hepatosteatosis using GE LOGIC S8 ultrasound device (General Electric, USA). Liver ultrasonography findings were classified as normal liver appearance (no hepatic steatosis), mild (stage 1), moderate (stage 2), and severe (stage 3) hepatic steatosis (24).
3.1. Statistical Analysis
Statistical Package for Social Sciences (SPSS) version 21.0 was used for statistical analysis (SPSS Inc., Chicago, IL, USA). Categorical variables were analyzed using the chi-square test. The normal distribution of the data was evaluated with the Kolmogorov-Smirnov test. Student t-test and Mann-Whitney U test were used to compare the groups for numerical data, as appropriate. Correlations between numerical variables were assessed with Spearman’s test. Logistic regression analysis was performed to determine possible risk factors affecting the dyslipidemia dependent variable. The fit of the model was examined by the Hosmer-Lemeshow test. In categorical variables, the first category reference was accepted as the category. The significance of the model coefficients was tested with the Wald test. A P-value < 0.05 was considered as significant.
4. Results
In this cohort study, out of a total of 1,136 children and adolescents, 527 (46.4%) were female, and 609 (53.6%) were male. The mean age of the patients was 11.4 ± 3.0 years, and 644 (56.8%) cases were pubertal. The mean BMI was 28.0 ± 4.5 kg/m2, and mean BMI SDS was 2.2 ± 0.4. HOMA-IR, waist/hip ratio, hepatosteatosis, BMI-SDS, and fasting glucose levels were higher in males (P-values 0.002, < 0.001, < 0.001, < 0.001, and < 0.001, respectively). Fatty liver was seen in 37.0% of females and 50.6% of males (P < 0.001). The demographic characteristics and laboratory data are shown in Table 1. Fasting insulin, HOMA-IR, hypertriglyceridemia, low HDL-C, dyslipidemia, hypertension, and hepatosteatosis were significantly more likely in pubertal cases (P-values < 0.001, < 0.001, < 0.001, < 0.001, < 0.001, 0.002, and < 0.001, respectively). Fatty liver was present in 37.3% of participants in the pre-pubertal group and 49.1% in the pubertal group (P < 0.001). The demographic characteristics and laboratory findings of pre-pubertal and pubertal cases are given and compared in Table 2.
Table 1.
Distribution of Demographic Characteristics and Laboratory Findings for the Whole Cohort and by Gender a
| Total | Female | Male | P | |
|---|---|---|---|---|
| No. (%) | 1136 | 527 | 609 | |
| Age (y) | 11.4 ± 3.0 | 11.5 ± 3.0 | 11.3 ± 3.0 | NS |
| BMI (kg/m2) | 28.0 ± 4.5 | 28.1 ± 4.7 | 28.0 ± 4.2 | NS |
| BMI SDS | 2.2 ± 0.4 | 2.1+0.3 | 2.2 ± 0.4 | < 0.001 |
| Fasting glucose (mg/dL) | 89.2 ± 8.1 | 88.1 ± 7.7 | 90.1 ± 8.3 | < 0.001 |
| Fasting insulin (IU/mL) | 18.2 ± 11.2 | 18.9 ± 11.7 | 17.7 ± 10.8 | NS |
| HOMA-IR b | 3.8 (2.4, 5.3) | 3.8 (2.4, 5.4) | 3.7 (2.4, 5.2) | NS |
| TG (mg/dL) b | 113 (83, 154) | 112 (84, 152) | 113 (82, 155) | NS |
| TC (mg/dL) | 167.5 ± 33.7 | 165.9 ± 31.0 | 169.0 ± 35.8 | NS |
| LDL- cholesterol (mg/dL) | 100.4 ± 29.4 | 99.7 ± 27.2 | 101.1 ± 31.3 | NS |
| HDL- cholesterol (mg/dL) | 44.1 ± 12.1 | 44.4 ± 12.9 | 43.8 ± 11.4 | NS |
| WHR | 0.95 ± 0.03 | 0.94 ± 0.03 | 0.96 ± 0.03 | < 0.001 |
| IR (%) | 54.1 | 50.7 | 57.3 | 0.023 |
| Hypertension (%) | 18.3 | 19.4 | 17.4 | NS |
| Dyslipidemia (%) | 56.7 | 54.5 | 58.6 | NS |
| Hypercholesterolemia | 16.0 | 14.6 | 17.3 | NS |
| Hypertriglyceridemia | 25.9 | 25.8 | 26.0 | NS |
| High LDL-C levels | 15.0 | 14.8 | 15.2 | NS |
| Low HDL-C levels | 36.8 | 35.7 | 37.8 | NS |
| Hepatosteatosis (%) | 44 | 37 | 50.6 | < 0.001 |
| Grade 1 | 38.6 | 34.9 | 43.3 | 0.004 |
| Grade 2 - 3 | 5.5 | 3.2 | 7.6 | 0.001 |
Abbreviations: BMI SDS, mean body mass index standard deviation score; HOMA-IR, homeostasis model assessment of insulin resistance; TG, triglyceride; HDL, high-density lipoprotein; LDL, low-density lipoprotein; TC, total cholesterol; WHR, waist-to-hip ratio; IR, insulin resistance; NS, not significant.
a Data are shown as mean ± standard deviation unless indicated.
b Median (interquartile range: 25th and 75th percentiles)
Table 2.
Distribution and Comparison of Demographic Characteristics and Laboratory Findings by Pubertal Status a
| Prepubertal | Pubertal | P | |
|---|---|---|---|
| No. (%) | 492 | 644 | |
| Age (y) | 8.7 ± 1,7 | 13.2 ± 2.2 | < 0.001 |
| BMI (kg/m2) | 25.2 ± 3.4 | 30.0 ± 4.1 | < 0.001 |
| BMI SDS | 2.3 ± 0.5 | 2.1 ± 0.3 | < 0.001 |
| Fasting glucose (mg/dL) | 89.1 ± 8.3 | 89.2 ± 7.9 | NS |
| Fasting insulin (IU/mL) | 14.1 ± 10.6 | 21.4 ± 10.7 | < 0.001 |
| HOMA-IR b | 2.9 (1.95, 4.2) | 4.3 (3.0, 5.8) | < 0.001 |
| TG (mg/dL) b | 105 (78,144) | 118 (86,160) | < 0.001 |
| TC (mg/dL) | 167.7 ± 32.4 | 167.5 ± 34.6 | NS |
| LDL- cholesterol (mg/dL) | 100.7 ± 27.5 | 100.2 ± 30.8 | NS |
| HDL- cholesterol (mg/dL) | 45.9 ± 12.5 | 42.7 ± 11.7 | < 0.001 |
| WHR | 0.96 ± 0.02 | 0.94 ± 0.03 | < 0.001 |
| IR (%) | 49.8 | 57.6 | 0.009 |
| Hypertension (%) | 14.2 | 21.4 | 0.002 |
| Dyslipidemia (%) | 49.4 | 62.3 | < 0.001 |
| Hypercholesterolemia | 16.7 | 15.5 | NS |
| Hypertriglyceridemia | 20.8 | 29.6 | < 0.001 |
| High LDL-C levels | 13.9 | 15.8 | NS |
| Low HDL-C levels | 28.4 | 43.3 | < 0.001 |
| Hepatosteatosis (%) | 37.3 | 49.1 | < 0.001 |
| Grade 1 | 34 | 43.7 | < 0.001 |
| Grade 2 - 3 | 3.5 | 7.1 | 0.007 |
Abbreviations: BMI SDS, mean body mass index standard deviation score; HOMA-IR, homeostasis model assessment of insulin resistance; HDL, high-density lipoprotein; LDL, low-density lipoprotein; TC, total cholesterol; TG, triglyceride; IR, insulin resistance; WHR, waist-to-hip ratio; NS, not significant.
a Data are shown as mean ± standard deviation unless indicated.
b Median (interquartile range: 25th and 75th percentiles).
From the participants, 644 (56.7%) cases met the study criteria for dyslipidemia, including 16% with high TC, 15% with high LDL-C, 36.8% with low HDL-C, and 25.9% with high TG. There was no difference in the frequency of dyslipidemia according to gender (P = 0.15). While dyslipidemia was seen in 62.3% of pubertal children, this was significantly less prevalent (49.4%) in prepubertal children (P < 0.001). Hypertriglyceridemia and low HDL-C were present at significantly higher rates in pubertal children (P < 0.001). In the pubertal group, waist-to-hip ratio, HOMA-IR, AST, ALT, and uric acid levels were significantly higher than in the prepubertal group, and were positively associated with the prevalence of dyslipidemia (P-values < 0.001, < 0.003, < 0.001, 0.048, 0.003, and < 0.001, respectively) (Table 3). HOMA IR showed a positive correlation with TG (r = 0.15, P < 0.001) and a negative correlation with HDL-C levels (r = -0.20, P < 0.001). No correlation was found between the HOMA IR and TC or LDL-C levels (Figure 1). BMI had a positive correlation with TG (r = 0.18, P < 0.001) and a negative correlation with HDL-C levels (r = -0.17, P < 0.001). No correlation was found between BMI and TC or LDL C (Figure 2).
Table 3.
Clinical and Laboratory Differences Between Dyslipidemia (+) and (-) Cases (+) and (-) C
| Dyslipidemia (+) | Dyslipidemia (-) | P | |
|---|---|---|---|
| No. (%) | 644 (56.7) | 492 (43.3) | |
| Age (y) | 11.9 ± 2.8 | 10.8 ± 3.0 | < 0.001 |
| Gender (female/male) | 287/357 | 240/252 | NS |
| Puberty (prepubertal/pubertal) (n) | 243/401 | 249/243 | < 0.001 |
| Birth weight (g) | 3373 ± 78 | 3363 ± 73 | NS |
| Breastfeeding ≥ 6 months (%) | 75 | 79 | NS |
| Acanthosis nigricans | 57.3 | 47.8 | 0.001 |
| Striae | 53.6 | 44.5 | 0.002 |
| BMI SDS | 2.2 ± 0.4 | 2.2 ± 0.4 | NS |
| BMI (kg/m2) | 28.5 ± 4.5 | 27.2 ± 4.3 | < 0.001 |
| WHR | 0.96 ± 0.3 | 0.95 ± 0.3 | 0.003 |
| HOMA-IR | 4.3 ± 2.4 | 3.5 ± 2.2 | < 0.001 |
| IR (%) | 59.3 | 47.6 | < 0.001 |
| ALT (U/L) | 25.9 ± 20.5 | 22.7 ± 13.3 | 0.003 |
| AST (U/L) | 24.2 ± 10.7 | 23.6 ± 7.4 | 0.048 |
| Uric acid (mg/dL) | 5.2 ± 1.3 | 4.7 ± 1.1 | < 0.001 |
| Hepatosteatosis (grade 1-3) (%) | 47 | 40.7 | 0.031 |
| Hypertension (%) | 18.2 | 18.5 | NS |
| TSH (mIU/L) | 3.2 ± 4.6 | 2.7 ± 1.5 | 0.023 |
| fT4 (ng/dL) | 1.01 ± 0.2 | 1.04 ± 0.1 | 0.014 |
| fT3 (pg/mL) | 5.08 ± 1.2 | 5.2 ± 1.2 | NS |
| SH (%) | 8.7 | 5.5 | 0.04 |
Abbreviations: BMI SDS, body mass index standard deviation score; WHR, waist-to-hip ratio; HOMA-IR, homeostasis model assessment of insulin resistance; ALT, alanine aminotransferase; AST, aspartate aminotransferase; TSH, thyroid-stimulating hormone; fT4, free thyroxine; fT3, free triiodothyronine; IR, insulin resistance; SH, Subclinical hypothyroidism; NS, not significant
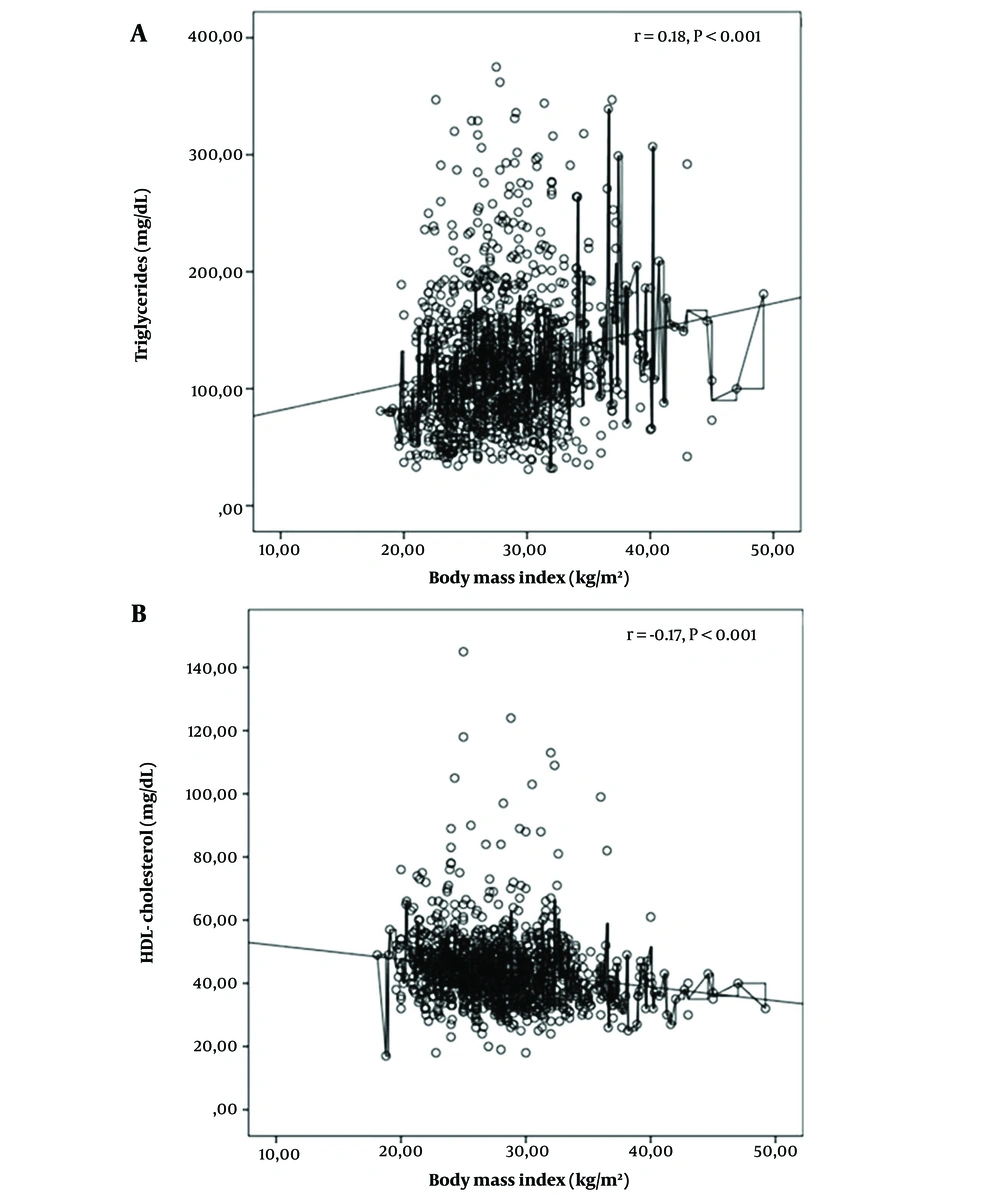
Figure 1.
Correlations between body mass index (BMI) and triglyceride and HDL-C levels in obese patients
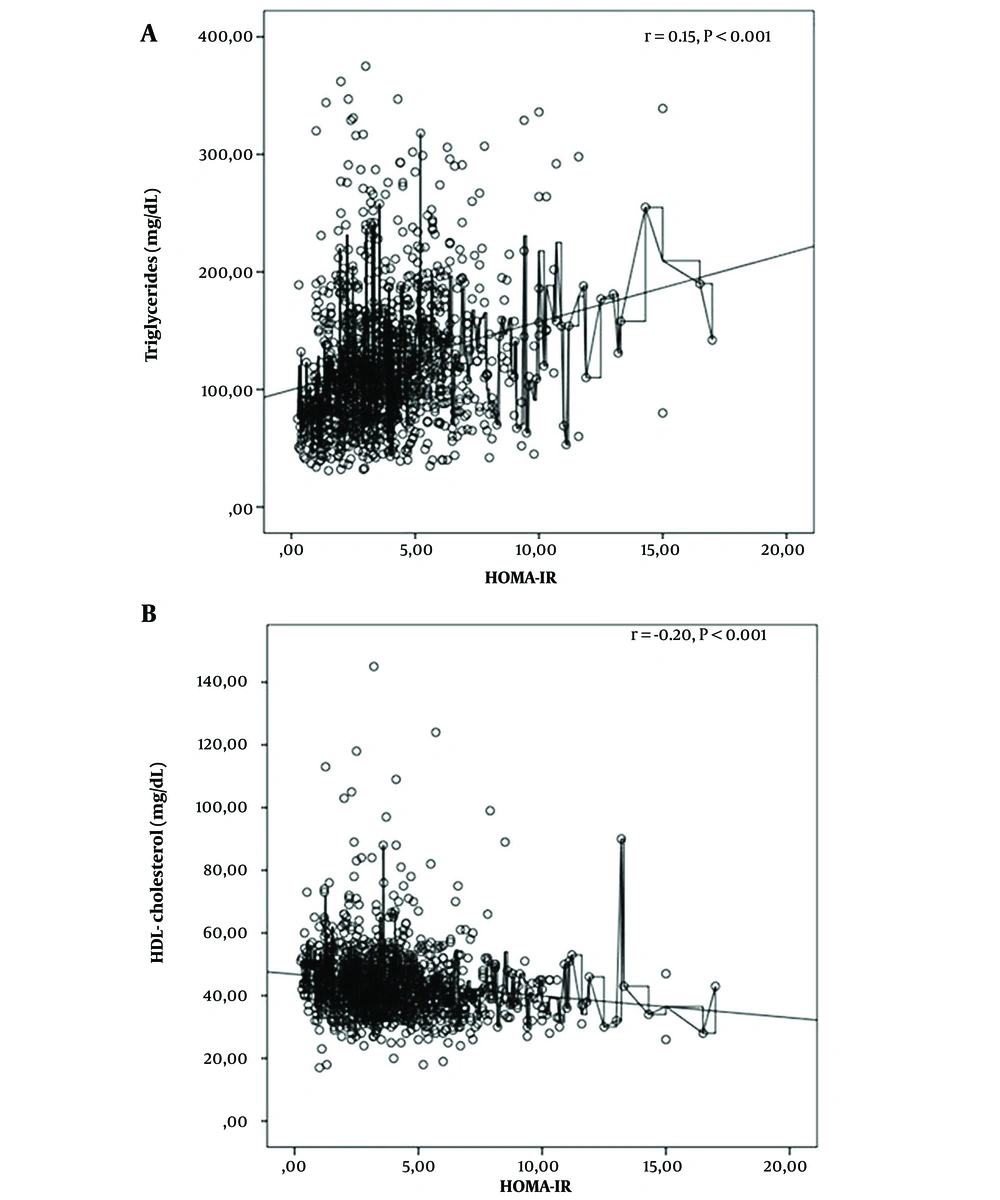
Figure 2.
Correlations between homeostasis model assessment for insulin resistance (HOMA-IR) and triglyceride and HDL-C levels in obese patients
Subclinical hypothyroidism was found in 5.2% of all cases. Dyslipidemia was found at a higher rate in patients with subclinical hypothyroidism compared to patients without subclinical hypothyroidism (P = 0.04). High hepatosteatosis (grade 1 - 3) was detected in dyslipidemic patients compared to non-dyslipidemic ones (P = 0.031). The demographic characteristics and laboratory values of the patients with and without dyslipidemia are given in Table 3. The risk factors for dyslipidemia were evaluated using multivariate logistic regression (MLR). Being in puberty, the presence of acanthosis nigricans, high BMI, increased waist-to-hip ratio, high HOMA-IR, and high uric acid levels were found to be the risk factors for dyslipidemia (Table 4).
Table 4.
Multivariate Logistic Regression Predictors of Obese Patients with Dyslipidemia
| Variables | Reference Category | Beta | Standard Error | P | OR | 95% CI |
|---|---|---|---|---|---|---|
| Age (y) | - | 0.071 | 0.065 | NS | 1.74 | 1.94 - 1.22 |
| Gender (female/male) | Male | -0.015 | 0.18 | NS | 0.985 | 0.70 - 1.40 |
| Pubertal status | Pre-pubertal | 0.625 | 0.277 | 0.024 | 1.867 | 1.08 - 3.21 |
| SGA | No | -0.217 | 0.288 | NS | 0.805 | 0.45 - 1.42 |
| GDM | No | 0.063 | 0.289 | NS | 1.065 | 0.61 - 1.87 |
| Acanthosis nigricans | No | 0.526 | 0.193 | 0.006 | 1.692 | 1.16 - 2.47 |
| Striae | No | -0.392 | 0.204 | NS | 0.67 | 0.45 - 1.01 |
| BMI | - | 0.103 | 0.043 | 0.018 | 1.10 | 1,02 - 1.21 |
| WHR | - | 7.152 | 3.32 | 0.031 | 1276.92 | 1.9 - 855652.9 |
| HOMA-IR | - | 0.551 | 0.079 | < 0.001 | 1.73 | 1.48 - 2.0 |
| AST (U/L) > 31 | No | -0.507 | 0.421 | NS | 0.602 | 0.26 - 1.37 |
| ALT (U/L) > 37 | No | 0.298 | 0.369 | NS | 1.347 | 0.65 - 1.78 |
| Uric acid (mg/dL) | - | 0.237 | 0.074 | 0.001 | 1.267 | 1.09 - 1.46 |
| Hypertension | No | -0.277 | 0.22 | NS | 0.758 | 0.49 - 1.16 |
| Hepatosteatosis | No | -0.349 | 0.188 | NS | 0.705 | 0.48 - 1.02 |
| SH | No | 0.011 | 3.70 | NS | 1.01 | 0.70 - 2.08 |
Abbreviations: HOMA-IR, homeostasis model assessment of insulin resistance; SGA, small for gestational age; ALT, alanine aminotransferase; AST, aspartate aminotransferase; GDM, gestational diabetes mellitus; WHR, waist-to-hip ratio; SH, subclinical hypothyroidism; BMI, body mass index; NS, not significant.
5. Discussion
In this observational, cross-sectional, retrospective study, we analyzed a large cohort of children with simple obesity in a wide age range. The incidence of obesity-related complications is directly proportional to the duration and degree of obesity. Obesity is a risk factor for CVD in children and adults. CVD risk is further increased when obesity is accompanied by hypertension, dyslipidemia, hyperuricemia, insulin resistance, atherosclerosis, and cardiomyopathy (1, 25, 26). The aim of our study was to determine the risk factors and prevalence of dyslipidemia in obese children and adolescents in our region.
In our cohort, the prevalence of dyslipidemia was 56.7%. A relatively low HDL-C together with a high TG was observed. The prevalence of dyslipidemia has been reported at different rates among obese children in different populations (9-12). Deeb et al. found 55.3% dyslipidemia in obese children, while Brzezinski et al. reported the incidence as approximately 69.9% (9, 10). Korsten-Reck et al. found a 45.8% incidence of dyslipidemia in obese children, together with lower HDL and higher LDL levels (11). In a previous report in Turkish children, the prevalence of dyslipidemia was 42.9%, with hypertriglyceridemia being the most common single lipid abnormality (12). In Turkey, Atabek et al. reported the frequency of dyslipidemia as 47.3%. In a second study performed by the same center in 2013, this rate increased to 51.9% in obese children (13, 14). This suggested a tendency for the prevalence of dyslipidemia due to obesity to increase in a Turkish pediatric population.
Lipids are of particular importance among CVD risk factors, and many studies have shown that childhood obesity is associated with increased TC, LDL-C, and TG levels, and low HDL-C levels (27, 28). In the presence of insulin resistance, lipidosis increases, and more fatty acids are released into the circulation. Free fatty acid entry into the liver increases, and there is more triglyceride synthesis and very low-density lipoprotein (VLDL) secretion. Then, hypertriglyceridemia develops. For the VLDL-triglyceride complex, VLDL is replaced by cholesteryl esters in both HDL and LDL. Triglyceride-rich LDL and HDL go into lipolysis and shrinkage occurs. HDL is rapidly cleared from the circulation. Then, atherogenic lipid profile (high LDL-C, high triglyceride, and low HDL) occurs (5, 29, 30). In our study, a positive correlation was found between HOMA IR and TG, while a negative correlation was found between HOMA IR and HDL-C levels. No correlation was found between HOMA IR levels and TC or LDL-C.
The Bogalusa Heart Study showed that high BMI at 5 - 17 years of age was associated with abnormal concentrations of TG, LDL, HDL, and insulin (31). A positive correlation was found between BMI and TG levels in our study, while a negative correlation was found between BMI and HDL-C. No correlation was found between BMI and TC or LDL-C levels. In a study on CVD risk factors, BMI-SDS was found to be an important indicator for hypertension, and waist circumference SDS was suggested as an effective indicator for dyslipidemia (32). Although different parameters are used in the definition of obesity, waist circumference, which reflects visceral fat, is a reliable determinant for insulin resistance, fatty liver, lipid levels, and hypertension (33, 34). In our study, a higher waist-to-hip ratio was found in patients with dyslipidemia compared to patients without dyslipidemia. In addition, in the MLR analysis, high uric acid level, high BMI, increased waist-to-hip ratio, presence of acanthosis nigricans, and onset of puberty were found to be risk factors for dyslipidemia.
Non-alcoholic fatty liver disease (NAFLD) is the most common cause of chronic liver disease in children. In the last two decades, the incidence of NAFLD has increased due to the increase in prevalence of obesity in children. As a result of dyslipidemia and insulin resistance, lipid uptake and production in the liver exceeds lipid clearance, leading to hepatic steatosis in obese individuals. The severity of hepatosteatosis can be assessed by ultrasound. According to various studies, the incidence of NAFLD in obese children has been reported between 45.2 - 67.2% (12, 35, 36). In our study, hepatosteatosis was detected in 46.7% of patients with dyslipidemia, while this rate was 40.4% in other studies. However, fatty liver was not found as a risk factor for dyslipidemia in the MLR analysis. Fatty liver is a controversial factor for dyslipidemia; however, monitoring obese children and adolescents in this regard is recommended.
Moderately increased TSH and normal or mildly increased T4 and/or T3 levels observed in some studies on hypothyroidism in obese children suggest an adaptation process to increase energy expenditure (37, 38). In studies conducted on overweight/obese children, the prevalence of SH ranged from 7% to 23% (37, 38). In our study, higher TSH and lower fT4 were found in patients with dyslipidemia, while fT3 levels were not different from those without dyslipidemia. Habib and Habib did not find a relationship between SH and dyslipidemia in obese children (37-39). In our study, this rate was 5.2%. Besides, while this rate was 6.3% in patients with dyslipidemia, it was 3.9% in patients without dyslipidemia. Subclinical hypothyroidism did not emerge as a risk factor for dyslipidemia in the MLR analysis. Subclinical hypothyroidism is a controversial factor for dyslipidemia; however, monitoring blood lipid levels and thyroid hormones is recommended in obese children and adolescents.
Our study had some limitations. Firstly, the main disadvantage of our study is its cross-sectional design. Secondly, lack of data on the age of onset, dietary habits, physical activities, and socioeconomic status of obesity was another limitation. Thirdly, as a tertiary center managing pediatric obesity, the data may have overestimated the prevalence of dyslipidemia. Further longitudinal studies are needed to evaluate obese children in terms of dyslipidemia.
5.1. Conclusions
Obesity and insulin resistance increase the risk of high TG and low HDL-C, a situation known as the atherogenic lipid profile, causing CVD. The foundations for obesity, insulin resistance, and metabolic syndrome, all of which are serious CVD risk factors in adults, are laid in childhood. Dyslipidemia has a high prevalence in obese children and increases at puberty. In our study, puberty, high BMI, increased waist-to-hip ratio, increased HOMA-IR, high uric acid level, and acanthosis nigricans were found to be the risk factors for dyslipidemia. Our results emphasize the need for close monitoring of dyslipidemia in obese children and adolescents.