1. Background
Overweight and obesity are defined as abnormal or excessive fat accumulation that may impair health. Body mass index (BMI) is commonly used to determine if adults are overweight or obese. It is defined as body weight in kilograms divided by the square of height in meters (kg/m2) (1). BMIs for children and teens can be calculated in the same way, but the results do not have the same meaning because the normal amount of body fat varies with age and gender. Therefore, normal and overweight BMIs are defined according to age and gender. Overweight is defined as being above the 85th percentile but below the 95th percentile, while obesity is defined as being above the 95th percentile for children of the same age and sex (2). Obesity rates have doubled worldwide since 1980. The world health organization (WHO) considers childhood obesity as the greatest public-health problem of the twenty-first century (1). Obesity in children and adolescents is a serious public-health problem, and obesity research has become an important field of study.
Childhood obesity is an increasing health problem in Turkey. Ten years ago, it was reported that the prevalence of obesity was 4.4% among children 6 - 12 years old and 5.4% among children 12 - 17 years old in central Ankara, Turkey (3). Turkkahraman et al. (4) found that the prevalence of obesity was 3.6% in Antalya, southern Turkey. Yuca et al. (5) found that the rate of overweight was 11.1% and obesity was 2.2% in children 6 - 18 years old in a rural area of eastern Turkey. Simsek et al. (2011) found that the prevalence of obesity in urban and rural areas was 7.7% and 3.9%, respectively, in children aged 6 - 17 years in northern Turkey (6). Yabanci and Simsek (7) found that prevalence of overweight and obesity was 5.5% and 2.2% for low SES (Socio Economic Status); 10.7% and 6.4% for high SES, respectively. Ozturk and Akturk (8) found the rates of 12.4% overweight and 6.5% obese among children 6 - 16 years old in central Kayseri. Akçam et al. (9) reported the prevalence of overweight and obesity as 11% and 12.5%, respectively, in children of mean age 11.1 ± years in Isparta, southwestern Turkey. It was reported in the Turkish nutrition and health research report 2010 that obesity prevalence in 6 - 18 year old children was 8.2% (9.1% of males, 7.3% of females) in Turkey (10).
Family and school are important factors in childhood obesity. Savashan et al. (11) found that the prevalence of obesity increased significantly in children of parents with high Body Mass Index (BMI). Ozturk and Akturk (8), also found that the BMI averages of parents of the obese students were higher. Other factors include watching too much television (7, 12), eating while watching television (13), watching television in the bedroom (12), engaging in less than 1 - 2 hours of physical activity per day, low consumption of vegetables and fruit, going to school by car or bus (14), excessive consumption of fried foods and mineral water (15), fast-food habit, gobbling and taking big bites (7), obesity in parents (13, 15), birth weight above 4,000 grams, and high monthly income (13). In studies conducted in Turkey, socioeconomic level was found to be the main determinant of obesity. Accordingly, at higher socioeconomic levels, a greater prevalence of obesity was found (4, 7, 11). Ozturk and Akturk (8) also found that obesity was considerably high in school students who were classified as having high socioeconomic status.
Nurses have an important role in preventing childhood obesity and being involved in the treatment of obesity. The first step in dealing with obesity is to determine the prevalence and dimensions of obesity. Nurses can also play an important role in defining obesity, nutrition education, strategies for lower calorie consumption, and weight management (16-18).
2. Objectives
The aim of this study was to determine the prevalence and risk factors of overweight and obesity in school-age children in the city of Adıyaman, southeastern Turkey.
3. Methods
3.1. Research Design and Setting
A cross-sectional school-based survey was administered for the study. There were 40 public and three private elementary schools in central Adıyaman in 2012.
3.2. Population and Sampling
The study population included 36,082 elementary-school children in the above-referenced schools. Stratified sampling procedure was used to select schools. First, schools were classified as “lower,” “moderate” and “higher” with regard to their SES. The SES of school was determined according to their location in the city. According to data from the Adıyaman directorate of national education, the public and private schools in the city of Adıyaman were classified as higher SES, the schools outside the city were classified as moderate SES, and the schools in rural areas were classified as lower SES. For each socioeconomic status, two public schools were chosen by simple random sampling. Additionally, one private school was chosen (for a total of seven schools). Adıyaman is a Turkish province in the countryside with a low income level. The authors included a private school with a higher SES to provide an accurate representation of this group. Quota sampling with the strata of class and gender was applied in the selection of samples from children in the seven schools. The sample size was calculated using the formula (n = Nt2pq/d2 (N-1) + t2pq) (19), where N = 36,082, the total population of elementary school-age children in Adıyaman, t = 1.96 for 95% of students, the confidence level, P < 0.05 (8.2%), the prevalence of obesity in elementary school-age children of a previous study [10], q = 1-p (0. 918), and d = 0.01 the ± deviation from previous frequency. Sample size was calculated to require at least 2,690 children. However, the authors tried to include higher number of participants than the calculated one in the sample to avoid missing data. Finally, 3,028 children were selected as research subjects. Thus, the study meets the criteria for gender-specific analysis. The study includes males and females and it is configured for valid subgroup analysis.
3.3. Data collection
Two forms were used to collect data. The first was the Anthropometric Measurement Form, which includes the child’s age, gender, measurement date, bodyweight, and height. Two digital bascules certified for European conformity (EC) were used to measure the weight and height of the children. The brand of the digital weight scales was NAN, and they were medical scales with stadiometers. Their calibration was checked. The first form was filled out by the data-collection team.
The second survey form contained 25 questions regarding the parents’ education level, job, weight and height, and the child’s name, school name, age, gender, birth weight, nutrition during infancy, means of travel to school, distance to school, having breakfast, computer usage, watching television, and regular physical activities. A list of the foods consumed by children was prepared to examine their eating habits, and parents were asked how many times a week the children consumed these foods. The food list included high-calorie foods and beverages such as honey, jam, chocolate, potato/corn chips, and coke; dried fruits such as hazelnuts and peanuts; fruits, meat, and dairy products. Consumption rates were classified and analyzed as three times or less a week and four times or more a week. The child would give the parents the form, and they would complete it. The child’s birth weight and parents’ weights and heights were self-reported. The parents’ BMIs were calculated by researchers according to their weight, height, and gender.
Data collection was conducted in schools between October 2012 and January 2013. The anthropometric measurements on the first form were filled out by the data-collection team in the schools’ classrooms. Two teams made the measurements. These were five-person teams, including two researchers and three pollsters. Before the measurements, the teams were taught how to take the measurements and fill out the forms. This training lasted 40 minutes long. For their measurements, the children wore t-shirts or shirts and pants or skirts. Bodyweight and height were measured without shoes. A screen was used to protect the children’s privacy.
When the child was measured, he/she was given an envelope and asked to give it to his/her parents. The envelope contained a note regarding the research, an informed consent, and a survey form. The families of the children who agreed to participate in the research were asked to fill out the informed consent and survey form, place them back in the envelope, and return it to us. The form was sent to 3,028 families, and 1,813 families returned them in completed form. The family response rate was 60%.
3.4. Data Analysis
Data were analyzed using the statistical package for the social sciences (SPSS) 21 program. Each child’s body index was calculated by instructions for excel body-mass index (BMI) Calculator, a program developed by the centers for disease control and prevention (20). First, the child’s gender, bodyweight, height, date of birth and date of measurement were entered into the program, and then the BMI was calculated. Overweight was accepted as a BMI at or above the 85th percentile and below the 95th percentile for children of the same age and sex. Obesity is accepted as a BMI at or above the 95th percentile for children of the same age and sex (2). The data were analyzed by frequency and logistic regression in SPSS and Excel. In this research, the child’s gender, age, socioeconomic status, student transport, distance to school, dietary habits (having breakfast, consuming milk puddings, eating nuts, and milk chocolate), birth weight, parents’ body-mass index, and parents’ education level, were included in the analysis for logistic regression. Significance according to the chi-square test was the criterion applied in choosing variables. Then, the data were considered as independent variables in the group comparisons of overweight and normal weight/underweight. Inverse logistic regression analysis was used to examine whether these variables were a risk factor, while the inclusion/exclusion criteria for the model were agreed to be 0.01 and 0.05, respectively. Reference data for logistic regression were constructed as follows.
For obesity:
Dependent variables were coded as obese (1), normal and underweight (0), and overweight were removed from the database.
Independent variables were coded as follows:
Gender: female (0), male (1)
Socio-economic status: lower SES (0), moderate SES (1), higher SES (2)
Traveling to school: on foot (0), by car or bus (1)
Birth weight: 2500 to 4000 grams (0,) < 2500 grams (1), > 4000 grams (2)
Mother’s and father’s education: elementary school (0), high school (1), university (2)
Mother’s and father’s BMIs: underweight (0), normal (0), overweight or obese (1)
Consumption of milk chocolate/ milk pudding/meat/nuts: less than 3 times per week (0), 4 or more times per week (1)
For being overweight:
Dependent variables were coded as overweight (1), normal and underweight (0), and obese were removed from the database.
Independent variables were coded as follows:
Age: under 10 years (0), 11 to 15 years (1)
Distance from home to school: less than 1 kilometer (0), between 1 and 2 kilometers (1), between 3 and 4 kilometers (3), between 5 and 6 kilometers (4), 6 kilometers or more (5)
Having breakfast: no (0), yes (1)
Gender: female (0), male (1)
Socio-economic status: lower SES (0), moderate SES (1), higher SES (2)
Traveling to school: on foot (0), by car or bus (1)
Mother’s and father’s education: elementary school (0), high school (1), university (2)
Mother’s and father’s BMI: underweight (0), normal (0), overweight or obese (1)
Consumption of nuts: less than 3 times per week (0), 4 or more times per week (1)
3.5. Ethics
This research was approved by the ethical review boards (IRBs) under the governorship of the authors’ institution. Measurements were done voluntarily. There were 18 children who were not willing to participate in the measurement procedure, so they were excluded from the research. Informed consent forms were sent to the families. The families who returned the surveys all agreed to participate in the research. To match the two forms, the children’s names and surnames, school and classroom information had to be written on both forms. The survey forms were only used for research purposes and were kept confidential.
4. Results
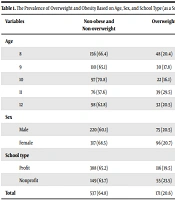
Table 1 shows the characteristics of the children who participated in this study.
Table 1.The Characteristics of Participants (N = 3028)
| Weight status and some variables | No. (%) |
|---|---|
| Weight Status Category according to Percentile Range | |
| Underweight | 207 (6.8) |
| Healthy weight | 2151 (71.1) |
| Overweight | 407 (13.4) |
| Obese | 263 (8.7) |
| Gender | |
| Male | 1549 (51.2) |
| Female | 1479 (48.8) |
| Age | |
| Under 10 years old | 1660 (54.8) |
| 11 to 15 years old | 1368 (45.2) |
| Birth weight | |
| < 2500 grams | 227 (7.5) |
| 2500 - 4000 grams | 1116 (36.9) |
| > 4000 grams | 126 (4.1) |
| Unknown | 1559 (51.5) |
| Children according SES of school | |
| Lower SES | 923 (30.5) |
| Moderate SES | 779 (25.7) |
| Higher SES | 1326 (43.8) |
| Travelling to school | |
| By walking | 1236 (40.8) |
| By car or bus | 577 (10.2) |
| Unknown | 1215 (40.1) |
| Distance from home to school | |
| Less than 1 kilometer | 969 (32.0) |
| Between 1 and 2 kilometers | 377 (12.5) |
| Between 3 and 4 kilometers | 173 (5.7) |
| Between 5 and 6 kilometers | 88 (2.9) |
| 6 kilometers or more | 55 (1.8) |
| Unknown | 1366 (45.1) |
| Having breakfast | |
| Yes | 1552 (51.3) |
| No | 259 (8.5) |
| Unknown | 1217 (40.2) |
| Total | 3028 (100.0) |
As Table 1 shows, 71.1% of children had BMI value above the 5th percentile but less than the 85th percentile. In other words, the majority of the participants were at “healthy weight”. Of the children, 6.8% had a BMI value less than the 5th percentile and were classified as “underweight” while 13.4% had BMI value of 85th to 95th percentile and were classified as “overweight”. Finally, 8.7% had BMI equal to or greater than 95th percentile and classified as “obese”.
According to Table 1, the children were between 5 and 15 years of age, 51.2% of them were male, and 54.8% were 10 years old or younger. Birth weight was unknown in 51.5% of children, while 36.9% had a birth weight between 2,500 and 4,000 grams. 43.8 % of children were attending an accepted high-SES school. Of the children, 40.8% walked to school, and a third of them lived within one kilometer of school.
Table 2 shows education level and body-mass index of the parents.
Table 2.Education Levels and Body Mass Index of Parentsa
| Characteristics of Mothers | N. (%) | Characteristics of Fathers | N. (%) |
|---|---|---|---|
| Education level | Education Levels | ||
| Elementary school | 1189 (67.0) | Elementary School | 770 (44.2) |
| High school | 363 (20.5) | High School | 487 (28.0) |
| University | 222 (12.5) | University | 485 (27.8) |
| Total | 1774 (100.0) | Total | 1742 (100.0) |
| Mothers’ BMIb | Fathers’ BMI | ||
| Underweight | 16 (0.9) | Underweight | 9 (0.5) |
| Normal | 627 (36.9) | Normal | 536 (31.9) |
| Overweight | 708 (41.6) | Overweight | 878 (52.3) |
| Obese | 350 (20.6) | Obese | 257 (15.3) |
| Total | 1701 (100.0) | Total | 1680 (100.0) |
aNumber of participants (n) differs because of missing data.
bUnderweight (BMI Below 18.5), Normal (BMI 18.5 to 24.99), Overweight (BMI 24.99 to 29.99), Obese (BMI 30.0 or higher).
Of the mothers, 67% were primary-school graduates, 20.5% were high-school graduates, and 12.5% were university graduates. Their BMIs were analyzed, and it was found that 36.9% had a normal weight, 41.6% were overweight, and 20.6% were obese.
According to Table 2, 44.2% of fathers were primary-school graduates, 28% were high-school graduates, and 27.8% were university graduates. The fathers’ BMI indicated that 31.9% had a normal weight, 52.3% were overweight, and 15.3% were obese.
Table 3 lists risk factors for obesity in children.
| Risk Factors | Obese Children | Underweight and Normal Children | OR (95% Cl) | P Value |
|---|---|---|---|---|
| SES of school | ||||
| Lower SES | 48 (18.3) | 788 (33.4) | ||
| Moderate SES | 140 (53.2) | 978 (41.5) | 2.57 (1.10 - 6.00) | 0.029 |
| Higher SES | 75 (28.5) | 592 (25.1) | 2.97 (1.26 - 6.98) | 0.013 |
| Mothers’ education | ||||
| Elementary school | 98 (58.0) | 951 (69.2) | ||
| High school | 41 (24.3) | 273 (19.9) | 1.11 (.56-2.22) | 0.755 |
| University | 30 (17.8) | 151 (11.0) | 2.347 (1.16 - 4.74) | 0.018 |
| Mothers’ BMI | ||||
| Underweight and normal | 36 (33.0) | 543 (50.3) | ||
| Overweight and obese | 73 (67.0) | 537 (49.7) | 2.00 (1.14 - 3.52) | 0.016 |
| Fathers’ BMI | ||||
| Underweight and normal | 29 (24.0) | 472 (41.7) | ||
| Overweight and obese | 92 (74.0) | 661 (76.0) | 1.96 (1.06 - 3.62) | 0.031 |
| Consumption of milk pudding | ||||
| Less than 3 times per week | 150 (87.7) | 1302 (92.9) | ||
| More than 4 times per week | 21 (12.3) | 100 (7.1) | 2.76 (1.21 - 6.26) | 0.015 |
| Consumption of nutsc | ||||
| Less than 3 times per week | 142 (83.0) | 1026 (73.4) | ||
| More than 4 times per week | 29 (17.0) | 371 (26.6) | 0.01 (0. 20 - 0.85) | 0.001 |
Abbreviations: CI, Confidence Intervals; OR, Odds Ratio.
aNumber of participants (n) differs because of missing data.
bValue are expressed as No. (%).
cNuts refer hazelnut, pistachio, peanut, sunflower seed, and pumpkin seed.
Schools with moderate SES have students with OR: 2.57 (CI: 1.10 - 6.00) times more obesity risk, and schools with high SES present 2.97 (1.26 - 6.98) times more obesity risk than the low SES schools. These increases are statistically significant (P < 0.05). Moderate and higher SES schools are found to be important risk factors for obesity.
Children with university-graduate mothers had a 2.34 (1.16 - 4.74) times higher risk of being obese than children with mothers who had only completed primary school. This increase is statistically significant (P < 0.05). Therefore, children with university-graduate mothers have a higher risk of being obese.
Children with overweight and obese mothers had a 2.00 (1.14 - 3.52) times higher risk of being obese. Children with overweight and obese fathers had a 1.96 (1.06 - 3.62) times higher risk of being obese. These increases were found to be statistically significant (P < 0.05). Thus, children with overweight or obese mothers and fathers have a higher risk of being obese.
The risk of obesity among children who eat milk puddings at least four times a week is 2.76 (1.21 - 6.26) times higher than those who do not. This increase was statistically significant (P < 0.05). On the contrary, the risk of obesity among children who eat nuts at least four times a week is 0.01 (0. 20 - 0.85) times less than who do not. This decrease was also highly significant (P < 0.05).
This research determined that eating milk puddings at least four times a week was a risk factor for obesity, while eating dried fruit was a protective factor.
According to the results of logistic regression, there was no significant correlation between obesity and children’s gender, being older or younger than 10 years old, birth weight, and having breakfast.
Table 4 depicts risk factors for being overweight in children.
| Risk Factors | Overweight Children | Underweight and Normal Children | OR (95% Cl) | P Value |
|---|---|---|---|---|
| Gender | ||||
| Female | 184 (45.2) | 1190 (50.5) | ||
| Male | 223 (54.8) | 1168 (49.5) | 1.68 (1.11 - 2.55) | 0.014 |
| Travelling to school | ||||
| By walking | 995 (70.7) | 134 (57.0) | ||
| By car or bus | 101 (43.0) | 412 (29.3) | 2.33 (1.48 - 3.66) | 0.001 |
| Mothers’ Education | ||||
| Elementary school | 140 (60.9) | 951 (69.2) | ||
| High school | 49 (21.3) | 273 (19.9) | 1.35 (0.81 - 2.27) | 0.245 |
| University | 41 (17.8) | 151 (11.0) | 2.06 (1.16 - 3.62) | 0.012 |
| Mothers’ BMIs | ||||
| Underweight and normal | 64 (39.5) | 543 (50.3) | ||
| Overweight and obese | 98 (60.5) | 537 (49.7) | 1.67 (1.09 - 2.56) | 0.017 |
| Fathers’ BMIs | ||||
| Underweight and normal | 44 (26.0) | 472 (41.7) | ||
| Overweight and obese | 125 (74.0) | 661 (58.3) | 1.80 (1.14 - 2.83) | 0.011 |
| Consumption of Nuts | ||||
| Less than 3 times per week | 186 (79.8) | 47 (20.2) | ||
| More than 4 times per week | 1026 (73.4) | 371 (26.6) | 0.36 (0.26-0.78) | .001 |
Abbreviations: CI, Confidence Intervals; OR, Odds Ratio.
aNumber of participants (n) differs because of missing data.
bValue are expressed as N. (%).
According to the logistic regression test, male students’ risk of being overweight was 1.68 (1.11 - 2.55) times greater than girls’ risk of being overweight. This increase was found to be statistically significant (P < 0.05). It reveals that being male is an important risk factor for being overweight.
The risk of being overweight for children who traveled to school by car or bus is 2.33 (1.48 - 3.66) times greater than the corresponded risk for children who walked to school. This rate of increase was statistically significant (P < 0.05). Traveling to school by car or bus is an important risk factor for overweight in children.
Children with university-graduate mothers had a 2.06 (1.16 - 3.62) times higher risk of being overweight than children with mothers who had only completed primary school. This increase was statistically significant (P < 0.05). Children with university-graduate mothers had a higher risk of being overweight.
Children with overweight and obese mothers had a 1.677 (1.09 - 2.56) times higher risk of being overweight. This increase is statistically significant (P < 0.05). Children with overweight and obese fathers had a 1.80 (1.14 - 2.83) times higher risk of being overweight. This increase was found to be statistically significant (P < 0.05). Children with overweight or obese mothers and fathers had a higher risk of being overweight.
The risk of being overweight in children who ate dried fruit at least four times a week was 0.36 (0.26 - 0.78) times less than those who did not. This reduction was highly significant (P < 0.05). Eating dried fruit at least four times a week is a protective factor against being overweight.
5. Discussion
This study determines the prevalence and risk factors of obesity in elementary-school children. The study was conducted on 3,028 children. In this study, children with body-mass index equal to or greater than the 95th percentile were considered “obese,” and the prevalence of obesity was found to be 8.7% (Table 1). Simsek et al. (3) found the prevalence of obesity in children 6 - 17 years of age to be 4.8%, while Turkkahraman et al. (4) found it to be 3.6%. These rates are below the rate found in our study. However, recent studies conducted in Turkey have reported a greater prevalence of obesity. For instance, Akcam et al. (9) reported the prevalence of obesity to be 12.5%, while Yuca et al. (5) reported it as 10.9%. The prevalence of obesity in Turkey varies according to the date of the research and the participants’ socioeconomic status.
Children with BMI between the 85th and 95th percentile are considered “overweight”. In this study, 13.4% of children were found to be overweight. The rate of children with BMI higher than the 85th percentile (overweight and obese) was 22.1%. Moreno et al. (21) indicated that the overweight and obesity rates were 30.9% for elementary-school children in USA. Candido et al. (22) found this rate to be 28.2% for children 6 - 15 years of age in Brazil. Vazquez et al. (23) found the rate of children 10 - 12 years of age with BMIs higher than the 85th percentile to be 41.5% in Galicia. The prevalence of overweight and obesity found in this study (22.1%) is below some of these studies from abroad. On the other hand, Lee and Ham (24) found overweight and obesity rates to be %12.5 in similar age group of children in Korea. Yuca et al. (5) found the rate of children with BMIs higher than 85th percentile to be 17.9%, and Ozturk and Akturk (8) found the rate to be 18.9%. The prevalence of overweight and obesity found in this study (22.1%) is higher compared to the result of another similar conducted study in Turkey (9). This study shows that nearly a quarter of the children in Adiyaman are overweight or obese. This result indicates a serious health problem because childhood obesity is likely to persist, and obese children may become obese adults.
Of the overweight children, 54.8% were male and 45.2% female. According to the logistic regression analysis, male students have OR: 1.68 (CI: 1.11 - 2.55, P < 0.05) times higher risk of being overweight than female students. This increased risk was statistically significant. This study determined that being overweight is more prevalent in males, and being male is an important risk factor. Similarly, other studies conducted in the same age group showed that males are more likely to be overweight than females (13, 14, 25, 26). However, there are also studies claiming that obesity risk is higher in girls than boys (25, 27, 28). This study found no significant relationship between gender and obesity. Similarly, some studies also found no significant relationship between gender, being overweight and obese (3, 9, 27, 29). The results of the studies regarding the relationship between childhood obesity and gender are not consistent with ours.
Age was not an important risk factor for being overweight or obese according to the logistic regression results. Tola et al. (29) also argued that age did not affect being overweight and obese. Similarly, Simsek et al. (3) indicated that there was no significant difference between children 6 - 11 years of age and children 12 - 17 years of age. Similarly, a study conducted in Portugal claimed that age is not a risk factor for obesity (30). Some studies indicate that being overweight is more prevalent among children 7 - 11 or 7 - 12 years of age (14, 25, 28). The results of the studies on the relationship between age group and being obese or overweight are not consistent with ours.
In this study, the schools were classified by socioeconomic status (SES). Schools with moderate and higher SES exhibited a significant increase in obesity risk. But, SES was not a risk factor for overweight. Many studies conducted in Turkey have emphasized that as SES rises, obesity risk also rises (8, 11, 31). Similarly, a study conducted in China in 2011 indicated that moderate and higher SES increased obesity risk (25). The rise in SES can lead to a home-centered lifestyle for children, spending too much time on the computer, no more playing outdoors, traveling to school by car or bus and eating excessively. Thus, higher SES can contribute to overweight and obesity.
Childhood overweight and obesity risk significantly increased if parents were university graduates. In other words, parents’ higher education level is an important risk factor for being overweight and obese (26, 29). The relevant literature supports this argument. This is may be due to that parents’ education level can affect their job and lifestyle.
Overweight and obese parents increased the obesity risk of their children. Parental obesity is one of the main risk factors for childhood obesity. Children with obese parents have an obesity risk 2.5 times higher than children with parents at normal weights. If the parents are at a normal weight, the obesity risk for their children is 10%. If one of the parents is overweight, the risk increases to 40%, and if both of the parents are overweight, it rises to 80%. Many studies have shown a relationship between parental obesity and childhood obesity (8, 13, 27). This relationship implies not only a genetic issue, but also poor eating habits and sedentary lifestyle.
This study found that consuming milk pudding more than 4 times per week was an important risk factor for obesity (OR: 2.76). This is similar to studies showing a relationship between obesity and high-carbohydrate consumption (26, 29).
Finally, this study found that consuming nuts more 4 times per week is a preventive factor against being overweight or obese. Similarly, it was found in a Mediterranean cohort study that participants who ate nuts two or more times per week had a significantly lower risk of weight gain (32). Moreover, nuts consumption is significantly associated with lower risk of developing metabolic syndrome (33). These results support the recommendation of nuts consumption without fear of weight gain.
This study determined that a birth weight above 4,000 grams was not a significant risk factor for being overweight and obesity, like another study conducted in China (34). However, certain studies conducted in Turkey have suggested that birth weight above 4,000 grams was a risk factor for obesity (4, 13). The results of logistic regression indicated that distance from home to school and having breakfast were unrelated to being overweight and obese.
5.1. Conclusions
The prevalence of obesity among elementary-school children 5 - 15 years of age was found to be 8.7% and the prevalence of being overweight was determined as 13.4%. Risk factors for overweight include being male, traveling to school by car or bus, mothers with higher education level, and overweight or obese parents. Moderate and higher SES, higher maternal education, overweight or obese parents, and consuming milk pudding more than four times per week are important risk factors for obesity. On the other hand, consuming nuts higher than four times per week was found as a preventive factor against being overweight and obese.
It is very important to detect overweight and obese children in school (35). Obesity-prevention programs must be organized for all children, and attempt to target, in particular, male children who consume milk pudding more than four times per week with overweight or obese parents, and those who have highly educated parents and moderate or higher SES. Social and school life can be managed with programs integrating teachers, students, and their families in order to raise awareness about obesity.