
1. Background
In recent years, despite advancements in the management of type 1 diabetes (T1D), the prevalence of overweight and obesity among young individuals with T1D has been on the rise. The prevalence of overweight and obesity, according to Body Mass Index (BMI), has been reported to be 31.8 - 39% in children and adolescents with T1D (1-3). While intensive insulin therapy has improved metabolic control and reduced vascular complications in T1D, exogenous insulin exposure contributes to a hyperinsulinemic environment, potentially promoting lipogenesis and increasing body fat percentage (PBF) (4, 5). The increased prevalence of obesity and central adiposity leads to associated cardiovascular comorbidities, including insulin resistance in the long term. Consequently, there has been a growing focus on body composition (BC) among young individuals with T1D over the past two decades (5-8). Analyzing BC may help identify increases in fat mass that contribute to diabetes-associated cardiometabolic risk (5).
Body composition can be measured directly by specifying the amount of tissue using cadaver analysis. All other reference methods are indirect methods. Since the tissue densities used in methods considered "reference" or "gold standard" are presumed to be the same as the tissue densities specified by cadaver analysis, these methods initially pose a potential problem. Hydrostatic weighing, bioelectrical impedance analysis (BIA), air displacement plethysmography, potassium 40 counting, neutron activation analysis, isotope dilution, dual-energy X-ray absorptiometry (DXA), magnetic resonance imaging, and anthropometric methods are frequently used to determine body density, lean body mass, and fat mass. In children, DXA and BIA methods are frequently used in clinical practices and scientific studies, with DXA considered the gold standard. Fat mass and lean mass estimated by BIA are almost perfectly correlated with reference methods. However, DXA is not appropriate for routine clinical use in terms of time, cost, and the necessity of technical skill. When compared with other methods, BIA, which provides reasonable cost and accuracy, is a rapid, safe, and non-invasive method. Additionally, fat mass and lean mass estimated by BIA are almost perfectly correlated with reference methods (9, 10).
Anthropometric Indices: In recent years, practical, accurate, and inexpensive methods have been investigated to evaluate adiposity in overweight/obese children and adolescents, focusing on specifying the best anthropometric index. Body Mass Index is the most common index used by clinicians (11). However, BMI, which evaluates BC, has some limitations, such as not displaying fat distribution well enough and dynamically changing with growth in childhood (5, 11). Waist circumference (WC), waist circumference to height ratio (WHtR), and neck circumference (NC) are practical and inexpensive parameters used for the assessment of fat distribution and central obesity in children in clinical practice and epidemiological studies (7, 12). In this respect, different anthropometric methods have been investigated to estimate BC more accurately. However, relatively new anthropometric indices in children and adolescents with T1D have been evaluated in a limited number of studies (6).
2. Objectives
Previous studies have predominantly utilized BMI to assess body composition and identify overweight and obesity in individuals with T1D (1-3, 13). The objective of this study was to determine the prevalence of overweight/obesity using BIA in our subjects with T1D and to compare the PBF of subjects with new anthropometric parameters used for the diagnosis of obesity. Additionally, we aimed to provide evidence related to the validity of various indices and estimation equations in the assessment of BC in children and adolescents with T1D.
3. Methods
3.1. Study Design and Population
A cross-sectional study was conducted, including children and adolescents aged between 5 and 21 years, who had been followed up with a diagnosis of T1D for at least 1 year and resided in the urban area, on a voluntary basis. After approval was obtained from the Istanbul University-Cerrahpasa, Cerrahpasa Medical Faculty Clinical Research Ethical Committee (project number: 4th April 2022; 352063), a cross-sectional study was conducted between October 2021 and April 2022 in the division of pediatric endocrinology. This study complied with the recommendations of the Declaration of Helsinki, and written informed consent for participation in the study was obtained from all participants’ parents or patients over 18 years of age. Patients who met the inclusion criteria during the study period were included using simple random sampling. Inclusion criteria were as follows: (1) ages 5 - 21 years, (2) diagnosis of T1D with at least 2 positive autoantibodies (IAA, ICA, and anti-GAD) positivity, (3) insulin treatment for at least 1 year.
Exclusion criteria were as follows: (1) being under 5 years and above 21 years, (2) diagnosis of Maturity Onset Diabetes of the Young (MODY), type 2 diabetes, or other forms of secondary diabetes, and (3) presence of any additional chronic disease, such as autoimmune diseases, or celiac disease, or chronic kidney disease.
3.2. Data Collection
Physical examination and pubertal staging were performed on all subjects. At the final follow-up visit, the participants’ weights, heights, and NC, WC, and hip circumference (HC) values were measured by the same healthcare provider. Insulin treatment methods and insulin doses were recorded. Mean HbA1c levels over the past year were calculated.
3.3. Anthropometric and Body Composition Measurements
The subjects’ heights were measured using a stadiometer (Holtain Ltd. Crosswell, Crymyh, Pembs U.K) with an accuracy of 0.1 cm. Body Mass Index was calculated by dividing weight by height squared (kg/m²). Tri-Ponderal Mass Index (TMI) was calculated by dividing weight by height cubed (kg/m³). Body Mass Index values by age and sex were defined as follows: BMI < 5th percentile: Underweight, BMI ≥ 5th-< 85th percentile: Normal weight, BMI ≥ 85-< 95th percentile: Overweight, and BMI ≥ 95th percentile: Obese (14). Neck circumference, WC, and HC were measured using a non-metal and non-stretchable tape with a sensitivity of 0.1 cm. NC was measured horizontally at the upper edge of the laryngeal protrusion. Waist circumference was measured at the middle axillary line between the lowest part of the arcus costa and the uppermost point of the iliac crest. Hip circumference was measured horizontally at the level of trochanter major. Body Adiposity Index (BAI), Body Shape Index (ABSI), Body Roundness Index (BRI), Abdominal Volume Index (AVI), and Conicity Index (CI) were calculated using the formulas given in Table 1 (6).
Table 1.
Anthropometric Measurements with Their Derived Equations
| Variables | Values |
|---|---|
| BAI | (HC (cm) / height (m)) - 18 |
| ABSI | WC (m) / (BMI (kg/m2)2/3 x height (m)1/2) |
| BRI | 364.2–365.5 x (1 − ((0.5 × WC (m) / π)2 / (0.5 × height (m))2))0.5 |
| AVI | [2 cm (WC (cm))2 + 0.7 cm (WC (cm) − HC (cm))2] / 1.000 |
| CI | 0.109–1 × WC (m) × (weight [kg] / height [m])–1/2 |
Abbreviations: BMI, Body Mass Index; WC, waist circumference; HC, hip circumference; BAI, Body Adiposity Index; ABSI, Body Shape Index; BRI, Body Roundness Index; AVI, Abdominal Volume Index; CI, Conicity Index.
Bioelectrical impedance analysis was employed as the criterion measure for assessing PBF. Body composition parameters, including weight (kg), PBF (%), and fat mass (kg), were measured using the Tanita MC-780 MA device (Tanita Corporation, Tokyo, Japan). This device is known for its high accuracy and reliability in estimating BC parameters (15). It has been validated against gold-standard methods such as DXA and hydrostatic weighing (10). The BIA results were interpreted using the manufacturer’s proprietary algorithms, which take into account variables such as age, sex, height, weight, and impedance to provide accurate estimates of PBF. Bioelectrical impedance analysis tests were conducted free of charge during routine clinical follow-ups, as the hospital owned the equipment and no external sponsorship or funding was required for these measurements. The PBF by age and sex was defined as follows: < 85th percentile: Normal, ≥ 85th-< 95th percentile: Overweight, and ≥ 95th percentile: Obesity. The percentile curves developed for Turkish children were used to evaluate PBF (16).
3.4. Statistical Analysis
The Statistical Package for the Social Sciences version 21.0 for Windows (IBM Inc., Chicago, Ill, USA) was used for data evaluation and analysis. Categorical variables are presented as frequencies (n) and percentages (%), and numeric variables are presented as median (25p - 75p) values. The Kolmogorov-Smirnov test was used to evaluate normality. The chi-square test was used to compare the categorical variables. The Mann-Whitney U test was used to compare continuous variables between two independent samples. The McNemar test was used to investigate differences in overweight/obese definitions according to BMI-SDS and BIA. A receiver operator characteristic (ROC) analysis was used to evaluate the area under the curve (AUC), cut-off value, sensitivity, and specificity of anthropometric indices on overweight/obesity. The DeLong test was used to compare the ROC curves of anthropometric indices with an AUC greater than 0.700. The significance level of statistical tests was set at P < 0.05.
4. Results
A total of 133 subjects (48.1% males, 77.4% pubertal) with T1D were included in the study. The participants had a median age of 14.0 (11.3 - 16.5) years, a median age at the time of diagnosis of 8.0 (5.8 - 11.3) years, and a median diabetes duration of 4.5 (1.5 - 7.3) years. According to BMI-SDS, 5.3% of the subjects (n = 7) were underweight, 72.9% (n = 97) were normal, 8.3% (n = 11) were overweight, and 13.5% (n = 18) were obese. According to BIA, 6% of the subjects (n = 8) were underweight, 63.9% (n = 85) were normal, 17.3% (n = 23) were overweight, and 12.8% (n = 17) were obese. The prevalence of overweight/obesity determined by BMI-SDS was 21.8%, while the prevalence of overweight/obesity determined by BIA was 30.1%, and the difference was statistically significant (P = 0.016). The median PBF of all subjects in BIA was 23.9% (18.7 - 29.2), and the subjects were divided into two groups: Underweight/normal [20.66% (16.42 - 25.0)] (group 1) and overweight/obese [30.83% (27.68 - 35.46)] according to PBF.
The comparison of demographic, laboratory, clinical characteristics, and anthropometric parameters between underweight/normal and overweight/obese subjects is summarized in Table 2.
Table 2.
Comparison of Demographic, Laboratory, Clinical Characteristics, and Anthropometric Parameters of the Study Groups
| Variables | Underweight/Normal (Group 1) (n = 90) | Overweight/Obese (Group 2) (n = 43) | P-Value |
|---|---|---|---|
| Age (y) a | 14 (11.82 - 16.8) | 13.41 (10.45 - 16.08) | 0.466 b |
| Female/male | 48 (51.6)/45 (48.4) | 21 (52.5)/19 (47.5) | 0.925 c |
| Prepuberty/puberty | 18 (19.4)/75 (80.6) | 12 (30.0)/28 (70.0) | 0.178 c |
| Weight SDS a | - 0.21 (- 0.95 - 0.65) | 1.27 (0.59 - 2.06) | < 0.001 b |
| Heigt SDS a | 0.06 (- 0.66 - 0.66) | 0.68 (- 0.03 - 1.17) | 0.003 b |
| Age at the time of diagnosis (y) a | 9 (6 - 12) | 7.42 (5.07 - 9.81) | 0.129 b |
| Duration of diabetes (y) a | 4.15 (1.5 - 7.3) | 5 (1.71 - 6.64) | 0.737 b |
| MDI/CSII | 75 (80.6)/18 (19.4) | 32 (80.0)/8 (20.0) | 0.931 c |
| Carbohydrate count | 90 (96.8) | 40 (100.0) | 0.251 c |
| Insulin dose per kg (units/kg/day) a | 0.88 (0.7 - 1.1) | 0.88 (0.69 - 1.03) | 0.752 b |
| HbA1c a | 7.7 (6.9 - 8.9) | 8.1 (7.5 - 9.3) | 0.113 b |
| BMI-SDS a | - 0.37 (- 0.90 - 0.46) | 1.33 (0.85 - 1.82) | < 0.001 b |
| Neck circumference a | 30.5 (29 - 33) | 32 (30 - 34) | 0.175 b |
| Waist circumference a | 70 (65.5 - 75) | 76.5 (72 - 86) | 0.001 b |
| Hip circumference a | 89 (78 - 96) | 98 (92.5 - 106) | 0.001 b |
| WHtR a | 0.45 (0.42 - 0.48) | 0.5 (0.46 - 0.54) | < 0.001 b |
| BAI a | 37.04 (35.08 - 39.39) | 42.66 (40.99 - 46.19) | < 0.001 b |
| ABSI a | 0.08 (0.07 - 0.08) | 0.08 (0.07 - 0.08) | 0.527 b |
| BRI a | 2.42 (1.93 - 2.93) | 3.33 (2.7 - 4.05) | < 0.001 b |
| AVI a | 9.96 (8.24 - 11.46) | 13.22 (10.9 - 16.59) | < 0.001 b |
| CI a | 1.13 (1.1 - 1.21) | 1.15 (1.09 - 1.27) | 0.362 b |
| TMI a | 12.88 (11.47 - 13.83) | 15.38 (13.96 - 16.62) | < 0.001 b |
Abbreviations: SDS, standard deviation score; MDI, multiple daily injections; CSII, continuous subcutaneous insulin infusion; BMI-SDS, Body Mass Index-standard deviation score; WHtR, waist-to-height ratio; BAI, Body Adiposity Index; ABSI, a Body Shape Index; BRI, Body Roundness Index; AVI, Abdominal Volume Index; CI, Conicity Index; TMI, Tri-Ponderal Mass Index.
a Values represent median (25th-75th percentile).
b Mann-Whitney U test.
c Chi-square test.
According to BIA, the prevalence of overweight/obesity was 40% in prepubertal subjects, 27.1% in pubertal subjects, 30.4% in female subjects, and 29.6% in male subjects (P > 0.05 for all comparisons). Although the prevalence of overweight/obesity was higher in pubertal girls compared to prepubertal girls, the difference was not statistically significant (30.1% vs. 28.6%, P > 0.05). However, the prevalence of overweight/obesity was higher in prepubertal boys compared to pubertal boys (50% vs. 22%, P = 0.04).
According to ROC analysis, BMI-SDS was the most effective anthropometric measurement for differentiating overweight/obesity. At a cut point of 0.63, BMI-SDS demonstrated a sensitivity of 78.79%, a positive predictive value (PPV) of 72.22%, a negative predictive value (NPV) of 89.71%, and an AUC of 0.895, highlighting its effectiveness in distinguishing overweight/obesity. The efficiency of various anthropometric indices in differentiating overweight and obesity, as determined by BIA, is summarized in Table 3 and Figure 1.
Table 3.
Comparison of Area Under the Curve for BMI-SDS, WC, WHtR, TMI, AVI, BRI, and BAI according to the ROC Curve a
| Variables | Cut Point | Sensitivity | Specificity | PPV | NPV | Youden’s Index | AUC | Compare | P-Value b |
|---|---|---|---|---|---|---|---|---|---|
| BMI-SDS | 0.63 | 78.79 | 85.92 | 72.22 | 89.71 | 0.647 | 0.895 | BMI-SDS vs. WC | 0.004 |
| BMI-SDS vs. WHtR | 0.026 | ||||||||
| BMI-SDS vs. TMI | 0.018 | ||||||||
| BMI-SDS vs AVI | 0.003 | ||||||||
| BMI-SDS vs. BRI | 0.026 | ||||||||
| BMI-SDS vs. BAI | > 0.05 | ||||||||
| WC | 72 | 78.79 | 60.56 | 48.15 | 86 | 0.394 | 0.720 | WC vs. WHtR | > 0.05 |
| WC vs. TMI | |||||||||
| WC vs. AVI | |||||||||
| WC vs. BRI | |||||||||
| WC vs. BAI | |||||||||
| WHtR | 0.49 | 60.61 | 92.96 | 80 | 83.54 | 0.536 | 0.805 | WHtR vs. TMI | > 0.05 |
| WHtR vs. AVI | |||||||||
| WHtR vs. BRI | |||||||||
| WHtR vs. BAI | |||||||||
| TMI | 14.24 | 69.7 | 85.92 | 69.7 | 85.92 | 0.556 | 0.834 | TMI vs. AVI | > 0.05 |
| TMI vs. BRI | |||||||||
| TMI vs. BAI | |||||||||
| AVI | 13.99 | 54.55 | 81.69 | 56.67 | 78.38 | 0.362 | 0.712 | AVI vs. BRI | > 0.05 |
| AVI vs. BAI | |||||||||
| BRI | 3.26 | 60.61 | 92.96 | 80 | 83.5 | 0.522 | 0.805 | TMI vs. BAI | > 0.05 |
| BAI | 39.52 | 85 | 76.6 | 60.71 | 92.31 | 0.616 | 0.860 | - | - |
Abbreviations: PPV, positive predictive value; NPV, negative predictive value; AUC, area under the curve; BMI-SDS, Body Mass Index- standard deviation score; WC, waist circumference; WHtR, waist-to-height ratio; TMI, Tri-Ponderal Mass Index; AVI, abdominal volume index; BRI, Body Roundness Index; BAI, Body Adiposity Index.
a Values are presented as No. (%).
b Difference between the AUCs, using the DeLong test.
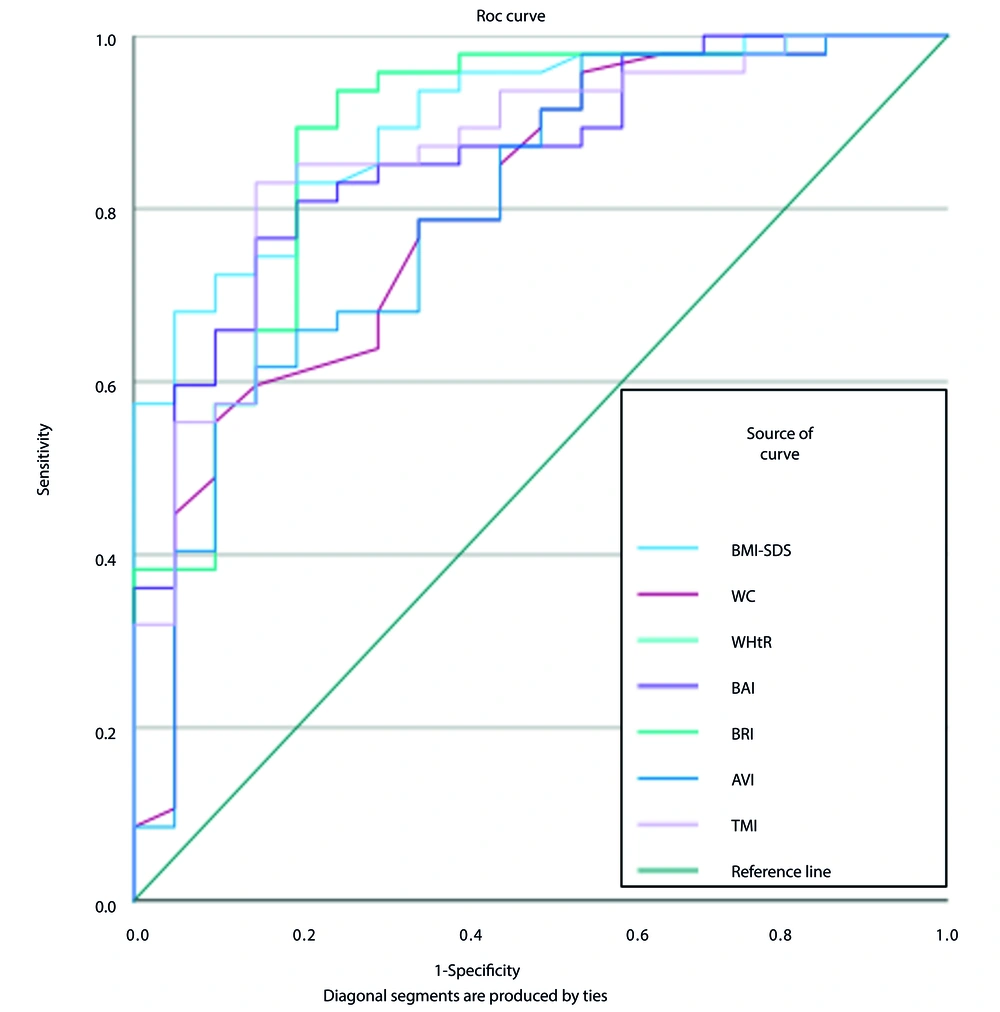
Figure 1.
ROC curve showing performance of BMI-SDS, WC, WHtR, TMI, AVI, BAI, and BRI to identify overweight/obesity in children and adolescents with T1D. Abbreviations: ROC, receiver operating characteristic; BMI-SDS, Body Mass Index-standard deviation score; WC, waist circumference; WHtR, waist-to-height ratio; TMI, Tri-Ponderal Mass Index; AVI, Abdominal Volume Index; BRI, Body Roundness Index; BAI, Body Adiposity Index.
When stratified by sex, BMI-SDS demonstrated a PPV of 69.6%, an NPV of 91.9%, and an AUC of 0.890 in girls. In boys, the BRI exhibited a PPV of 92.3%, an NPV of 93.6%, and an AUC of 0.929, while the BAI showed a PPV of 83.3%, an NPV of 94.1%, and an AUC of 0.929. When evaluated by pubertal status, BAI had a PPV of 80%, an NPV of 100%, and an AUC of 0.969 in the prepubertal period. In the pubertal period, BMI-SDS demonstrated a PPV of 74.1%, an NPV of 91.2%, and an AUC of 0.890.
5. Discussion
We found that the prevalence of overweight and obesity in children and adolescents with T1D is significantly high, with BMI-SDS being the most effective anthropometric measure for identifying overweight/obesity. This study is the first to investigate the potential relationship between BIA and novel anthropometric indices in this population. Our findings reveal that the prevalence of overweight/obesity was higher when assessed using BIA compared to BMI-SDS, with rates of 30.1% and 21.8%, respectively. This highlights the potential underestimation of obesity when relying solely on BMI.
Consistent with the literature, our study showed a higher prevalence of overweight/obesity in pubertal girls, although the difference was not statistically significant. This finding aligns with previous studies indicating that puberty and female sex are associated with increased BMI in individuals with T1D (1, 3, 4, 8, 13). Notably, we found a significantly higher prevalence of overweight/obesity in prepubertal boys compared to pubertal boys, corroborating other studies (13, 17). Furthermore, studies in adults with T1D have shown no significant difference in weight gain between women and men (18, 19). Regardless of sex, weight gain in T1D is commonly attributed to factors such as intake of excess calories to manage hypoglycemia, consumption of low-carbohydrate, high-protein, and high-fat foods to control glucose levels, and increased fat accumulation due to exogenous insulin-induced hyperinsulinemia (3).
A recent meta-analysis reported that body fat was 9% higher in children with T1D (20). Additionally, it has been demonstrated that BC measurement has predictive value in cardiovascular risk assessment in youth with T1D (21). Accurate assessment of overweight and obesity is essential for early intervention and prevention of cardiovascular comorbidities associated with T1D. Therefore, in managing body composition in T1D, measurements of fat mass and fat-free mass play a crucial role (5). Although advanced measurement methods are preferable, anthropometric measurements like BMI-SDS provide useful estimates of body fat when these methods are unavailable. However, there is no consensus on superior anthropometric measurements that could accurately determine adiposity and the type of adiposity (6). In studies where BC was compared with reference methods such as DXA, BMI, WC, and WHtR were recommended in children and adolescents to assess body fat (22). Our study demonstrated that BMI-SDS outperformed other indices such as WC, WHtR, TMI, AVI, BRI, and BAI in estimating overweight and obesity detected by BIA. Previous studies also support the use of BMI in pediatric populations due to its high specificity despite lower sensitivity compared to reference methods (23).
New anthropometric indices have shown varying results in evaluating body adiposity. Tri-ponderal mass index, in particular, has been noted as a better index for estimating PBF in children and adolescents (24-26). However, our findings indicate that BMI-SDS is superior to TMI and other indices in estimating PBF determined by BIA. A study involving 14,042 children aged 6 to 17 years found strong correlations between PBF assessed via BIA and BMI, TMI, WC, and WHtR. Moreover, this study identified BMI as the optimal index for detecting obesity in children aged 6 to 11 years and TMI in adolescents aged 12 to 17 years (27). This discrepancy may be due to differences in study populations and methodologies. Additionally, BAI showed excellent performance in prepubertal subjects, whereas BMI-SDS was more effective during puberty, suggesting that pubertal status significantly influences the accuracy of these indices.
We considered the low number of subjects included in our study a limitation. Additionally, the cross-sectional nature of our study did not allow the assessment of a cause-and-effect relationship. The strength of our study was that BIA was used as a reference in the assessment of BC to determine overweight/obesity, and the subjects were classified by pubertal status to eliminate the misleading effect of BC changes during puberty due to sex hormones. Further prospective studies including larger numbers of subjects are needed to investigate alternative methods and specify cause-and-effect relationships.
5.1. Conclusions
In conclusion, our study reveals a notable prevalence of overweight and obesity, affecting approximately one-third of children and adolescents with T1D. BMI-SDS emerges as the most effective anthropometric index for differentiating overweight and obesity in this population. Moreover, our findings provide valuable insights into the relationship between BIA and new anthropometric indices, highlighting the potential underestimation of overweight/obesity when BMI-SDS alone is used as a measure.