
1. Background
After the emergence of the COVID-19 pandemic, respiratory syncytial virus (RSV) changed its seasonality across the world (1-3). However, it is unknown if RSV severity changed during the COVID-19 pandemic, as the few studies conducted previously presented conflicting results (4-9). It is important to understand if RSV severity is affected by viral pandemics to determine the choice of the most suitable RSV prophylactic measures, such as palivizumab or nirsevimab for infants and the RSV vaccine for pregnant women.
2. Objectives
The present study primarily aimed to provide a full characterization of the pediatric RSV population admitted to a tertiary hospital before and during the COVID-19 pandemic, searching for changes in RSV severity. Secondarily, risk factors for severe RSV disease were analyzed.
3. Methods
We performed a retrospective study of the patients admitted to the General Pediatrics Unit's ward of a tertiary hospital in Lisbon, Portugal (Figure 1).
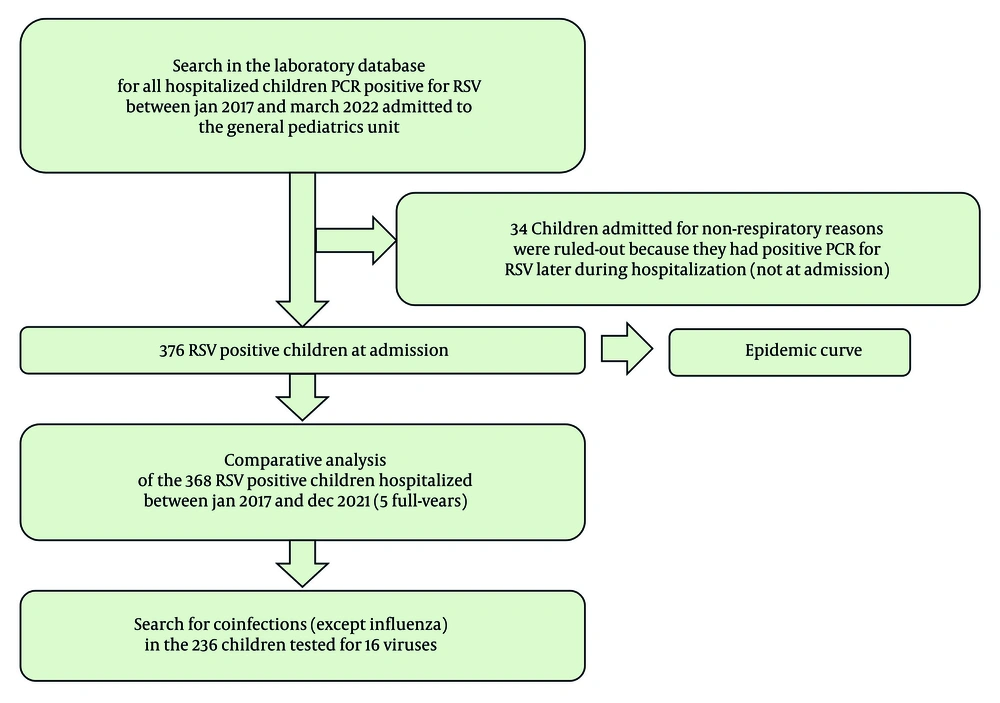
Figure 1.
Design of the study
We collected data on all RSV-infected pediatric patients admitted to our unit between January 1, 2017, and March 31, 2022. Collected data included age, gender, prematurity, chronic disease, reason for admission, bacterial superinfection (pneumonia), low-flow oxygen therapy, high-flow (HF) oxygen therapy, admission to the pediatric intensive care unit (PICU), non-invasive ventilation (NIV), mechanical ventilation (MV), and the length of hospital stay.
Data from RSV patients admitted from January 1, 2017, to December 31, 2021 (5 full years) were compared between the years, searching for differences.
Respiratory syncytial virus detection was performed through polymerase chain reaction (PCR) of nasal secretions using the Xpert Xpress Flu/RSV assay (GeneXpert system) or the Allplex Respiratory Panel 1/2/3 assay (CFX96 real-time PCR system). The Xpert Xpress Flu/RSV assay (GeneXpert system) detects RSV and Influenza A and B viruses. The Allplex Respiratory Panel 1/2/3 assay (CFX96 real-time PCR system) detects 16 viruses (Adenovirus, Bocavirus, Coronavirus OC43, Coronavirus NL63, Coronavirus 229E, Enterovirus, Influenza A, Influenza B, Metapneumovirus A/B, Parainfluenza 1, Parainfluenza 2, Parainfluenza 3, Parainfluenza 4, Rhinovirus, RSV-A, and RSV-B).
Viral coinfections were tested using the extended Allplex Respiratory Panel 1/2/3 assay. Bacterial superinfection (pneumonia) was diagnosed using a chest radiograph. Hypoxemia was defined by a peripheral oxygen saturation below 92%. Respiratory syncytial virus patients coinfected with Influenza or SARS-CoV-2 viruses did not enter the General Pediatrics Unit, so they were not addressed in this study.
Associations between categorical variables were explored using chi-squared tests. Continuous variables were subjected to Kruskal-Wallis tests. Statistical analysis was performed with IBM SPSS Statistics 25.0. Significant results were considered for values of P < 0.05 that retained significance even after applying the Benjamini-Hochberg correction for multiple comparisons, considering a critical value of a false discovery rate of 10%.
4. Results
A total of 376 patients admitted to our unit during the study period were diagnosed with RSV infection, with 368 of them between January 1, 2017, and December 31, 2021 (Figure 1). Only four patients had received palivizumab in the season of hospitalization. In 2020, the first year of the COVID-19 pandemic, there were only 33 RSV patients hospitalized in our unit, compared to a mean of 90 patients per year observed in the three previous years (Table 1).
Table 1.
Comparison of Respiratory Syncytial Virus Hospitalized Patients by Year a
| Variables | 2017 | 2018 | 2019 | 2020 | 2021 | Total | P-Value |
|---|---|---|---|---|---|---|---|
| Hospitalized patients | 107 | 85 | 78 | 33 | 65 | 368 | - |
| Median age (mo) b | 3.2 (1.5 - 7.0) | 3.1 (1.3 - 8.6) | 3.6 (1.5 - 10.6) | 3.2 (1.3 - 13.4) | 2.8 (1.3 - 13.2) | 3.2 (1.4 - 8.4) | 0.869 |
| Age (mo) | 0.002 c | ||||||
| (0 - 24) | 105 (98.1) | 84 (98.8) | 78 (100.0) | 32 (97.0) | 58 (89.2) | 357 (97.0) | |
| (24 - 216) | 2 (1.9) | 1 (1.2) | 0 (0.0) | 1 (3.0) | 7 (10.8) | 11 (3.0) | |
| Gender | 0.659 | ||||||
| Male | 56 (52.3) | 45 (52.9) | 34 (43.6) | 17 (51.5) | 36 (55.4) | 188 (51.1) | |
| Female | 51 (47.7) | 40 (47.1) | 44 (56.4) | 16 (48.5) | 29 (44.6) | 180 (48.9) | |
| Reasons for admission | 0.294 | ||||||
| Hypoxemia | 69 (64.5) | 58 (68.2) | 53 (67.9) | 29 (87.9) | 51 (78.5) | 260 (70.7) | 0.058 |
| Eating difficulties | 40 (37.4) | 26 (30.6) | 28 (35.9) | 10 (30.3) | 24 (36.9) | 128 (34.8) | 0.836 |
| Age < 6 (wk) | 27 (25.2) | 25 (29.4) | 19 (24.4) | 10 (30.3) | 22 (33.8) | 103 (28.0) | 0.700 |
| Prematurity | 25 (23.4) | 9 (10.6) | 21 (26.9) | 6 (18.2) | 10 (15.4) | 71 (19.3) | 0.065 |
| Chronic disease | 18 (16.8) | 8 (9.4) | 10 (12.8) | 5 (15.2) | 5 (7.7) | 46 (12.5) | 0.385 |
| Social reason | 0 (0.0) | 0 (0.0) | 2 (2.6) | 0 (0.0) | 0 (0.0) | 2 (0.5) | 0.113 |
| Prematurity | 24 (22.4) | 9 (10.6) | 21 (26.9) | 6 (18.2) | 11 (16.9) | 71 (19.3) | 0.092 |
| Chronic disease | 21 (19.6) | 13 (15.3) | 12 (15.4) | 6 (18.2) | 16 (24.6) | 68 (18.5) | 0.663 |
| Respiratory | 10 (9.3) | 2 (2.4) | 6 (7.7) | 3 (9.1) | 6 (9.2) | 27 (7.3) | 0.374 |
| Neurologic | 11 (10.3) | 4 (4.7) | 6 (7.7) | 2 (6.1) | 1 (1.5) | 24 (6.5) | 0.217 |
| Polymalformative | 4 (3.7) | 6 (7.1) | 6 (7.7) | 3 (9.1) | 3 (4.6) | 22 (6.0) | 0.677 |
| Cardiac | 5 (4.7) | 4 (4.7) | 5 (6.4) | 0 (0.0) | 5 (7.7) | 19 (5.2) | 0.561 |
| Gastric | 0 (0.0) | 1 (1.2) | 3 (3.8) | 0 (0.0) | 3 (4.6) | 7 (1.9) | 0.131 |
| Nephro-urologic | 3 (2.8) | 1 (1.2) | 0 (0.0) | 0 (0.0) | 1 (1.5) | 5 (1.4) | 0.520 |
| Hematologic | 1 (0.9) | 1 (1.2) | 0 (0.0) | 1 (3.0) | 2 (3.1) | 5 (1.4) | 0.500 |
| Thyroid | 1 (0.9) | 0 (0.0) | 1 (1.3) | 0 (0.0) | 0 (0.0) | 2 (0.5) | 0.719 |
| Metabolic | 0 (0.0) | 0 (0.0) | 0 (0.0) | 0 (0.0) | 1 (1.5) | 1 (0.3) | 0.322 |
| Immunodeficiency | 0 (0.0) | 0 (0.0) | 0 (0.0) | 0 (0.0) | 1 (1.5) | 1 (0.3) | 0.322 |
| PICU admission | 17 (15.9) | 12 (14.1) | 13 (16.7) | 4 (12.1) | 17 (26.2) | 63 (17.1) | 0.289 |
| Support therapy | |||||||
| Low-flow oxygen | 89 (83.2) | 78 (91.8) | 70 (89.7) | 33 (100) | 59 (90.8) | 329 (89.4) | 0.063 |
| HF | 8 (7.5) | 3 (3.5) | 9 (11.5) | 5 (15.2) | 16 (24.6) | 41 (11.1) | 0.001 c |
| NIV | 10 (9.3) | 12 (14.1) | 9 (11.5) | 6 (18.2) | 7 (10.8) | 44 (12.0) | 0.665 |
| MV | 3 (2.8) | 3 (3.5) | 4 (5.1) | 1 (3.0) | 0 (0.0) | 11 (3.0) | 0.504 |
| Length of stay (d) b | 6.0 (5.0 - 7.0) | 6.0 (4.0 - 8.0) | 6.0 (4.0 - 8.0) | 5.0 (4.0 - 7.5) | 5.0 (4.0 - 7.0) | 6.0 (4.0 - 8.0) | 0.759 |
| Bacterial coinfection | 38 (35.5) | 31 (36.5) | 27 (34.6) | 9 (27.3) | 26 (40.0) | 131 (35.6) | 0.807 |
| Viral coinfection | 36.71 (50.7) | 30.67 (44.8) | 19.41 (46.3) | 5.8 (62.5) | 27.49 (55.1) | 117.236 (49.6) | 0.743 |
| Rhinovirus | 18.71 (25.4) | 21.67 (31.3) | 12.41 (29.3) | 5.8 (62.5) | 15.49 (30.6) | 71.236 (30.1) | 0.306 |
| Bocavirus | 10.71 (14.1) | 7.67 (10.4) | 1.41 (2.4) | 2.8 (25.0) | 10.49 (20.4) | 30.236 (12.7) | 0.090 |
| Adenovirus | 7.71 (9.9) | 5.67 (7.5) | 2.41 (4.9) | 1.8 (12.5) | 4.49 (8.2) | 19.236 (8.1) | 0.892 |
| Coronavirus (old) | 8.71 (11.3) | 5.67 (7.5) | 3.41 (7.3) | 0.8 (0.0) | 2.49 (4.1) | 18.236 (7.6) | 0.578 |
| Enterovirus | 1.71 (1.4) | 4.67 (6.0) | 3.41 (7.3) | 1.8 (12.5) | 2.49 (4.1) | 11.236 (4.7) | 0.442 |
| Parainfluenza | 2.71 (2.8) | 3.67 (4.5) | 4.41 (9.8) | 0.8 (0.0) | 0.49 (0.0) | 9.236 (3.8) | 0.166 |
| Parechovirus | 1.71 (1.4) | 2.67 (3.0) | 1.41 (2.4) | 0.8 (0.0) | 0.49 (0.0) | 4.236 (1.7) | 0.768 |
| Metapneumovirus | 1.71 (1.4) | 0.67 (0.0) | 0.41 (0.0) | 0.8 (0.0) | 1.49 (2.0) | 2.236 (0.8) | 0.720 |
Abbreviations: PICU, pediatric intensive care unit; HF, high-flow oxygen; NIV, non-invasive ventilation; MV, mechanical ventilation.
a Values are expressed as No. (%).
b The median age and length of stay are described as median (interquartile range).
c Significant results considering a critical false-discovery rate of 10%.
Between 2017 and 2019, the peak of RSV infections was in December and January (averaging 24 and 27 cases per month, respectively), with an average of one RSV admission in July and no RSV admissions in August. Nonetheless, there was no detection of RSV in December 2020 and January 2021, and two small peaks of RSV infection were verified in July and August 2021 (10 and eight cases per month, respectively), and in autumn-winter 2021 (12 cases in October 2021, 15 cases in November 2021, and 12 cases in December 2021) (Figure 2).
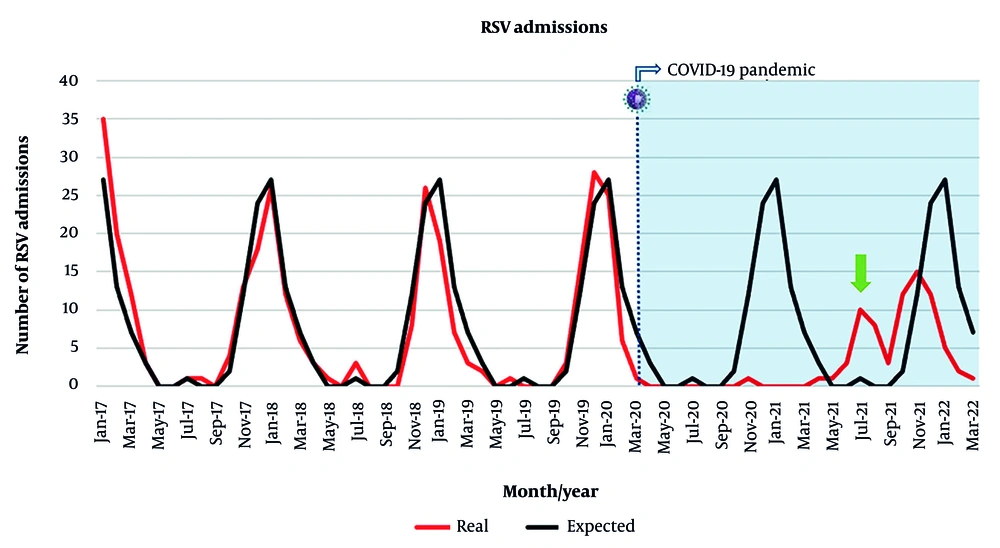
Figure 2.
Respiratory syncytial virus (RSV) admissions between January 2017 and March 2022. The red line represents the real number of RSV admissions registered in our unit, by month. The black line indicates the average of RSV admissions between 2017 and 2019, by month. This average was considered to be the expected number of admissions from 2020 to 2022. The dashed line represents the onset of the COVID-19 pandemic. The green arrow highlights the summer peak recorded in 2021.
The proportion of RSV hospitalized patients aged 24 months or older was different across the years (P = 0.002, adjusted-P = 0.015), having significantly increased in 2021 compared to 2017 (P = 0.011, adjusted-P = 0.055), 2018 (P = 0.010, adjusted-P = 0.053), and 2019 (P = 0.003, adjusted-P = 0.021), but not 2020 (P = 0.186) (Table 1).
The proportion of RSV hospitalized patients who needed HF oxygen therapy was different across the years (P = 0.001, adjusted-P = 0.008), being significantly higher in 2021 compared to 2017 (P = 0.001, adjusted-P = 0.008), 2018 (P < 0.001, adjusted-P = 0.001), and 2019 (P = 0.022, adjusted-P = 0.096), but not 2020 (P = 0.252). The proportion of patients who needed HF oxygen therapy was also higher in 2020 compared to 2018 (P = 0.021, adjusted-P = 0.095), but not 2019 (P = 0.491). There were no differences regarding the length of stay, gender, prematurity, chronic disease, reasons for admission, bacterial superinfection, viral coinfections, admission to the PICU, low-flow oxygen therapy, NIV, or MV across the years (Table 1).
Being male conferred a higher risk of being admitted to the PICU (P = 0.015, adjusted-P = 0.071) and the need for MV (P = 0.007, adjusted-P = 0.041). Having more than one reason for hospitalization was related to a longer length of stay (P < 0.001, adjusted-P = 0.001) and conferred a higher risk of admission to the PICU (P < 0.001, adjusted-P = 0.002), low-flow oxygen therapy (P = 0.004, adjusted-P = 0.025), HF oxygen therapy (P < 0.001, adjusted-P = 0.001), and NIV (P = 0.010, adjusted-P = 0.053). Being born preterm was related to a longer length of stay (P = 0.004, adjusted-P = 0.025). Having a chronic disease was also related to a longer length of stay (P < 0.001, adjusted-P = 0.001). Having a bacterial superinfection was related to a longer length of stay (P < 0.001, adjusted-P = 0.001) and conferred a higher risk of admission to the PICU (P < 0.001, adjusted-P = 0.001), HF oxygen therapy (P < 0.001, adjusted-P = 0.003), NIV (P < 0.001, adjusted-P = 0.001), and MV (P < 0.001, adjusted-P = 0.001). Being less than 24 months old or having a viral coinfection was not related to a longer length of stay and did not confer a higher risk of admission to the PICU, low-flow oxygen therapy, HF oxygen therapy, NIV, or MV (Table 2).
Table 2.
Comparative Analysis of Clinical and Demographic Predictors of Hospital Resource Utilization a
| Variables | Length of Stay (D) b | ICU Admission | O2 Need | HF Need | NIV Need | MV Need |
|---|---|---|---|---|---|---|
| Age (mo) | ||||||
| < 24 | 6.0 (4.0 - 8.0) | 63.357 (17.6) | 321.357 (89.9) | 40.357 (11.2) | 42.357 (11.8) | 11.357 (3.1) |
| ≥ 24 | 5.0 (2.0 - 7.0) | 0.11 (0.0) | 8.11 (72.7) | 1.11 (9.1) | 2.11 (18.2) | 0.11 (0.0) |
| P-value | 0.666 | 0.126 | 0.068 | 0.826 | 0.518 | 0.554 |
| Gender | ||||||
| Male | 6.0 (4.0 - 8.0) | 41.188 (21.8) | 169.188 (89.9) | 23.188 (12.2) | 27.188 (14.4) | 10.188 (5.3) |
| Female | 6.0 (4.0 - 7.0) | 22.180 (12.2) | 160.180 (88.9) | 18.180 (10.0) | 17.180 (9.4) | 1.180 (0.6) |
| P-value | 0.199 | 0.015 c | 0.754 | 0.496 | 0.146 | 0.007 c |
| Reason for admission | ||||||
| 1 | 5.5 (3.0 - 7.0) | 18.184 (9.8) | 156.184 (84.8) | 7.184 (3.8) | 14.184 (7.6) | 4.184 (2.2) |
| ≥ 2 | 6.0 (5.0 - 9.0) | 45.184 (24.5) | 173.184 (94.0) | 34.184 (18.5) | 30.184 (16.3) | 7.184 (3.8) |
| P-value | < 0.001 c | < 0.001 c | 0.004 c | < 0.001 c | 0.010 c | 0.358 |
| Prematurity | ||||||
| Term | 6.0 (4.0 - 7.0) | 48.297 (16.2) | 266.297 (89.6) | 30.297 (10.1) | 34.297 (11.4) | 7.297 (2.4) |
| Preterm | 7.0 (5.0 - 9.0) | 15.71 (21.1) | 63.71 (88.7) | 11.71 (15.5) | 10.71 (14.1) | 4.71 (5.6) |
| P-value | 0.004 c | 0.318 | 0.911 | 0.195 | 0.538 | 0.145 |
| Chronic disease | ||||||
| No | 6.0 (4.0 - 7.0) | 54.300 (18.0) | 272.300 (90.7) | 37.300 (12.3) | 35.300 (11.7) | 8.300 (2.7) |
| Yes | 7.0 (5.0 - 11.8) | 9.68 (13.2) | 57.68 (83.8) | 4.68 (5.9) | 9.68 (13.2) | 3.68 (4.4) |
| P-value | < 0.001 c | 0.346 | 0.098 | 0.127 | 0.719 | 0.445 |
| Bacterial superinfection | ||||||
| No | 6.0 (4.0 - 7.0) | 19.237 (8.0) | 208.237 (87.8) | 16.237 (6.8) | 14.237 (5.9) | 0.237 (0.0) |
| Yes | 7.0 (5.0 - 10.0) | 44.131 (33.6) | 121.131 (92.4) | 25.131 (19.1) | 30.131 (22.9) | 11.131 (8.4) |
| P-value | < 0.001 c | < 0.001 c | 0.170 | < 0.001 c | < 0.001 c | < 0.001 c |
| Viral coinfection | ||||||
| No | 6.0 (5.0 - 9.0) | 25.119 (21.0) | 108.119 (90.8) | 15.119 (12.6) | 20.119 (16.8) | 5.119 (4.2) |
| Yes | 6.0 (4.0 - 8.0) | 22.117 (18.8) | 102.117 (87.2) | 12.117 (10.3) | 12.117 (10.3) | 4.117 (3.4) |
| P-value | 0.907 | 0.672 | 0.380 | 0.571 | 0.142 | 0.754 |
Abbreviations: HF, high-flow oxygen therapy; NIV, non-invasive ventilation; MV, mechanical ventilation.
a Values are expressed as No. (%).
b The length of stay is described as median (interquartile range).
c Significant results considering a critical false-discovery rate of 10%.
5. Discussion
5.1. Comparison of Respiratory Syncytial Virus Admissions Before and During the COVID-19 Pandemic
Regarding HF oxygen therapy, two previous studies by the same author showed an increase in HF oxygen need during the COVID-19 pandemic era (4, 5). Contrary to another study, which analyzed only 17 patients during the COVID-19 pandemic and found no differences regarding HF oxygen need compared to the pre-pandemic era (6), our study showed that HF oxygen support increased in 2021 compared to 2017, 2018, and 2019.
Concerning low-flow oxygen therapy during the COVID-19 pandemic era, one study showed an increase (4), while another study showed a decrease in its use (6). In our study, the percentage of use of low-flow oxygen remained the same before and during the COVID-19 pandemic.
In one study, NIV increased, but MV decreased during the COVID-19 pandemic era (7). Another study showed an increase in both NIV and MV during the COVID-19 pandemic (4, 6). Yet, another study showed an increase in NIV, with no changes in MV (5). In our study, the percentage of use of NIV remained nearly the same, with no patients needing MV in 2021 compared to 2.8 - 5.1% in the pre-pandemic period. Despite this, statistically significant differences could not be found, probably because the number of hospitalized patients was smaller in the COVID-19 years.
In most previous studies, there was no difference in the length of stay when comparing the pre-pandemic with the pandemic era (8-10). A similar result was observed in our study.
Regarding admission to the PICU, previous studies also presented conflicting results, with some studies showing a significant increase in RSV-associated admissions to the PICU during the COVID-19 pandemic (6, 7), and others showing a similar number of admissions to the PICU in the COVID-19 pandemic compared to the pre-pandemic era (8, 9). Similarly, in our study, the number of patients admitted to the PICU did not significantly increase during the COVID-19 pandemic.
In 2020, at the beginning of the COVID-19 pandemic, the number of pediatric RSV admissions largely decreased in our hospital, as occurred in other countries (1-3). In 2021, RSV admissions in our hospital had two smaller peaks, one in the summer and another in the winter. Other countries reported a small peak of RSV hospitalizations in the summer of 2021, but they registered a higher peak in the winter of the same year (1, 2). However, in Spain, as in our study, two small peaks regarding RSV hospitalizations were reported (3).
In our study, the number of RSV hospitalized patients aged 24 months or older significantly increased in 2021 compared to 2017, 2018, and 2019. This age increase was shown by some previous studies (7, 11). One possible explanation is the COVID-19 confinement and the use of masks, which helped prevent RSV transmission to vulnerable infants in 2020, predisposing them to this infection later due to absent or decreased immunity to the virus. Another possible explanation is that RSV features changed during the COVID-19 pandemic, becoming a more severe infection, causing atypical presentations such as hospitalization at older ages.
Contrary to previous studies (12, 13), our study did not show a male gender prevalence among RSV admitted patients before and during the COVID-19 pandemic. Despite the reduction in the percentage of invasive bacterial infections observed during the COVID-19 pandemic (14), our study showed that the percentage of pneumonia due to bacterial superinfection of RSV hospitalized pediatric patients remained high during the COVID-19 pandemic.
Concerning viral RSV coinfections, few studies have been performed so far, with conflicting results. In one study, viral RSV coinfections increased during the COVID-19 pandemic compared to the pre-pandemic era (4). In another study, however, no differences regarding viral RSV coinfections were found during the COVID-19 pandemic (6). In line with this study, our study did not show differences in RSV viral coinfections during the COVID-19 pandemic, with the percentage of RSV viral coinfection remaining high. The most common coinfecting virus was rhinovirus, followed by bocavirus and adenovirus.
5.2. Risk Factors for Severe Disease
Previous studies have identified prematurity as a risk factor for adverse outcomes, such as the need for oxygen, NIV, and admission to the PICU (17). Comorbidities have also been previously associated with PICU admission and the escalation of support therapy (18, 19). In our study, prematurity and chronic disease were associated with a longer length of stay, but not with PICU admission or advanced support. It is important to note that the preterm and chronic disease groups have a smaller number of individuals compared to the groups of term and healthy patients. This might explain why we did not find differences regarding PICU admission or support therapy, contrary to previous studies.
Consistent with previous studies (20, 21), male gender was associated with PICU admission for MV, and the presence of bacterial superinfection was related to more severe disease. Overall, having more than one reason for admission was associated with more severe disease in our study. Some previous studies have linked younger age to PICU admission (22, 23). However, in our study, age less than 24 months was not associated with severe disease. In line with some previous studies (21, 24), viral coinfection was not associated with severe disease.
5.3. Conclusions
The comprehensive characterization of RSV-hospitalized pediatric patients in our study, which indicates that RSV seasonality and severity may have been influenced by a viral pandemic, will alert health authorities to continue monitoring RSV epidemiology. This is crucial for determining the most suitable RSV prevention methods available on the market, such as palivizumab or nirsevimab for infants and the RSV vaccine for pregnant women. The choice of the best method should consider the baby's birth date, RSV seasonality, and the severity of that season.
5.4. Limitations
As for limitations, this was a retrospective study, and coinfections with Influenza and SARS-CoV-2 viruses were not investigated, as children with these infections were hospitalized in the Infectiology Unit, a separate unit of our tertiary hospital. Consequently, our data can only be generalized to RSV children not coinfected with Influenza or SARS-CoV-2 viruses. Some other coinfections might also have been missed, as some PCR panels used to detect RSV do not include all coinfecting viruses. Since one of the PCR panels does not identify RSV subtypes A/B, we did not perform RSV subtype analysis in this study. The impact of COVID-19 mitigation measures, such as wearing masks or social distancing in 2020 and 2021, could not be quantified.
5.5. Strengths
Among the strengths of our study is the inclusion of a large number of patients, encompassing the population of RSV patients admitted to the General Pediatrics Unit of a tertiary hospital. Several data points were analyzed to address changes in RSV characteristics during the COVID-19 pandemic, with risk factors for severe disease being investigated.