1. Background
The morbidity and mortality of children with sepsis has amounted to data reported in adult ICUs in developed countries (1-3). However, the definition of sepsis for children is still not very clear (4). The 2005 Consensus definition for pediatric sepsis maintained the requirement for systemic inflammatory response syndrome (SIRS) and provided further explanation on organ failure definitions (5). The validity of SIRS criteria to identify and evaluate severity of patients diagnosed as sepsis has been challenged in adults owing to the lack of sensitivity and specificity (6, 7). The Sepsis-3 was based on the SOFA score and emphasized that because of the presence of life-threatening organ dysfunction, sepsis was different from uncomplicated infection (8). However, the SOFA score was not adapted for children. Therefore, the current pediatric sepsis definition remains essentially based on Sepsis-2, which is not good for clinical research (9). Matics and Sanchez-Pinto put forth a SOFA score designed specifically for pediatric patients (pSOFA) (Table 1) (10).
Table 1.
Pediatric Sequential Organ Failure Assessment Score (Only Supplemental Material)a
| Variable | Score | ||||
|---|---|---|---|---|---|
| 0 | 1 | 2 | 3 | 4 | |
| Respiratory PaO2/FiO2 | ≥ 400 | 300 - 399 | 200 - 299 | 100 - 199 | < 100 |
| Respiratory SpO2/FiO2 | ≥ 292 | 264 - 291 | 221 - 264 | 148 - 220 | < 148 |
| Respiratory support, (yes/no) | Yes | Yes | |||
| Coagulation | |||||
| Platelet count, × 109/L | ≥ 150 | 101 - 149 | 50 - 99 | 20 - 49 | < 20 |
| Hepatic | |||||
| Bilirubin, mg/dl | < 1.2 | 1.2 - 1.9 | 2.0 - 5.9 | 6.0 - 11.9 | > 12.0 |
| Cardiovascular MAP by age group or vasoactive infusion, mmHg or ug/kg/min | |||||
| < 1 mo | ≥ 46 | < 46 | |||
| 1 - 11 mo | ≥ 55 | < 55 | |||
| 12 - 23 mo | ≥ 60 | < 60 | |||
| 24 - 59 mo | ≥ 62 | < 62 | |||
| 60 - 143 mo | ≥ 65 | < 65 | |||
| 144 - 216 mo | ≥ 67 | < 67 | |||
| > 216 mo | ≥ 70 | < 70 | |||
| Dopamine hydrochloride | ≤ 5 or | > 5 or | > 15 or | ||
| Epinephrine norepinenephrine | ≤ 0.1 or ≤0.1 | > 0.1 or > 0.1 | |||
| Dobutamine hydrochloride (any), (yes/no) | Yes | ||||
Abbreviations: FiO2, fraction of inspired oxygen; MAP, mean arterial pressure; pSOFA, pediatric sequential organ failure assessment.
aTo convert bilirubin to micromoles per liter, multiply by 17.104; creatinine to micromoles per liter, multiply by 88.4.
2. Objectives
In this study, we aimed to evaluate the predictive validity of the pSOFA score for in-hospital mortality in children with sepsis in a PICU of a developing country.
3. Methods
A cross-sectional study was conducted in the Pediatric Intensive Care Unit of the first Affiliated Hospital of Guangdong Medical University in Zhanjiang city, Guangdong Province, China, from June 1st, 2016 to June 1st, 2018. Several data were collected retrospectively for the pSOFA score estimation. Using these data, PELOD-2 score and P-MODS estimation were also possible. If a variable was measured more than once in the first day, the worst value of the variable was used to calculate the pSOFA, PELOD-2 and P-MODS.
The inclusion criteria were as follows: (1) the diagnostic criteria of the International Pediatric Sepsis Conference issued in 2005 (5) were met; (2) the length of PICU stay was more than 24 hours; (3) the patient’s age was between 1 month and 14 years; and (4) complete clinical data were available. The exclusion criteria were as follows: (1) a length of PICU stay less than 24 hours or death within the first 24 hours of admission; (2) younger than 1 month old or older than 14 years old; (3) transfer to another hospital; or (4) incomplete clinical data (Figure 1).
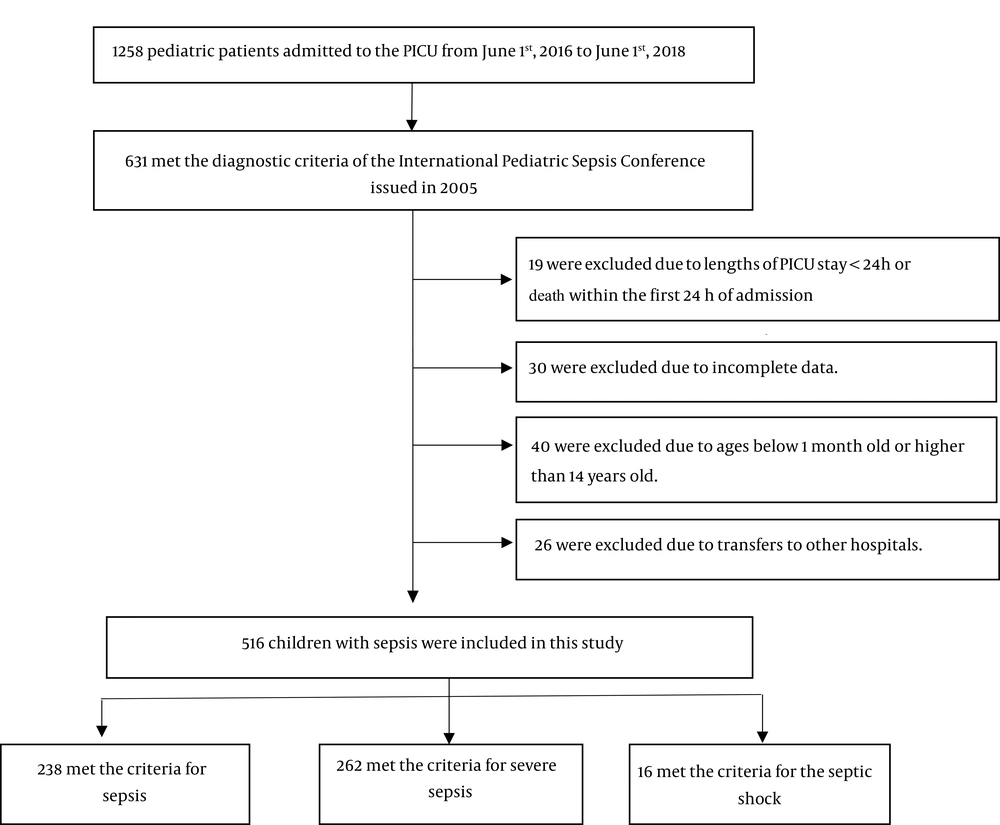
Figure 1.
Schema depicting patients’ patients’ enollment
Sex, age, site of infection, length of PICU stay, total hospitalization time, whether mechanical ventilation was required, duration of ventilatory support, and whether vasoactive drugs were needed, were recorded on a data collection form designed for the study. All data were extracted from the electronic medical record system of the first Affiliated Hospital of Guangdong Medical University.
The pSOFA score was developed by adapting the original SOFA score in two ways (10). On the one hand, as the cardiovascular and renal variables were age dependent, the original SOFA scores were modified using validated cutoffs from the PELOD-2 scoring system (11, 12). On the other hand, the respiratory subscore was expanded to include the SpO2:FiO2 ratio as a replacement of lung injury. The adaptation put forward by Khemani and colleagues (13) was used to define the SpO2:FiO2 ratio cutoffs. Besides, coagulation, hepatic, and neurologic sub-scores were based on original scores and GCS criteria kept identical to pediatric range of original scores.
For the PELOD-2 score, five organ systems were considered and 10 variables were collected at the first 24 hours of PICU admission. If a variable was measured more than once in the first 24 hours, the worst value was used in calculating the score. Details of the components of PELOD-2 score are given elsewhere (14).
For the P-MODS, five organ systems (cardiovascular, respiratory, liver, coagulation, and renal) were included and several variables (namely lactatemia, PaO2/FiO2 ratio, bilirubin, fibrinogen, and urea nitrogen) were collected at the first day of PICU admission (15).
Statistical analysis was performed using SPSS21.0 software and MedCalc15.2.2 software. Kolmogorov-Smirnov test was used to test the normality of the qualitative data. t-tests were used for normal quantitative data. Mann–Whitney U‑test was used for abnormal quantitative data. Categorical variables were compared using the χ2 test. A 2-sided P < 0.05 was considered statistically significant.
The performance of the scores to discriminate in-hospital mortality was evaluated using the AUC. The DeLong method (16) was used to make comparisons between scores by comparing AUCs, and the integrated discrimination improvement index (17) was used to assess the reclassification of predicted probabilities between survivors and non-survivors. The Youden J statistic (18) was used to assess the optimal threshold of the pSOFA score to differentiate in-hospital mortality.
The main evaluation index of this study was the AUC. We aimed to evaluate the performance of the pSOFA score to discriminate in-hospital mortality. Related research showed that the AUC of the pSOFA score was 0.88. The ratio between survivors and non-survivors was 37 (10). The significance level was 0.05, the efficacy was 0.8, and the allocation ratio between samples was 50. As the study was a retrospective observational study, the abscission rate was 0%. The sample size was estimated by the software PASS11.0 and a total of 204 children with sepsis were needed (4 from the non-survival group and 200 from the survival group). Finally, the study included 516 children with sepsis in the PICU (28 from the non-survival group and 488 from the survival group).
4. Results
A total of 516 patients met inclusion criteria. Among them, 238 (46.1%) met the criteria for sepsis, 262 (50.8%) met the criteria for severe sepsis, and 16 (3.1%) met the criteria for septic shock. Of the 488 survivors of hospital inpatients, 311 (63.7%) were male and the median (interquartile range [IQR]) age was 8 (2 - 36) months. Among the 28 non-survivors, 16 (57.1%) were male with a median (IQR) age of 12 (3 - 36) months. There were no significant differences in sex, age, site of infection or length of PICU stay between the two groups (all P > 0.05). The demographic and clinical characteristics of the survivors and non-survivors are shown in Table 2.
Table 2.
Demographic and Clinical Characteristics of Survivors and Non-Survivors
| Characteristics | Survivors, (N = 488) | Non-survivors(N = 28) | P Value |
|---|---|---|---|
| Male, No. (%) | 311 (63.7) | 16 (57.1) | 0.482 |
| Age, median (IQR), mo | 8 (2 - 36) | 12 (3 - 36) | 0.479 |
| Site of infection, No. (%) | 0.077 | ||
| Respiratory | 280 (57.4) | 11 (39.3) | |
| Nervous system | 72 (14.8) | 6 (21.4) | |
| Digestive system | 43 (8.8) | 2 (7.1) | |
| Blood | 6 (1.2) | 0 | |
| Urinary tract | 13 (2.6) | 0 | |
| Other | 74 (15.2) | 9 (32.1) | |
| Sepsis classification, No. (%) | ≤ 0.001 | ||
| Sepsis | 238 (49) | 0 (0) | |
| Severe sepsis | 242 (50) | 20 (71) | |
| Septic shock | 8 (1) | 8 (29) | |
| Scores on day 1, median (IQR) | |||
| pSOFA | 3 (2 - 4) | 7.5 (6 - 11) | ≤ 0.001 |
| PELOD-2 | 0 (0 - 2) | 6.5 (4 - 8) | ≤ 0.001 |
| P-MODS | 1 (1 - 2) | 3 (2 - 6) | ≤ 0.001 |
| Outcomes, median(IQR), d | |||
| The duration of ventilatory support | 0 (0 - 0) | 2 (1 - 5) | ≤ 0.001 |
| PICU, LOS | 1 (1 - 8) | 3 (2 - 6) | 0.686 |
| Hospital los | 9 (6 - 15) | 3 (2 - 6) | ≤ 0.001 |
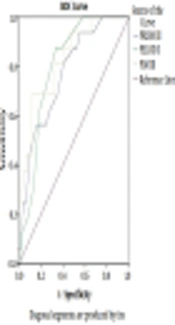
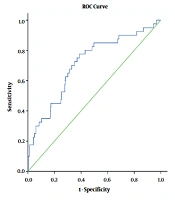
The pSOFA score, PELOD-2 score, and P-MODS in the non-survivor group was significantly higher than that of survivor group [pSOFA score: 7.5 (6-11) vs. 3 (2 - 4), PELOD-2 score: 6.5 (4 - 8) vs. 0 (0 - 2), P-MODS: 3 (2 - 6) vs. 1 (1 - 2), all P < 0.05] (Table 2). ROC curve analysis showed that the AUCs of the pSOFA score, PELOD-2 score and P-MODS predicting prognosis of children with sepsis in a PICU of a developing country were 0.937 (0.913 - 0.957), 0.916 (0.888 - 0.938), 0.761 (0.722 - 0.798), respectively (all P < 0.05) (Table 3 and Figure 2). This indicates that the pSOFA score has excellent discrimination for in-hospital mortality. The optimal pSOFA threshold to differentiate in-hospital mortality was a score higher than 5 points. There was no significant difference in the AUC between the pSOFA score and PELOD-2 score (P > 0.05). However, there was significant difference in the AUC between the pSOFA score and P-MODS (P < 0.05).
Table 3.
Comparison of pSOFA with other Pediatric Organ Dysfunction Scoresa
| Scoring System | AUC | 95%CI | Cutoff | SE, % | SP, % | +PV, % | -PV, % | Z value | P value for AUC Comparisona |
|---|---|---|---|---|---|---|---|---|---|
| pSOFA | 0.937 | 0.913 - 0.957 | 5 | 85.71 | 87.70 | 29 | 99 | 26.436 | |
| PELOD-2 | 0.916 | 0.888 - 0.938 | 2 | 89.29 | 80.94 | 12 | 99 | 14.228 | 0.292 |
| P-MODS | 0.761 | 0.722 - 0.798 | 2 | 64.29 | 81.76 | 17 | 98 | 4.688 | 0.011 |
Abbreviations: AUC, area under the curve; PELOD-2, pediatric logistic organ dysfunction score 2; P-MODS, pediatric multiple organ dysfunction score; pSOFA, pediatric sequential organ failure assessment; SE, sensitivity; SP, specificity; +PV, positive predictive value; -PV, negative predictive value; 95% CI, 95% confidence intervals.
aP value for AUC comparison was based on the Delong method.
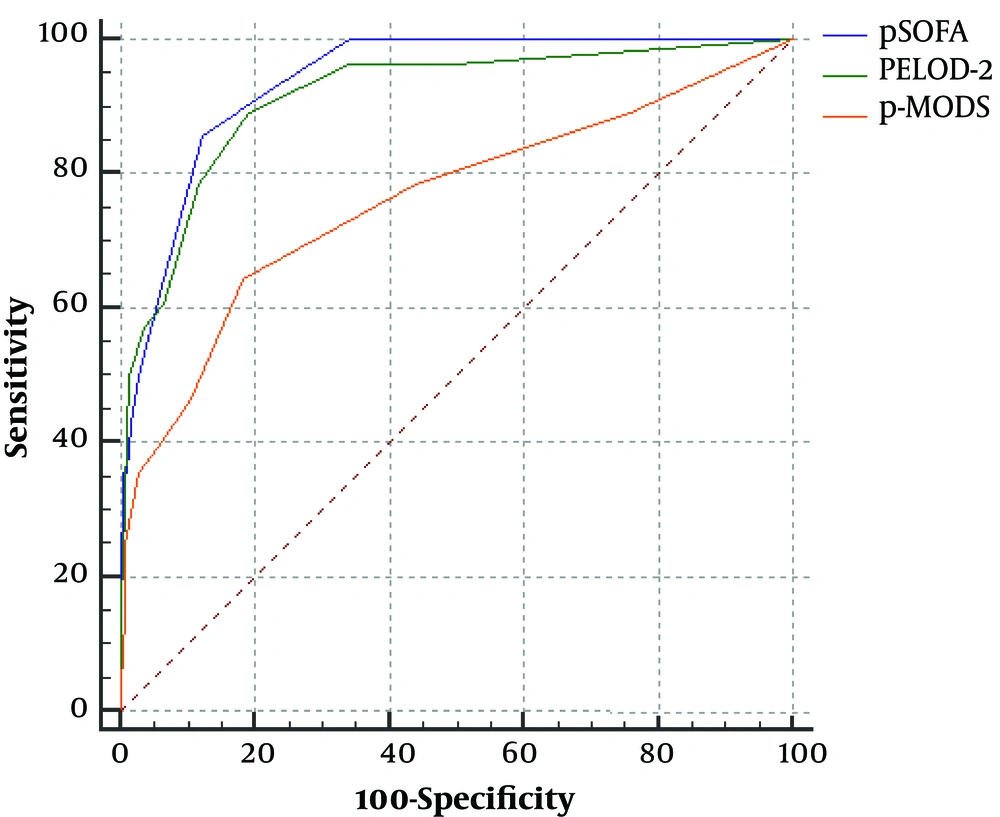
Figure 2.
Receiver operating characteristic curves of pSOFA score, PELOD-2, P-MODS for predicting in-hospital mortality
5. Discussion
The purpose of our study was to evaluate the predictive validity of the pSOFA for in-hospital mortality in children with sepsis in a PICU of a developing country. The Sepsis-3 was based on the SOFA score (8). However, the SOFA score was not adapted for children. Therefore, the current pediatric sepsis definition remains essentially based on Sepsis-2, which is not conductive for the development of clinical research (9). Matics and Sanchez-Pinto, put forth a pediatric version of the SOFA score (pSOFA), which was developed by adapting the original SOFA score with age-adjusted cutoffs for the cardiovascular and renal systems and by expanding the respiratory criteria to include noninvasive surrogates of lung injury (10). In addition, the authors concluded that the maximum pSOFA score had excellent predictive validity for in-hospital mortality (AUC, 0.94, 95% CI, 0.92 - 0.95). The usefulness of the SOFA score has been previously validated in large cohorts of critically ill patients (7, 19, 20). However, it remains unknown whether the pSOFA score is applicable to evaluate the prognosis of children with sepsis in a PICU of a developing country or not. Our study shows that the pSOFA score on day 1 (AUC, 0.937, 95% CI, 0.913 - 0.957) is effective and has the ability to assess the prognosis of children with sepsis in a PICU of a developing country, which is conductive to the promotion of pSOFA in developing countries. Additionally, we concluded that the pSOFA score was comparable to or better than the performance of other common pediatric organ dysfunction scores. Meanwhile, in our study, we found that the optimal pSOFA score cutoff to differentiate in-hospital mortality was a score higher than 5 points which was different from the cutoff found by Matics and Sanchez-Pinto in children with sepsis in a PICU of a developed country. This observation requires further validation.
Our study has several limitations to be considered. Firstly, as a retrospective observation study, we didn’t have enough data to calculate all scores daily to dynamically assess the condition of patients. Secondly, the relatively small sample size might have resulted in a less precise estimation of the accuracy of the pSOFA score. These limitations reduce the generalizability of our findings and emphasize the need for future prospective multicenter studies.
5.1. Conclusions
The pSOFA score is effective and has the ability to assess the prognosis of children with sepsis in a PICU of a developing country.