
1. Background
Millions of children and families suffer from child abuse worldwide. This issue affects children significantly regardless of their race, color, social class and religion, including all ages (1). Statistics have been different in different periods of time and regions. Among children confirmed as victims by Child Protective Services (CPS) agencies in 2011, 681000 children were victims of abuse and neglect in United State of America. Overall, 78.5% of victims had experienced neglect and, this was the most common form of child maltreatment and 9.1% of the victims had been sexually abused (2, 3).
Many factors contribute to child abuse. Accordingly, family and environmental factors (parent's psychological status, economic problems, family conflicts, children's rights laws and education attitudes), and the child sexual and psychological issues may result in that problem (4).
Chronic psychological or physical illnesses, addiction or history of child abuse in the past, big families, low economic status, and history of violence and child abuse in family members may predispose a child to physical abuse (5). Child abuse in most of the time encompasses bruises and broken bones. Usually, physical abuse is the most visible, but other types of abuse including psychological abuse and neglect also leave deep, lasting psychological scars on kids. The sooner abused children get help, the greater chance they have to heal and break the cycle rather than continuing it. Prematurity, disability and hyperactivity are also involved in the incidence of child abuse (6, 7).
In some studies, parents and close relatives are introduced as the greatest (30.4%) cause of physical child abuse, while classmates and strangers are introduced as the most common cause of psychological abuse, neglect and sexual abuse (7).
2. Objectives
This study aimed to investigate the related variables for different types of child abuse and their perpetrators in boys and girls of the 7th and 8th grade students of Hamedan to assist in future prevention programs aimed at reducing child abuse.
3. Methods
Having obtained written permission and approval from Hamedan province's general education administration and Hamadan University of Medical Sciences in 2017, 571 high school students of Hamadan were recruited and multi-stage clustered sampling was used to get the samples.
The inclusion criteria were being in seventh or eighth grade and giving oral consent (after necessary information) to participate in the study, while the exclusion criterion consisted of presenting incomplete questionnaire.
A self-reporting questionnaire was used to collect information. The questionnaire included demographic and child abuse information and investigated psychological and physical aspects of child abuse. The reliability of it varied from 0.92 to 0.98 (11). Demographic information included 20 items, while child abuse information included 24 items about child abuse issues (9 items), physical child abuse (6 items), and neglect (9 items). Unfortunately, we didn’t get permission to ask about sexual abuse from preservation center of education office because of cultural limitation. Each item in standard questionnaire had three answers, including never (score 2), sometimes (score 1) and more often (score 0). Hence, higher scores meant less abuse and lower scores represented more abuse. Finally, the students were asked to identify the abusive person.
In order to compare the frequency of physical and psychological abuse and neglect, the scores of each question were combined and the average score was calculated. Lower mean score is indicative of more abuse. The percentage of responding to each question was calculated to determine the most common form of physical and psychological abuse and neglect.
Regarding the importance of the subject and necessity of gaining student’s consent and trust for cooperation in responding questions, first of all, essence and purpose of the questionnaire were explained to them, emphasizing anonymity of the person. According to the last ethical committee suggestion, a short notice was embedded at the top of every questionnaire, which suggested consulting with their parents before filling it out at home and returning it blank if they didn’t wish to complete it. All questionnaires were collected in a box the day after, which was placed in the middle of the class. They were assured that their personal information would remain wholly confidential. The study was started after approval from institute’s ethical committee (ID: IR. UMSHA.REC.1394, 23).
The data were analyzed by descriptive and analytical statistics with SPSS V. 21. The frequency and percentage of responses to each question were calculated first. According to the scale of the questionnaire, the total score of each individual was obtained. The normality of data distribution was checked. The significance level in all tests was 0.05.
4. Results
This study examined 571 [294 (51.5%) boys] students at the 7th and 8th grade of high school, 462 (80.9%) of whom were studying in public schools. The mean age of the students was 15.28 ± 1.28 years, for further demographic information see Table 1.
Table 1.
Family Environment Characteristics of Adolescents Included in Cross-Sectional Study for Detecting the Perpetrators of Child Abuse and Neglect (N = 571)
| Variable | Number (%) |
|---|---|
| Parents’ marital status | |
| Divorced or separated | 8 (1.4) |
| Living together | 563 (98.6) |
| Mother’s education | |
| University educated | 78 (13.6) |
| Diploma and less | 493 (86.3) |
| Father’s education | |
| University educated | 100 (17.5) |
| Diploma and less | 471 (82.4) |
| Parent’ drug, cigarette and/or alcohol consumption | |
| Yes | 214 (37.4) |
| No | 357 (62.5) |
| Student’s job | |
| Yes | 65 (11.3) |
| No | 506 (88.6) |
| Student’s drug, cigarette and/or alcohol experience | |
| Yes | 96 (16.8) |
| No | 475 (83.1) |
The mean and standard deviation of the students' scores for neglect, physical punishment and psychological abuse were 11.74 ± 5.38 (Min: 0, Max: 18), 5.08 ± 3.19 (Min: 0, Max: 12) and 9.89 ± 4.6 (Min: 0, Max: 18), respectively.
The most common types of neglect were students' discomfort and lack of welfare at home (51.0%), lack of attention to students' demands (46.6%), and parent’s excessive expectations (39.2%). Accordingly, the most common forms of severe physical abuse were corporal punishment conducing abrasion and burns (51.8%). Finally, the most common forms of psychological abuse were parent’s strict behaviors (25.7%), insulting and disrespecting the students (25.4%) and humiliation of them (24.9%).
Parents and first degree family members of students had significant role in children abuse. Frequency of all types of abuse are reported in Figure 1.
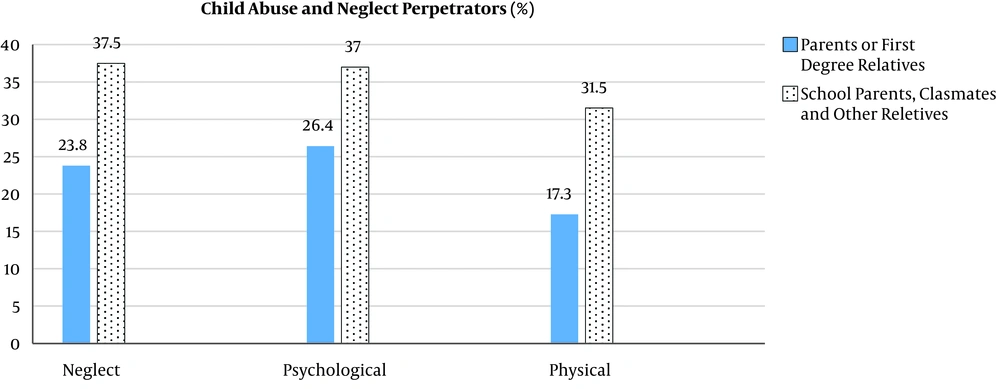
Figure 1.
Types of child abuse by perpetrators (n = 571)
Table 2 shows all variables for child abuse and neglect. Based on the mean scores interpretation, psychological and physical abuse and neglect in girls and private schools were significantly higher than in boys and state schools (P < 0.001). Accordingly, the level of psychological abuse in students with smoking or substance experience was significantly higher than in others (P < 0.001). There was no significant difference between the sexes regarding physical abuse and neglect. Students who were simultaneously studying and working were also significantly less likely to be physically abused than those who did not have a job (P = 0.002). The children ranking middle in birth order were in safer situation for all types of abuse compared with the first and the last children (P < 0.001).
Table 2.
The Relationship Between Neglect, Psychological and Physical Abuse, and Student’ Related Variables in Hamadan Province, During Year 2017 (Higher Score Represents More Abuse)
| Variablesa | Neglect | Psychological | Physical | |||
|---|---|---|---|---|---|---|
| Mean ± SD | P Value | Mean | P Value | Mean | P Value | |
| Sex | < 0.001b | < 0.001 | < 0.001 | |||
| Female (n = 227) | 9.1 ± 5.8 | 8.5 ± 4.9 | 3.5 ± 2.6 | |||
| Male (n = 294) | 14.1 ± 4.2 | 13.2 ± 4.3 | 8.2 ± 3.9 | |||
| Type of school | < 0.001b | < 0.001 | < 0.001 | |||
| State (n = 426) | 12.5 ± 5.5 | 11.6 ± 5.1 | 6.4 ± 4.3 | |||
| Non-state (n = 109) | 8.4 ± 4.5 | 8 ± 4 | 4.1 ± 3.1 | |||
| Students’ job | 0.1b | 0.053 | 0.002 | |||
| Yes (n = 65) | 12.8 ± 4.7 | 12.8 ± 4.1 | 7.4 ± 2.9 | |||
| No (n = 506) | 11.5 ± 5.7 | 10.8 ± 5.2 | 5.8 ± 4.1 | |||
| Students’ smoking or substance experience | 0.1b | < 0.001 | 0.1 | |||
| Yes (n = 114) | 11.1 ± 5.6 | 9.8 ± 5.5 | 5.5 ± 3 | |||
| No (n = 457) | 11.8 ± 5.6 | 11.2 ± 5 | 6.1 ± 4 | |||
| Birth rank | 0.001c | < 0.001 | < 0.001 | |||
| First (n = 357) | 11.6 ± 5.6 | 10.8 ± 5.2 | 5.7 ± 3.9 | |||
| Middle (n = 14) | 16.1 ± 0.7 | 16.7 ± 2.3 | 12 ± 0.1 | |||
| Last (n = 200) | 11.5 ± 5.6 | 10.8 ± 5.1 | 5.9 ± 1.4 | |||
aBased on coding manner, higher mean score shows less level of abuse in all domains.
bMann-Whithney U.
cKruskal-Wallis H.
In Table 3 we bring all related parents’ variables for abuse and neglect of the adolescents. Psychological abuse and neglect in students who had lost one or both of their parents were more evident than in others (P value of 0.04 and 0.001, respectively). There was also a significant relationship between parent’s addiction and low education and all assessed kinds of abuse in those adolescents (Table 2).
Table 3.
The Relationship Between Neglect, Psychological and Physical Abuse, and Student’s Variablesa
| Variables | Neglect | Psychological | Physical | |||
|---|---|---|---|---|---|---|
| Mean ± SD | P Value | Mean ± SD | P Value | Mean ± SD | P Value | |
| Parent’s alive | 0.001 | 0.04 | 0.7 | |||
| Yes (n = 555) | 11.8 ± 5.5 | 11.6 ± 5.2 | 6 ± 4.1 | |||
| No (n = 21) | 7.9 ± 5.8 | 9 ± 4.5 | 5.7 ± 2.7 | |||
| Economic situation | 0.004 | 0.001 | 0.8 | |||
| Proper (n = 225) | 10.9 ± 5.7 | 9.7 ± 5.2 | 5.9 ± 3 | |||
| Not proper (n = 346) | 12.2 ± 4.7 | 11.7 ± 4.9 | 6 ± 4.3 | |||
| Father education | < 0.001 | < 0.001 | < 0.001 | |||
| Illiterate (n = 174) | 10.8 ± 5.4 | 9.3 ± 4.3 | 5.2 ± 3.1 | |||
| Less than diploma (n = 296) | 11.4 ± 5.8 | 10.9 ± 5.3 | 5.8 ± 4.2 | |||
| University digress (n = 100) | 14.1 ± 4.6 | 13.9 ± 4.9 | 7.4 ± 4.8 | |||
| Mother education | < 0.001 | < 0.001 | < 0.001 | |||
| Less than primary school (n = 202) | 10.7 ± 5.5 | 9.1 ± 4.1 | 5.2 ± 3.1 | |||
| Less than diploma (n = 209) | 11.7 ± 5.7 | 11.2 ± 5.3 | 5.9 ± 4.2 | |||
| University digress (n = 78) | 14.2 ± 4.8 | 14.8 ± 4.5 | 8.1 ± 5.1 | |||
| Parents’ addiction or substance abuse | < 0.001 | < 0.001 | < 0.001 | |||
| Yes (n = 214) | 10.6 ± 5.5 | 9.6 ± 5.2 | 5.2 ± 3.6 | |||
| No (n = 357) | 12.4 ± 5.5 | 11.8 ± 4.9 | 6.4 ± 4.3 | |||
aBased on coding manner, higher mean score shows less level of abuse in all domains.
Considering the importance of detecting offenders in different types of abuse we asked students about it in different domains, separately. Based on the students’ answers, school parents and classmates showed more considerable role in all mentioned forms of child abuse. Perpetrators of child abuse and neglect are shown in Figure 1.
5. Discussion
Child abuse as a social problem has been taken into consideration by different scientists. Prevalence of child abuse is in a wide range between 12 to 70 percent based on different locations, sex, ages and type of abuse (12-16). In previous studies, in different parts of Iran, the overall child abuse rates were variable, ranging from 23% to 66% (6, 17).
According to the results, the most common types of neglect were students' discomfort and having no welfare at home, lack of attention to students' demands, and parent’s excessive expectations. In physical abuse it was punishment conducing abrasion and burn, and the most common forms of psychological abuse were parent’s strict behaviors, insulting, disrespecting the students and ridiculing them. In other studies bruises were the most frequent injuries resulting from physical abuse (18, 19). Bruises may be the only external indicator of serious internal injury, however it depends on ages, locations, and patterns of bruising (20).
In the present study all types of abuse by school, parents and classmates was significant. In another study conducted on high school students in Yazd, it was shown that the parents were mostly responsible for physical abuse and classmates and strangers committed psychological abuse, neglect and sexual abuse. In sexual abuse strangers were the main culprits (7) Many studies have suggested that, fathers, mothers, and siblings were the most common physical and psychological abusers in both genders (13), younger children, particularly under 1 years infants, are more likely to be abused severely by the family. Fatal child abuses were more likely to occur from fathers, side, whereas mothers were more probably involved in less violent manners of physical abuse (21).
In this study, physical abuse, psychological abuse and neglect in girls were significantly higher than that in boys. In this case the results are controversial. Some studies reported that boys were more likely to suffer from physical abuse, while psychological abuse was mostly observed in girls (6, 13).
Given the variables such as child abuse, occupation, education, family income, parent’s addiction and student employment, the frequency of child abuse in the addicted students was significantly higher. There was a significant relationship between parent’s education, parent’s occupation and child abuse.
In different studies relationship between diverse variables and child abuse has been considered. There was significant relationship between family income, parents’ low education, parents' occupation and parent’s divorce, as well as having positive history of abuse in parents and substance abuse or addiction in parents and different types of abuse (6, 7).
5.1. Conclusions
According to the results, it can be concluded that child abuse is high among high school students in Hamedan. Severe physical punishment, scratches, bruises and burns (physical abuse), insult and disrespect towards the student (psychological abuse), and parent’s excessive expectations were the most common types of child abuse. In addition, being female, substance abuse in a student or parent, parent’s low level of education and parent’s occupation were significantly associated with different varieties of abuse.
5.2. Limitations
The first limitation of the study was lack of data for sexual domain of child abuse, because we couldn’t get permission from Center for Secure Education. The second was the lack of data about specific perpetrators, we had to regard them together comprising first degree relatives, school caretakers and classmates. The next, was underestimating of the results, probably parents hindering their children to answer the questions divulging their act of abuse; and finally, the data was cross sectional and retrospective in nature. However, this study handles one of the most important and challenging health issues in adolescents; so, maybe addressing the problem can trigger running interventional programs by health managers and decision makers in order to reduce it in future. To achieve this goal, parents, teachers and actually anybody dealing with children should be trained in preventing abuse, knowing its risk factors and consequences. Also children should be familiarized with their rights regarding this issue. Providing students with a call-line, which is designated specifically for social problems, can be useful to help and support students and for reporting abuse.