Isolation and culture of HWJMSCs
This experiment was approved by the Research Ethics Committee at Tehran University of Medical Sciences. Fresh human umbilical cords were obtained after birth with the written informed consent of the parents, and immersed in cold Hanksꞌ balanced salt solution (HBSS, Sigma). The mesenchymal tissue was then diced into small fragments of about 3–5 mm and cultured in Dulbeccoꞌs modified Eagleꞌs medium (DMEM)/F12 (Invitrogen) supplemented with 15% fetal bovine serum (FBS; Invitrogen), 1% penicillin, and streptomycin (Sigma). The cells were incubated at 37 °C in a humidified atmosphere of 5% CO2-95% air.
Phenotype analysis of HWJMSCs
The cells from passages 2 to 4 cultured in 24-well plates were used to measure alkaline phosphatase activity of HWJMSCs. After formation of colonies, the cultures were washed with phosphate buffered saline (PBS) and stained with an alkaline phosphatase kit (Sigma kit 86) according to the manufacturerꞌs instructions.
Hydrogel preparation
The hydrogel was composed of 30% w/v PEG (6 kDa) and 70% w/v hyaluronic acid (~50 kDa, Lifecore Biomedical). The hydrogel containing hyaluronic acid and PEG was prepared according to the method of Liu
et al (
27). Briefly, hyaluronic acid was completely dissolved in aqueous solution, followed by magnetically stirring. After being placed still at room temperature for 30 min, hyaluronic acid stirred vigorously. The resultant mixture was concentrated using PEG powder to get an ultimate concentration of 3.0% wt.
IGF-1 was dissolved in PBS (pH 7.4) to obtain a stock solution with a concentration of 1000 μg/ mL. Then, 0.1 mL of this solution (100 μg) was added to 0.9 mL of hydrogel solution. The IGF-1 concentration was designed to be 100 μg/mL of each injected hydrogel. After thoroughly mixing, the mixture was kept at 4 °C. Before injection, the mixture was transferred into a 37 °C water bath to obtain hydrogel containing IGF-1.
IGF-1 diluted 100X for each formulation before the release test but to achieve sufficient neovascularization for in-vivo study 100 µg of IGF-1 was added to the 0.9 mL of the hydrogel.
Hydrogel characterization
Rheological measurements
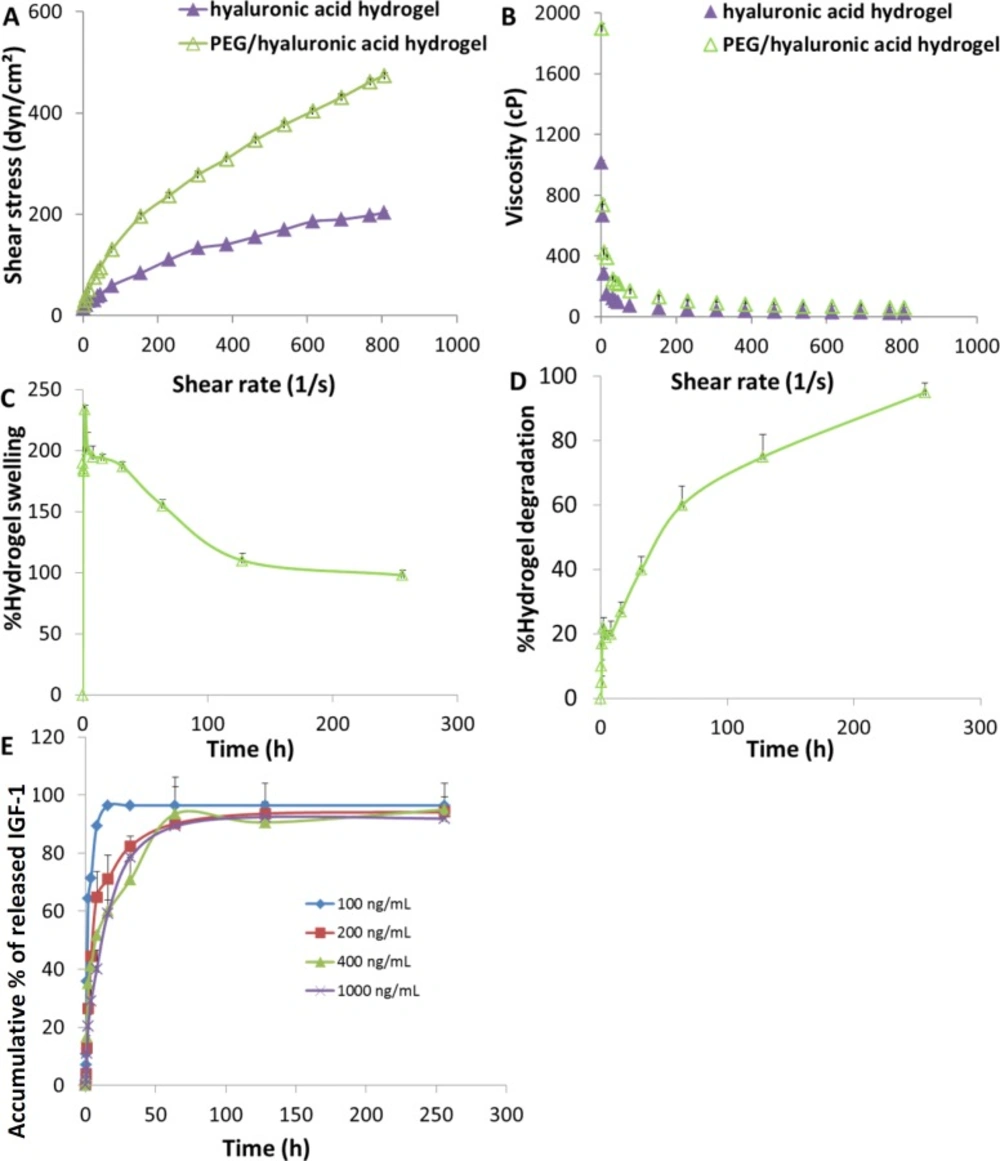
Rheological parameters were measured in triplicate at 25 °C, using a cone-and-plate instrument (Brookfield model DV-III, USA), equipped with a CP42 spindle. Rheological measurements were performed with increasing shear rates (0.3–210 rpm) to obtain plots of shear stress versus shear rate.
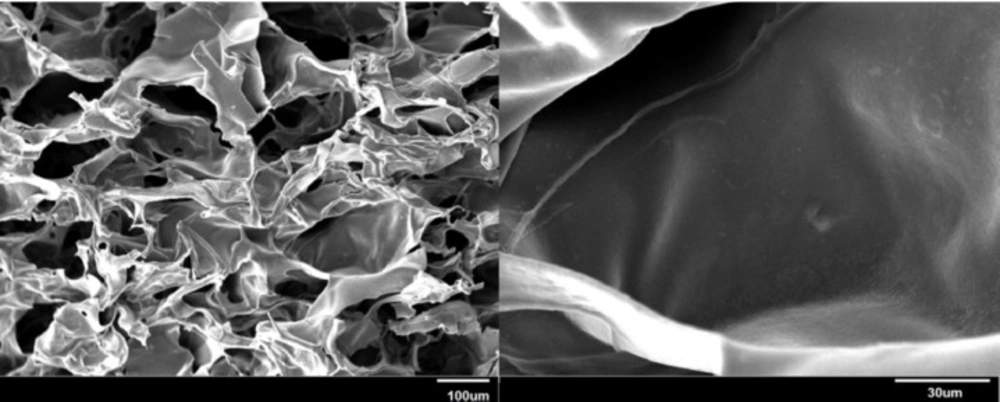
Interior morphology of hydrogel
Freeze-dried hydrogel was carefully fractured and the interior morphologies were visualized using a scanning electron microscope (SEM, JSM-6380).
Hydrogel swelling experiment
Lyophilized hydrogels with equal weights (n = 3) were immersed in PBS of pH 7.4 at 37 °C with 100 rpm agitation and the water sorption was followed by gravimetry. At predetermined time intervals, the hydrogels were removed, surface-dried with the absorbent paper, and immediately weighed (Wt). The swelling (%) was calculated as follows:
Swelling (%) = (Wt-Wd) /Wd × 100%
where, Wt is the weight of the swollen hydrogels at time t and Wd is the weight of the lyophilized hydrogels.
Hydrogel degradation experiment
In-vitro degradation of the scaffold was evaluated at 37 °C in PBS at pH 7.4 by determining the weight loss according to the following equation:
Degradation (%) = (Mi-Mt) /Mi×100%
where, Mt is the weight of the dry hydrogels at time t and Mi is the initial weight of the dry hydrogels.
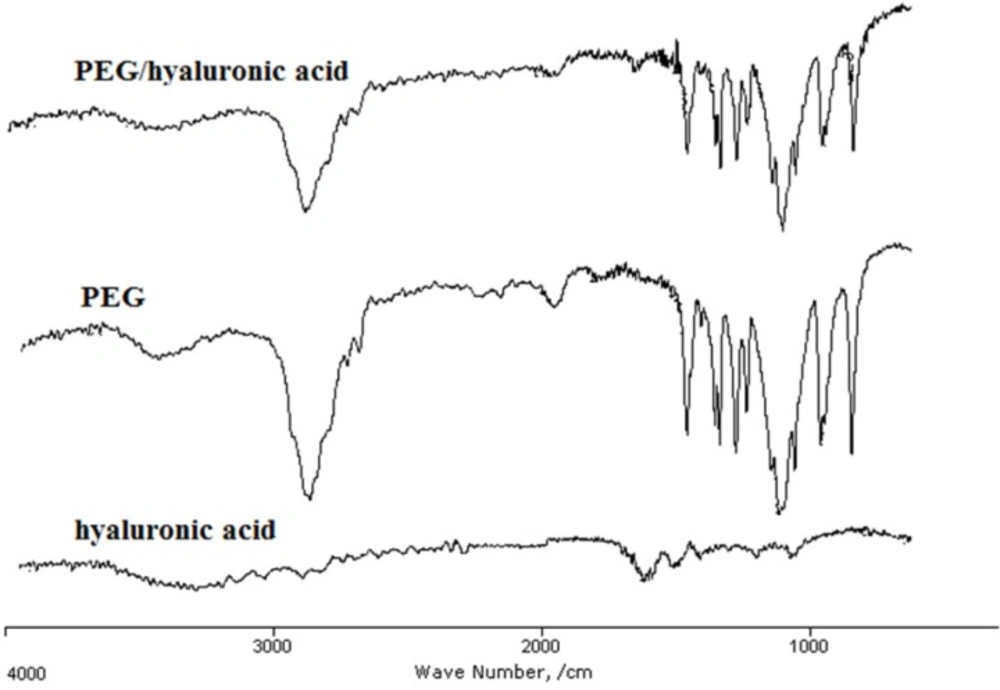
Infrared (IR) spectroscopy
The IR spectra of PEG, lyophilized hyaluronic acid, and PEG/ hyaluronic acid hydrogels were obtained using IR spectrometer (PerkinElmer 843). About 3 mg of the sample was mixed with KBr and the spectra were obtained in the wavenumber range of 4000–400 cm−1.
In-vitro IGF-1 release
IGF-1 loaded hydrogels were continuously stirred in PBS solution (pH 7.4) at 37 °C. At predetermined time points, the solutions were centrifuged at 10000 rpm for 5 min, and the amount of released IGF-1 was evaluated by ELISA.
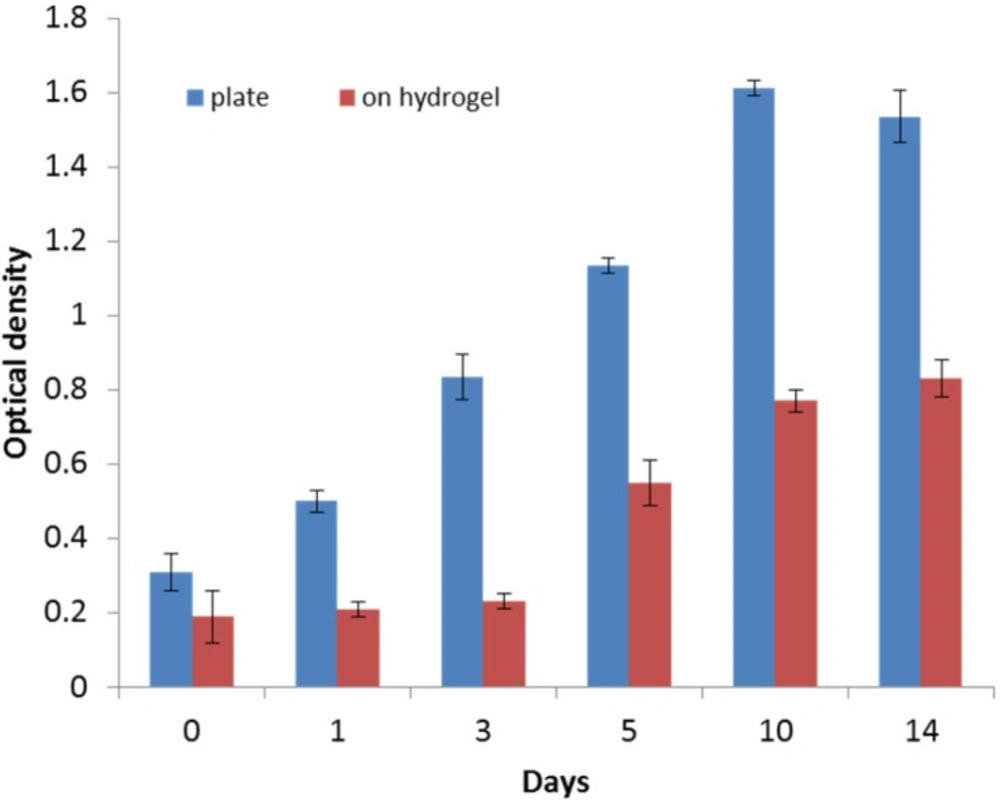
Cell viability
HWJMSCs viability was assessed with the 3-(4,5-dimethylthiazolyl-2)-2,5-diphenyltetrazolium bromide (MTT, Sigma) assay. The MTT absorbance was read at different time intervals (1, 3, 5, 10, and 14 days) at 570 nm with 650 nm as the background absorbance using an ELISA plate reader (Expert 96, Asys Hitch, Ec Austria) and normalized to the absorbance measured at the beginning of study.
MI Induction and HWJMSCs transplantation
Animals
Male New Zealand white rabbits weighing between 2.0 and 2.5 kg, purchased from Razi Institute (Karaj, Iran), were used for this study. The animals were individually housed under controlled temperature (23 ± 2 °C) and a 12-h light/dark cycle with free access to food and water. All the experiments were performed according to the policies of the Institutional Animal Care and Use Committee at Tehran University of Medical Sciences in accordance with the NIH Guide for the care and use of laboratory animals (NIH publications No.8023, revised 1987).
Cell preparation for transplantation
106 viable cells were injected intramyocardially into the infarcted region and its periphery at 4–5 sites (100 μL/point) using a 28G needle.
MI model and treatment groups
MI was induced by ligating the left coronary artery as previously described (
28). Briefly, the animals were anesthetized with intramuscular injections of ketamine (50 mg/kg) and xylazine (5 mg/kg), intubated, and mechanically ventilated. Under sterile conditions, the heart was exposed via a left thoracotomy incision and the left anterior descending coronary artery (LAD) was ligated proximally with a 5-0 silk (Ethicon Inc., USA) suture. After the surgery, the rabbits were treated with analgesics and antibiotics.
For proving MI, cardiac troponin T was measured before and one day after surgery. One hour after MI induction, the rabbits were randomly divided into 3 groups and were injected with: 1) PBS (control group); 2) HWJMSCs and empty hydrogel (Cells/hydrogel group); and 3) HWJMSCs and IGF-1 loaded hydrogel (Cells/hydrogel/IGF-1 group). Another 6 rabbits undergoing thoracotomy without coronary ligation were used as the sham group.
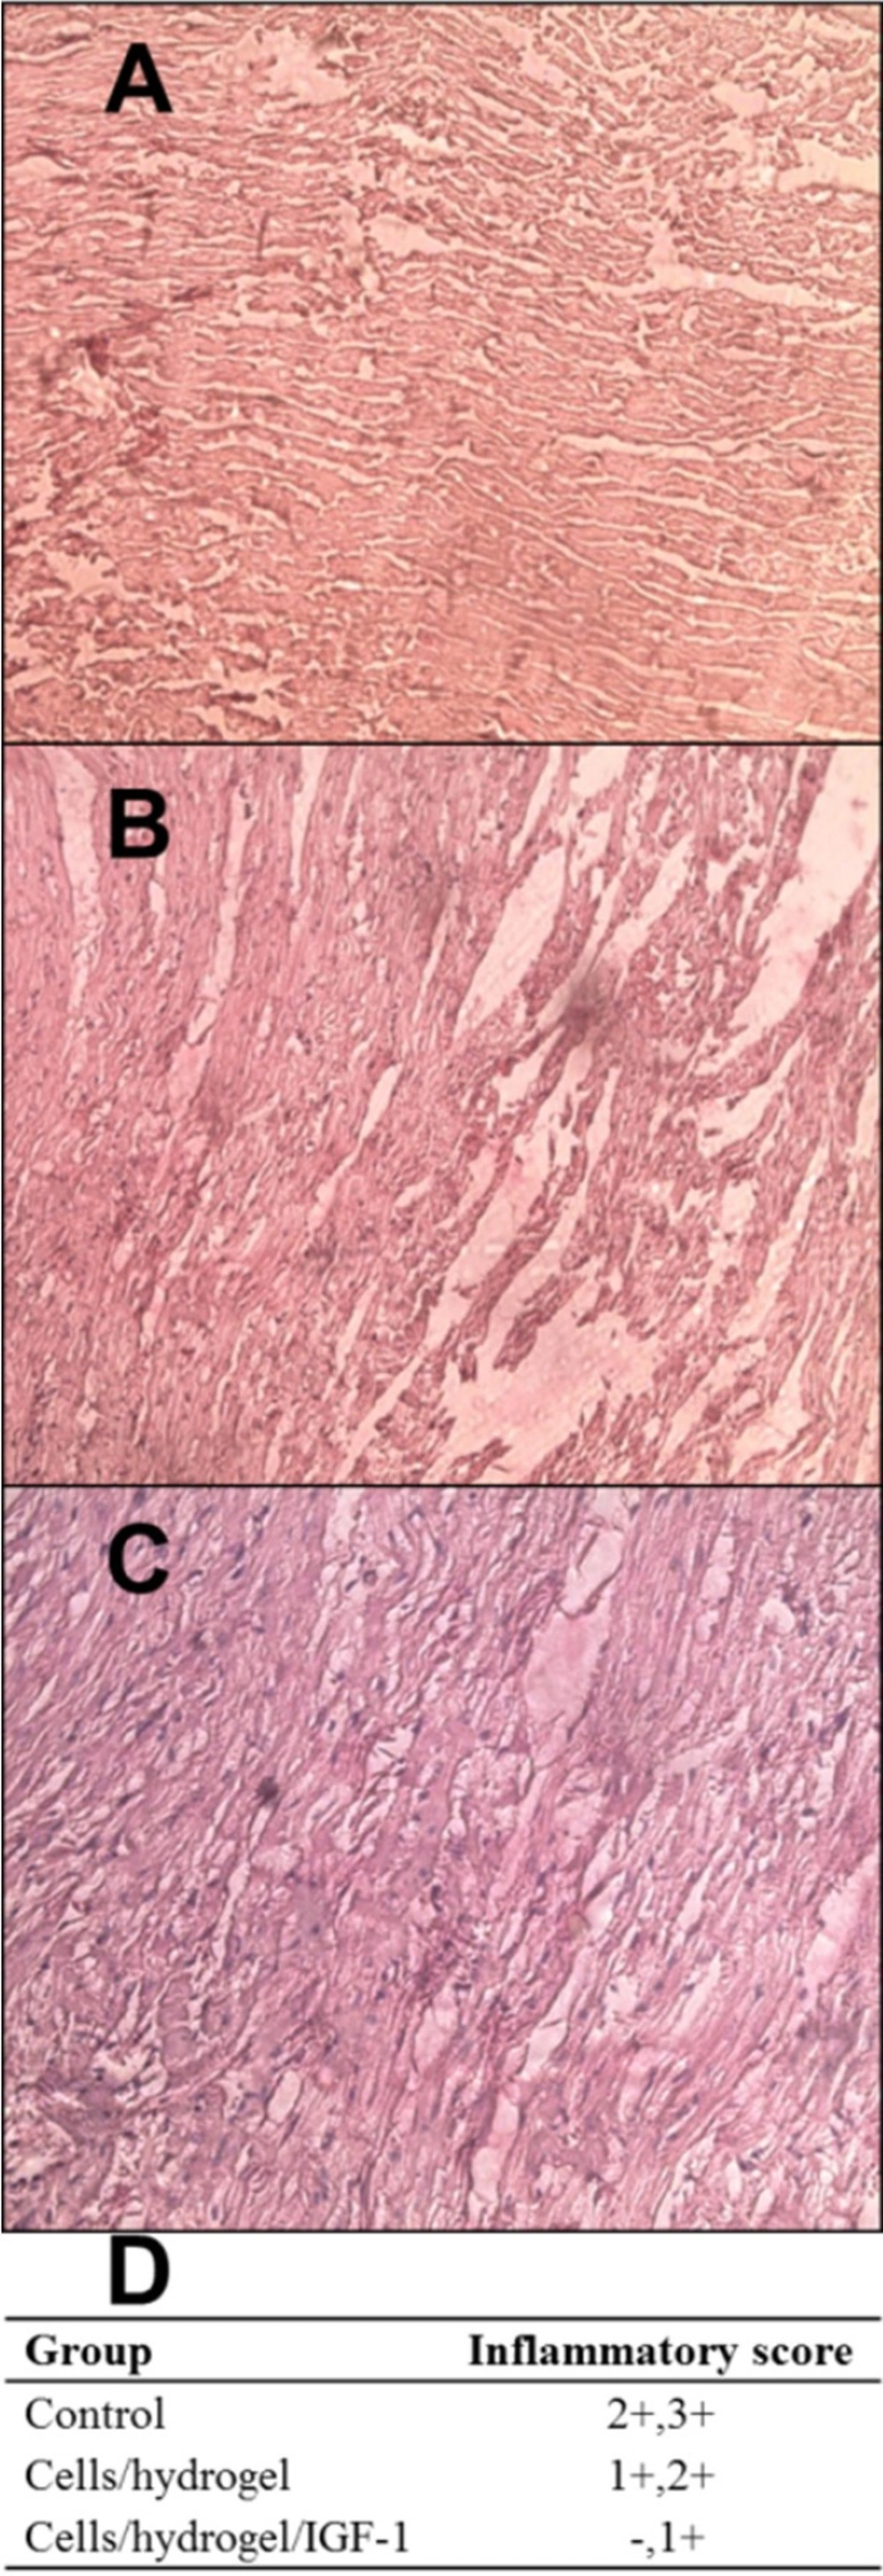
Histopathological analysis
Two months after injection, the animals were heparinized by intravenous injection of 500 U/kg and then sacrificed by an overdose of pentobarbital sodium. After heart removal and fixation in 10% buffered formalin, the left ventricle (LV) was sectioned into five equally spaced transverse slices from base to apex and paraffin-embedded. 6 µm thick serial sections were cut from each paraffin block and stained with hematoxylin-eosin (H&E). Inflammation was scored in a blinded fashion on a scale of 0–3.
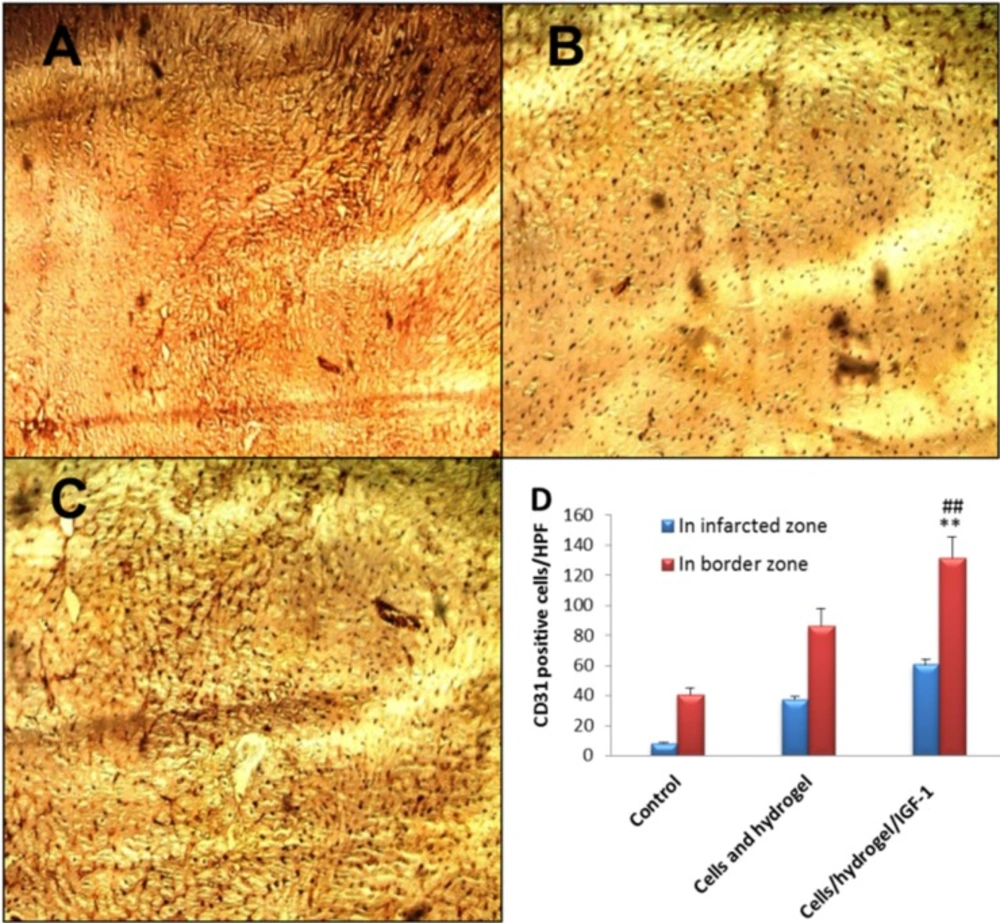
Immunohistochemical analysis
Immunohistochemical staining was carried out on the tissue sections based on the labeled streptavidin-biotin method. Monoclonal antibodies against CD31 (DAKO, 1:100) was used and then the sections were treated for 30 min at room temperature with streptABComplex/HRP (DAKO, 1:400) according to manufacturer’s instruction. Subsequently, the slides were counterstained with Mayerꞌs Hematoxylin solution and CD31-positive capillaries were counted as previously described (
29).
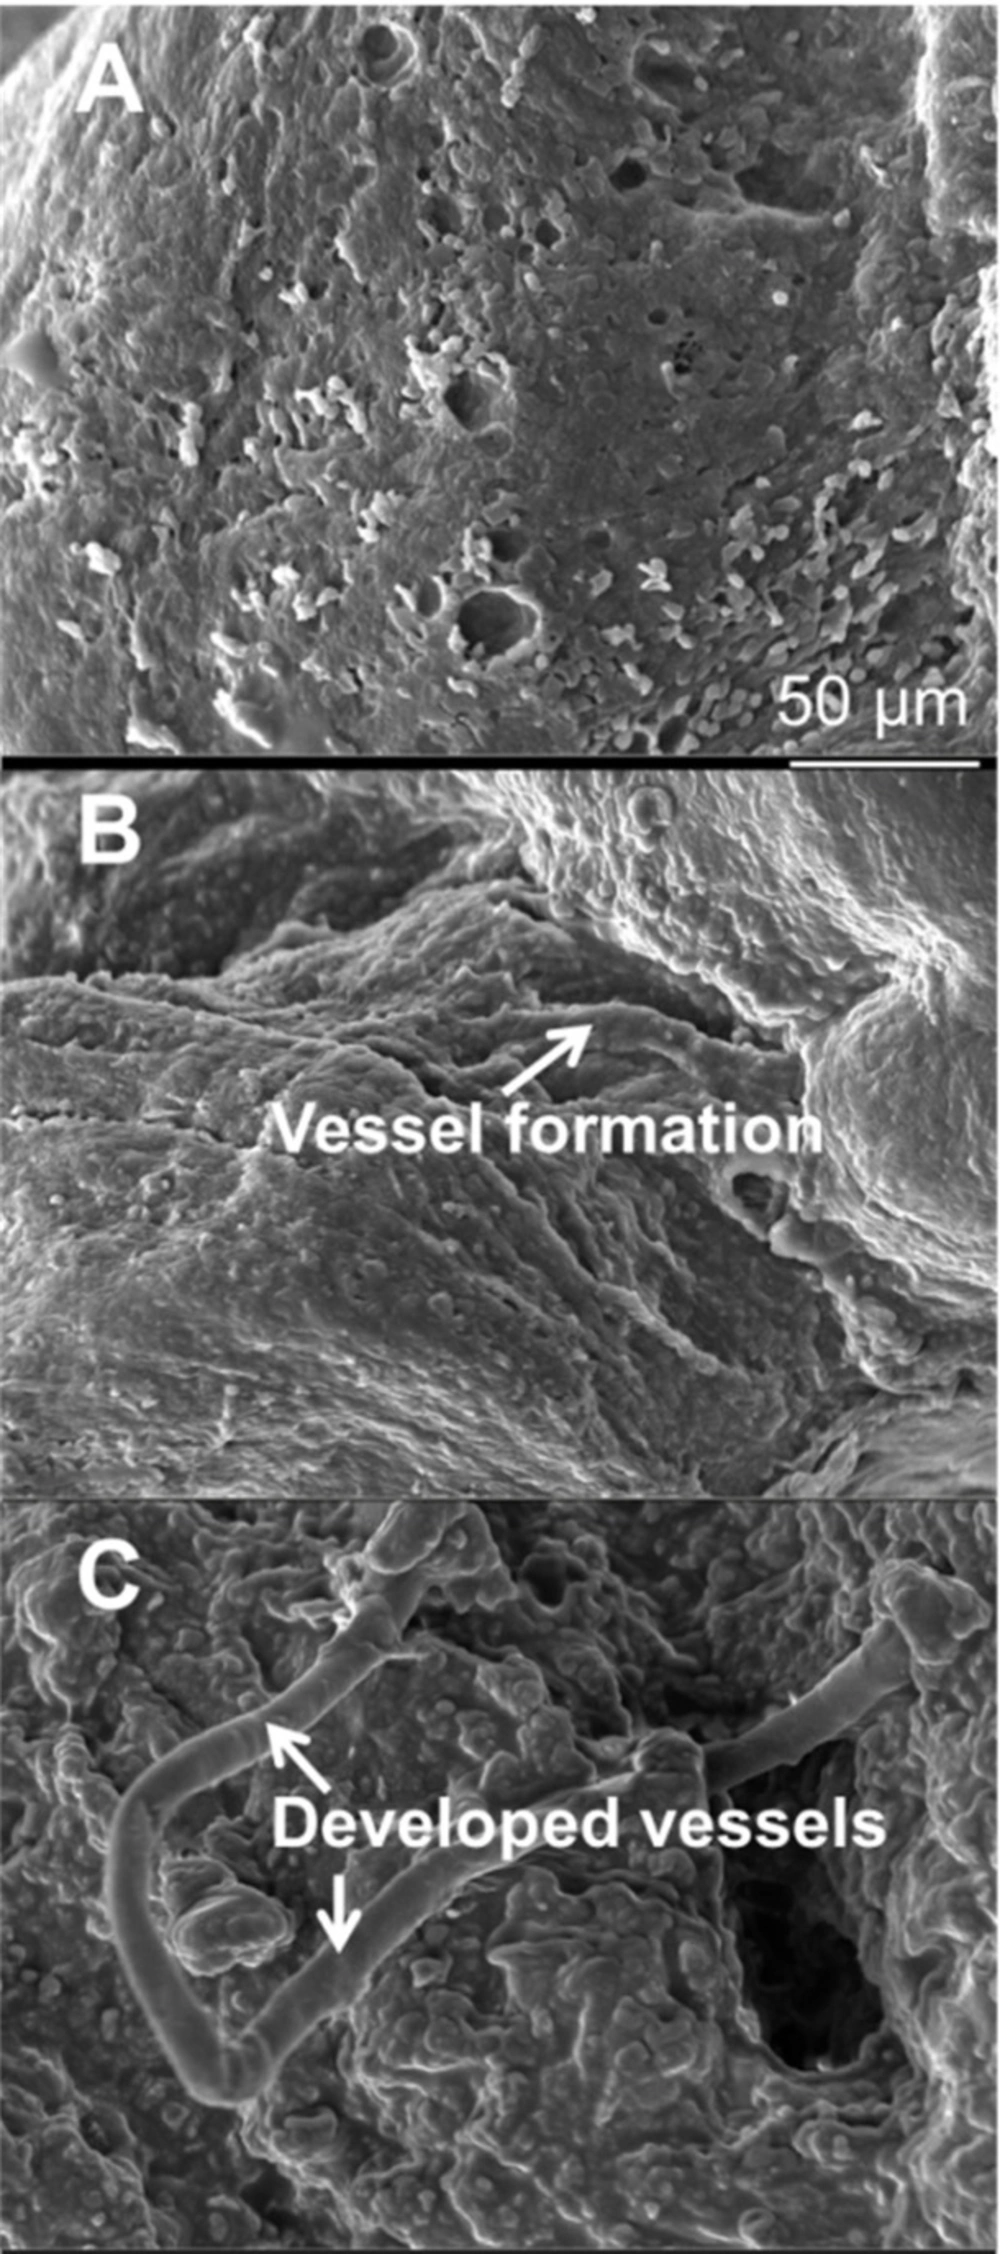
Electron microscopic study
Small proportions of infarcted anterior LV wall of each animal were removed immediately after scarification. Electron microscopic studies were performed on thin sections of glutaraldehyde-fixed cardiac tissues using JSM-6380 instrument to measure morphologically detectable injury.
Transthoracic echocardiography
Transthoracic two dimensional echocardiography was performed at baseline as well as 1 and 60 days post-MI under light sedation (ketamine/xylazine) using a General Electric Vivid3 machine echocardiographic device equipped with a 7.5 MHz transducer. Left ventricular end-diastolic and end-systolic internal diameters (LVIDD and LVISD, respectively) as well as end diastolic and systolic volumes (EDV and ESV, respectively) were assessed. Fractional shortening (FS), FS% = (LVIDD − LVISD)/LVIDD ×100, cardiac output (CO), CO= Heart rate × (EDV-ESV), and left ventricular ejection fraction (EF), EF = (EDV-ESV)/ EDV ×100, were calculated. Echocardiographic measurements were made by an echocardiography specialist in a blinded fashion.
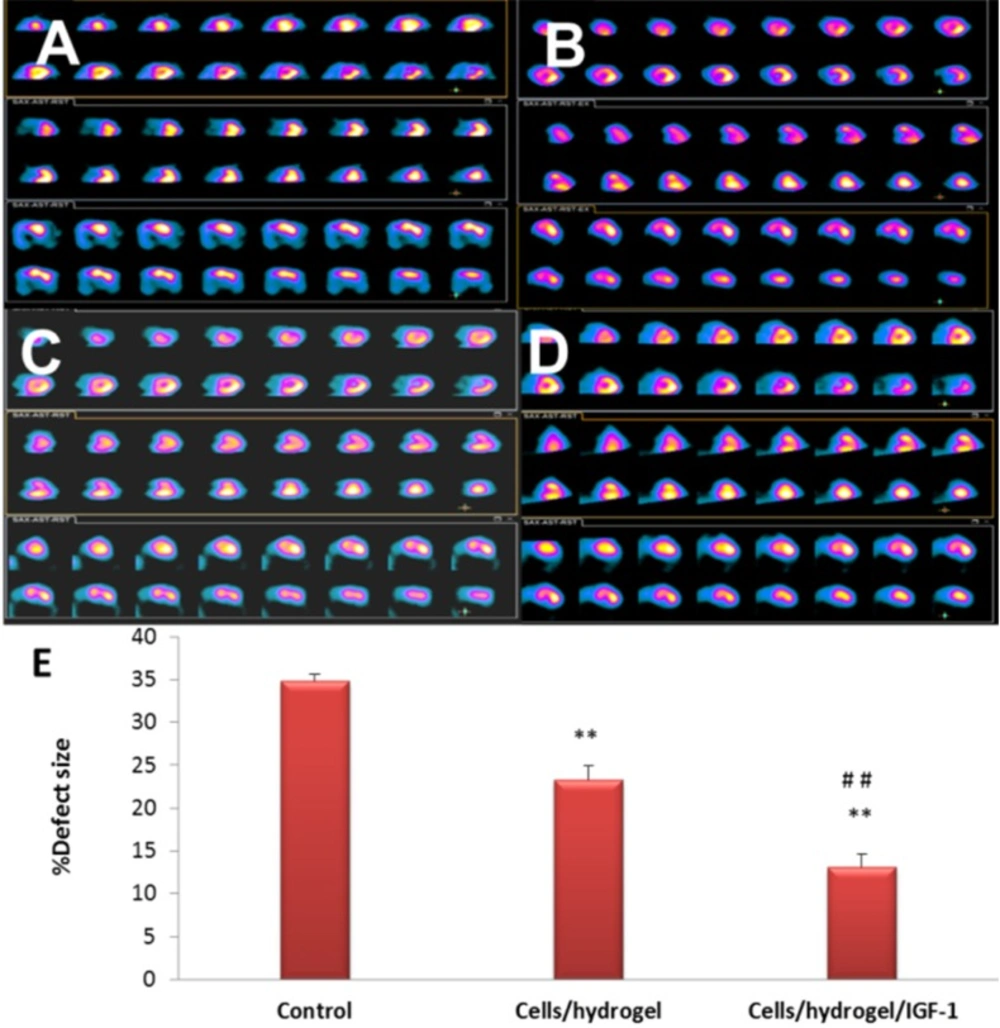
In-vivo single-photon emission computed tomography (SPECT) imaging
Under ketamine - xylazine anaesthesia, the animals were fixed in supine position at the center of the field of view of the SPECT camera. 99mTc (185 ± 37 MBq) was administered via an ear vein. SPECT images were acquired 5 min after radiotracer injection to decrease background activity. Image acquisition was done using dual head Philips bright view gamma camera (Milpitas, CA 95035) equipped with high resolution parallel hole collimators. Acquisition parameters were 64 projections over 360, 30 s per projection with a matrix size of 256×256. SPECT images were reconstructed with iterative method using 2×8 or 2×16 iterations and subsets.
Statistical analysis
All statistical analyses were performed using SPSS software 16.0 (SPSS Inc., Chicago, IL, USA). The data were expressed as mean ± standard deviation (SD) and analyzed by t-test (for pairwise comparisons) or one-way ANOVA (for multiple comparisons) and the results were considered significant at P < 0.05.