![Cover image of the article: Synthesis of Some Spiro Indeno[1,2-b]pyrido[2,3-d]Pyrimidine-5,3′-Indolines as New Urease Inhibitors](https://brieflands.com/journals/ijpr/articles/125079/figures/thumbnail.webp)
Introduction
Cancer is a leading cause of death worldwide, accounting for 7.6 million deaths (around 13% of all deaths) in 2008. Deaths from cancer worldwide are projected to continue rising, with an estimated 13.1 million deaths in 2030. Cancer causes 1 in 8 deaths worldwide and is rapidly becoming a global pandemic. According to the International Agency for Research on Cancer, there were 12.7 million new cancer cases in 2008. If rates don’t change, the global cancer burden is expected to nearly double to 21.4 million cases and 13.5 million deaths by 2030.
Urease is an enzyme which produces numerous amounts of ammonia in the Helicobacter pylori by catalysis the hydrolyzing of urea into carbon dioxide and ammonia. The produced ammonia makes the growth and survival of bacteria in highly acidic media of gastric wall, by increasing the pH of environment (1). Hence, urease activity plays an important role in gastric diseases, formation of kidney stones (2) and development of urolithiasis, pyelonephritis and hepatic encephalopathy (3) .
Discovering a new agent for inhibition of urease and potent anti-ulcer drugs are of special demand because H. pylori has become resistant to many antibiotics (4).
Pyridopyrimidine derivatives have received ample attention in pharmaceutical and agrochemical sectors (5) due to their prominent biological applications such as antibacterial (6), antiallergic (7), CNS stimulants (8), inhibitors of adenosine kinase enzyme (9) or dihydrofolate reductase inhibitors (10). Preparation of compounds with promising drug like activity without tedious and time consuming purification is in great interest.
Recently using new catalysts opened exciting opportunities in the field of synthesizing medicinal compounds or green chemistry by minimizing waste, cost, and time (11). The catalytic systems offer the opportunity of synthesizing molecules via novel routes, which may be difficult or impossible with traditional methods and also increase the yield of the resultant compounds.
Experimental
GC-Mass analysis was performed on a GC-Mass model: 5973 network mass selective detector, GC 6890 Agilent. IR spectra were recorded from KBr disk using a FT-IR Bruker Tensor 27 instrument. Melting points were measured using the capillary tube method with an electro thermal 9200 apparatus. The 1H NMR (400 MHz) was run on a Bruker DPX, 250 MHz.
Synthesis of the catalyst
The biacidic carbon catalyst is prepared as the following procedure (15). The mixture of glucose (10 g), citric acid (5 g), hydroxyethylsulfonic acid (3 g), and deionized water (80 mL) was placed in a 100 mL Teflon-lined stainless steel autoclave, which was heated in an oven at 180 °C for 4 h. The resulting products were filtered, washed with water and methanol, and dried in a vacuum oven at 100 °C for 4 h to give biacidic carbonaceous material (2.3 g) as a black powder.
General procedure for preparation of Spiro pyridopyrimidine-indolines 4a-e
A mixture of 1,3-indandione (1 mmol), 6-aminouracil (1 mmol), isatin derivatives (1 mmol) and catalytic amount of biacidic carbon (20 mg) in ethanol (5 mL) was refluxed for appropriate time (Table 2). After the completion of reaction as indicated by TLC, the catalyst was recovered by filtering and washing with acetone, and then dried in an oven at 80 °C for about 1 h followed by crystallization using ethanol and water.
5'-Chloro-1H-spiro[indeno[1,2-b] pyrido [2,3-d]pyrimidine-5,3'-indoline]-2,2',4,6 (3'H,10'H)-tetraone (4d)
Orange powder, Mp 315-319 °C, IR (KBr) (νmax /cm-1): 3549, 2800, 1720, 1701, 1666, 1617. MS, m/z: 418 (M+), 341, 293, 271, 255, 243, 229, 195, 161, 75, 51. 1H NMR (400 MHz, DMSO-d6): δH (ppm) 6.77-7.96 (7H, m, H-Ar), 10.55-10.58 (3H, s, 3NH), 10.99 (1H, s, NH).
8',8'-Dimethyl-8',9'-dihydro-1'H-spiro [indoline-3,5'-pyrimido[4,5-b]quinoline]-2,2',4', 6'(3'H,7'H,10'H)-tetraone (7a)
Pale orange powder, Mp 310-312 °C, IR (KBr) (νmax /cm-1): 3402, 3126, 2955, 1720, 1673, 1613, 1400. MS, m/z: 378 (M+), 320, 308, 307, 292. 1H NMR (400 MHz, DMSO-d6): δH (ppm) 1.06 (6H, 2CH3), 6.72-7.44 (4H, m, H-Ar), 8.88 (1H, s, NH), 10.11 (2H, s, 2NH), 10.29 (1H, s, NH).
1'H-spiro[indoline-3,5'-pyrido[2,3-d:6,5-d']dipyrimidine-2,2',4',6',8'(3'H,7'H,9'H,10'H)-pentaone (7b)
Pale orange powder, Mp 333-334 °C, IR (KBr) (νmax /cm-1): 3435, 3200, 2806, 1732, 1649, 1546. MS, m/z: 366 (M+), 352, 295, 283, 252, 43. 1H NMR (400 MHz, DMSO-d6): δH (ppm) 6.18-7.17 (4H, dd, H-Ar), 7.95 (1H, s, NH), 9.09 (1H, s, NH), 10.08 (1H, s, NH), 10.60 (1H, s, NH).
1′,3′-Dimethyl-1'H-spiro[indoline-3,5'-pyrido[2,3-d:6,5-d']dipyrimidine- 2,2',4',6',8' (3'H,7'H,9'H,10'H)-pentaone (7c)
Pale orange powder, Mp 327-330 °C, IR (KBr) (νmax /cm-1): 3489, 3184, 1772, 1702, 1664, 1501. MS, m/z: 394 (M+), 367, 352, 284. 1H NMR (400 MHz, DMSO-d6): δH (ppm) 3.09 (3H, s, CH3), 3.37 (3H, s, CH3), 6.82-7.28 (4H, dd, H-Ar), 9.32 (1H, s, NH), 10.46 (1H, s, NH), 11.06 (1H, s, NH), 11.95 (1H, s, NH).
Urease inhibition assay
In this work, the total released ammonia from urease activity has been determined by the Berthelot colorimetric method (16). In brief, solution composed of 800 µL urea as substrate and 15 µL enzyme and inhibitors with various concentrations were incubated in water bath at 37 ºC for 30 minutes. Fresh phenol solution (solution A) was prepared by dissolving 1000 mg of phenol and 7 mg of sodium nitroprusside in 100 mL of deionized water and fresh solution B was prepared by dissolving 500 mg sodium hydroxide pellets and adding 840 µL of sodium hypochlorite solution (11-14%) to 100 mL of water. 100 µL sample from incubated solution was transferred to microplate well and followed by adding 500 µL of solution A and B. The mixture was stirred and kept at 37 ºC for 30 minutes. After that, the plate was read at 625 nm using the Biotech Synergy H1 micropalte reader. All experiments were performed in triplicate.
Docking simulation procedure
All of the processes include of preparation of input files (receptor and ligand preparation) and docking parameters were similar to our previous study (17). Briefly, to validate observed activity, molecular docking was performed using Auto Dock 4.2 using Lamarckian genetic algorithm (18) on PDB structure 3LA4 (http://rcsb.org) with resolution of 2 Ǻ using default docking parameters values. The graphical user interface Auto Dock Tools 1.4.5 (19) was employed to set up the enzyme and ligand input files as reported previously (20). Ligand Scout 3.0 program was used for demonstration ligand-enzyme interaction (21). Inhibitor has sketched by Marvin sketch applet (Marvin package, Chemaxon Company).
Results and DiscussionChemistry
The titled compounds were synthesized in a mild, convenient and simple procedure using a three-component reaction (Scheme 1). In this method indandione 1, various isatin 2a-e and 6-aminouracil 3 were mixed and refluxed in ethanol for a short periods of time (10-30 min, Table 1) in presence of nano biacidic carbon catalyst yielding pyridopyrimidine derivatives 4a-e (Table 2) in high yields (Figure 1, Table 2).
![Synthesis of spiro indeno[1,2-<i>b</i>]pyrido[2,3-<i>d</i>] pyrimidine-5,3′-indolines using biacidic carbon as catalyst](https://brieflands.com/journals/ijpr/articles/125079/figures/ijpr-15-055-g001-preview.webp)
Scheme 1
Synthesis of spiro indeno[1,2-b]pyrido[2,3-d] pyrimidine-5,3′-indolines using biacidic carbon as catalyst
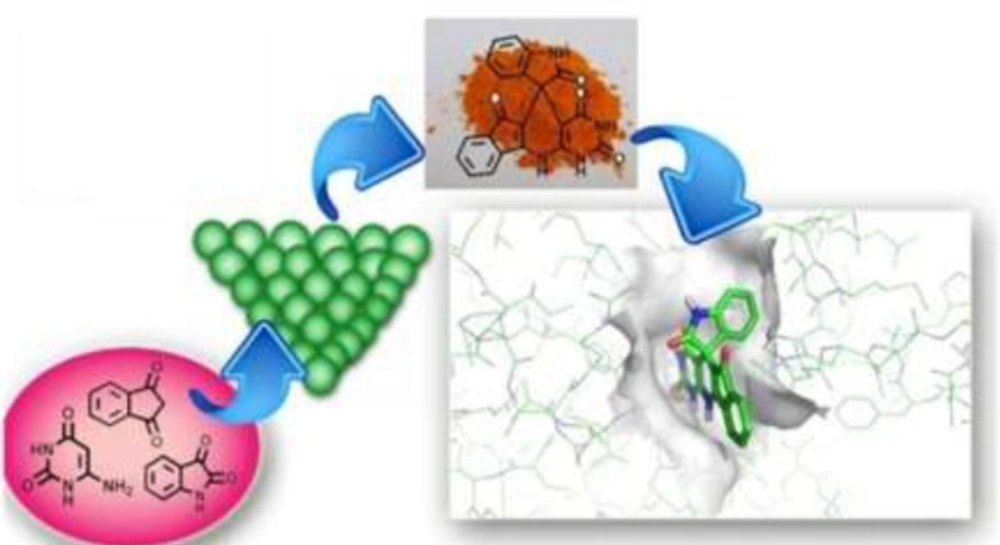
Figure 1
Biacidic carbon catalyzed the synthesis of spiro pyridopyrimidine
To optimize the reaction procedure, different conditions were applied as shown in Table 1. The best results were obtained under a solvent-free condition at 130 °C (Table 1, entry 5) in EtOH as a solvent (Table 1, entry 1) and used for preparation of other derivatives.
Table 1
Optimization of the reaction conditions in the synthesis of 4a using biacidic carbon as catalyst.
| Entry | Solvent | Temperature (°C) | Time (min) | Yield (%) | ||
|---|---|---|---|---|---|---|
| 1 | EtOH | Reflux | 20 | 91 | ||
| 2 | H2O | Reflux | 60 | 70 | ||
| 3 | CH3CN | 100 | 400 | 71 | ||
| 4 | neat | 80 | 60 | 91 | ||
| 5 | neat | 130 | 30 | 96 | ||
With these optimized conditions, the scope of the reaction was inspected using various isatin as the acceptors. As can be seen from the data reported in Table 2, the use of 5-chloroisatin, resulted in improved condensation yield (95%) but the yield could be decrease by using other isatin derivatives such as N-benzylisatin, 5-bromoistain and N-methylisatin (70-76%). It’s noteworthy that in the all following cases the reaction is carried out in a very short reaction time (10-30 min).
Table 2
Synthesis of 4 catalyzed by biacidic carbon
| Entry | R | X | Product | Time (min) | Yield (%) |
|---|---|---|---|---|---|
| 1 | H | H | 4a | 20 | 91 |
| 2 | Me | H | 4b | 30 | 70 |
| 3 | Bn | H | 4c | 30 | 76 |
| 4 | H | Cl | 4d | 10 | 95 |
| 5 | H | Br | 4e | 10 | 73 |
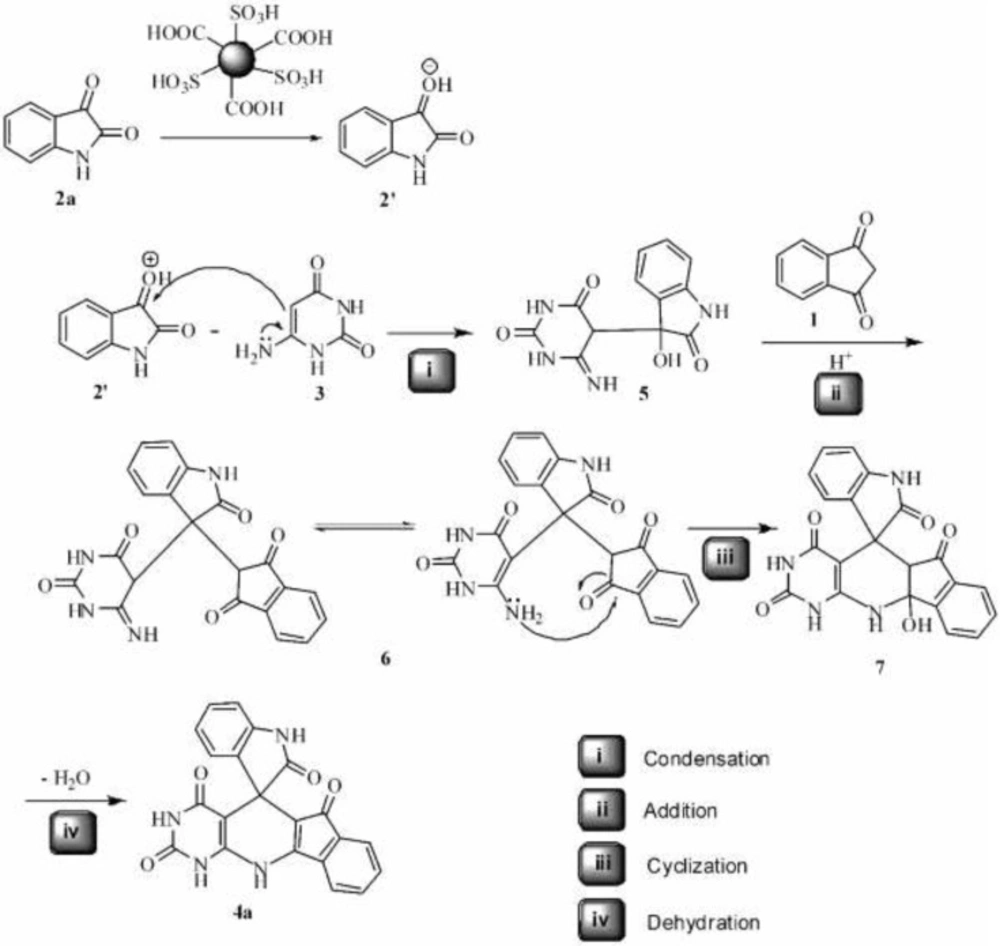
The mechanism of the reaction and formation of compound 4a can be explained by the condensation, addition, cyclization and dehydration reactions which illustrated in Scheme 2. First, according to acidic property of the catalyst, the carbonyl group of isatin 2a was protonated, which then condenses with enamine group of 6-aminouracil 3 to afford 5. The addition of 5 and indandione then furnished the intermediate 6. The cyclization of 6 gives product 4a after dehydration of intermediate 7.
Scheme 2
The proposed reaction mechanism
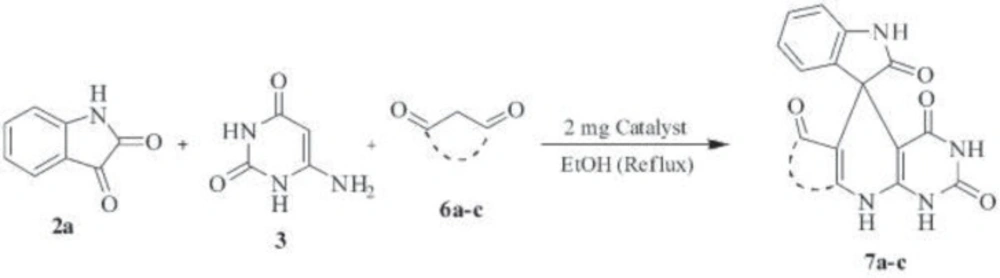
This method also works well for the other β-diketone compounds 6a-c instead of indandione under the similar reaction condition (Scheme 3). The desired products 7a-c were obtained in good to excellent yields (50-90%) and at the moderate reaction times (3-4 h) as shown in Table 3.
Scheme 3
Extension of this method using different β-diketones in the optimized conditions
Table 3
Exploration of the reaction scope in relation to the β-diketone components using biacidic carbon as catalyst
Biological activity
All synthetic compounds were tested against urease inhibitory activity (Table 4) and shows good urease inhibitory potency in the range of IC50= 1.94-14.46 µM in comparison to hydroxyurea as a standard inhibitor (µM). To confirm obtained results and extract a preliminary structure activity relationships various parameters such as log P, MR, CLog P and CMR were calculated (Table 4) using ChemOffice packages (www. cambridgesoft.com). On the other hand, the docking studies were applied for all synthesis compounds (4a-7c).
Correlation between urease inhibitory activity and physiochemical properties of tested compounds reveals that compounds with lipophilicity values in the range of Log P = - 0.44 to 0.61, shows good urease inhibitory potency (Table 4). Based on this deduction, compound 7b with lipophilic character was less active than 4a (Table 4). On the other hand, molar refractivity (MR) which mentioned in Table 4, has a prominent influence on the activity whereas the compound 4c with MR= 131.16 hasn’t any inhibition activity because it couldn’t provide a good interaction with the active site.
According to our previous studies, the compounds with methyl bearing substitute on the barbituric acid ring not only haven’t inhibitory activity but also activate the urease enzyme (22). This rule is shown in compound 7c which hasn’t any urease inhibition activity. This could be explained by existence of two barbiturate rings in its structure, which one of barbiturate acts as an activator and the other is inhibitor thus results inactivation of compound. Meanwhile, the compound 7b which hasn’t any substitution on the barbiturate ring shows the inhibitory potency with IC50= 14.46 µM. In compound 7a compares to 4a the indenone ring is replaced by 5,5-dimethylcyclohex-2-enone and this replacement hasn’t any significant changes to the inhibitory activity (IC50 4a/7a is 1.94/2.81). Changing the substitution on the oxindole ring also causes considerable alteration in the inhibitory activity since the replacement of H in 4a with halogen (5-Cl and 5-Br, 4d and 4e, respectively) decreases the inhibitory activity as a result of the steric hindrance or increase in lipophilicity due to size of halogen groups.
Table 4
Urease inhbitory activity of spiro pyridopyrimidine compounds
Our results reveal that changing the substitution on nitrogen atom of oxindole ring alters the inhibition value for instance conversion of NH to N-Me (4b) causes to decrease activity and conversion of NH to N-Bn (4c) causes the totally abolishing of the inhibition. It seems that hydrogen binding ability of nitrogen of isatin rings is necessary for higher activity and increasing the sizes of substituted groups will decreases binding of molecule to active site. These properties have been reported narcotic antagonist and agonist previously (23).
Docking studies
Herein, the molecular docking was used in order to predict the orientation of spiro indeno[1,2-b]pyrido[2,3-d]pyrimidine-5,3′-indolines family in the urease binding pocket. In this way, the most potent compound 4a was used as the family symbol. Figure 2A represents the binding pose of 4a in the active site. The planner structure of this ligand lets it to sit deeply inside of active site cleft. Moreover, the suitable positions of chemical groups led to favorable interactions with the receptor. One of the carbonyl group in the barbituric ring formed a HBA with Met637. The other carbonyl moiety comprises a HBA with His545 alongside a weak ionic interaction with the Ni2+ atom. The two nitrogen atoms in the barbituric ring donate their hydrogen atoms in hydrogen bonds with His492 and Asp633 residues. Thus, the barbituric cycle which is included in all synthesized compounds is responsible for four hydrogen bonds with urease protein. Besides, the hydrogen of nitrogen atom in 9 position of the ligand is involved a HBD toward Asp494. The last hydrogen bond is seen between CME592 and carbonyl group connected to the cyclopentadiene moiety. In addition, 4a can be more stabilized due to presence of π-π interaction with His593.
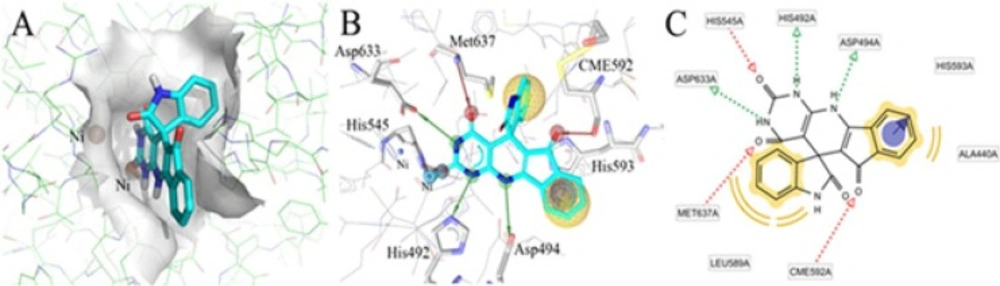
Figure 2
Optimal binding model for compound 4a into active site of Jack-bean urease enzyme docked by Autodock 4.2 (A), interaction of ligand with key residues are shown in 3D and 2D models (B, C). The yellow sphere indicates hydrophobic region, the red line shows hydrogen bond acceptor, the green line point out hydrogen bond donor features and purple cycle is π-π interaction
Conclusions
As a conclusion the spiro indenopyridopyrimidine derivatives are valuable compounds which show inhibition potency through urease and offer the opportunity of synthesizing the new molecules of this group. In the continuous of other studies by this investigation the key role of barbiturate ring in preparation of inhibitory potent compounds was either confirmed.