
Introduction
Experimental
| mRNA expression | Forward primer | Reverse primer | PCR cycles and annealing conditions |
|---|---|---|---|
| PEPCK | 5‘-TTTACTGGGAAGGCATCGAT- 3' | 5-TCGTAGACAAGGGGGCAC-3' | 30 cycles, 52°C for 1 min |
| GLUT-2 | 5'-AAGGATCAAAGCCATGTTGG-3' | 5'-GGAGACCTTCTGCTCAGTGG-3' | 30 cycles, 55°C 1 min |
| LPL (269 bp) | 5'-CCTGATGACGCTGATTTTGT-3' | 5’-AGGCAAGCTGGTGAGGATCTG-3' | 24 cycles, 60°C for 45 sec |
| Leptin (244bp) | 5-'CCTGTGGCTTTGGTCCTATCTG-3’ | 5'-TATGCTTTGCTGGGGTTTTC-3' | 35 cycles, 61°C for 1 min |
| Adiponectin (500 bp) | 5'-CTCCACCCAAGGAAACTTGT-3' | 5'-CTGGTCCACATTTTTTTCCT-3' | 35 cycles, 59°C for 1 min |
| PPAR-(550 bp) | 5’-CATTTCTGCTCCACACTATGAA-3' | 5'-CGGGAAGGACTTTATGTATGAG-3' | 35 cycles 51°C for 1 min |
| GAPDH | 5'-AGATCCACAACGGATACATT-3' | 5-TCCCTCAAGATTGTCAGCAA-3’ | 25 cycles, 52 °C 1 min |
Results
| Insulin resistance | Control | Diabetic + Origanum | |
|---|---|---|---|
| Glucose (mg/dL) | 178.6± 6.1* | 93.3± 3.8 | 123.3± 32.01# |
| Insulin (IU/L) | 7.3± 0.28* | 2.3± 0.4 | 4.02± 0.15# |
| Cholesterol (mg/dL) | 190.6± 4.4* | 118.7± 2.9 | 145± 12.2# |
| Triglacylglycerols (mg/dL) | 195.3± 10.5* | 98.3± 6 | 150± 13.2# |
| LDL (mg/dL) | 128± 9.6* | 64.4.6± 4.4 | 84.7± 4.35 |
| VLDL (mg/dL) | 38.9± 2.1* | 19.6± 2.2 | 30.3± 1.8 |
| HDL (mg/dL) | 23.6± 2.1* | 34± 1.01 | 30.6± 0.9 |
| Cholesterol ratio | 8.07%* | 3.49% | 4.8%# |
[object Object]
[object Object]
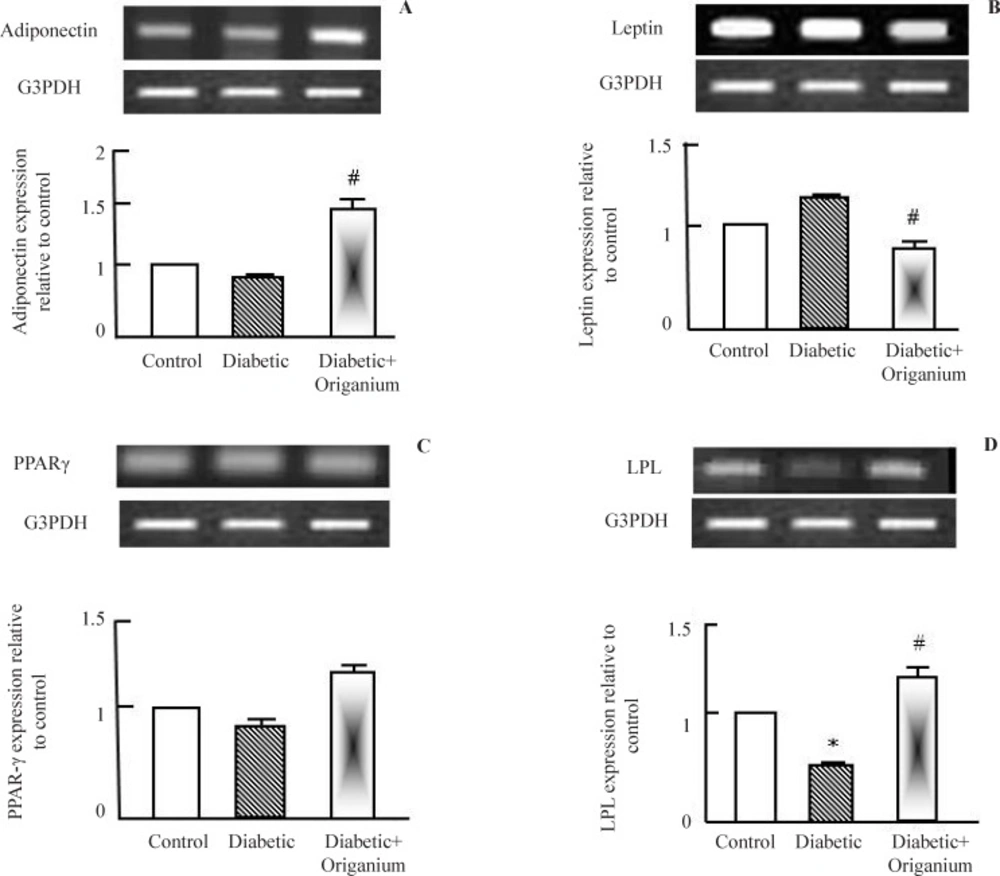
RT-PCR analysis of adiponectin, leptin. PARAR-γ and LPL expression after Origanum extract administration to type 2 diabetic Wistar rats for 2 weeks. RNA was extracted and reverse transcribed (2 μg) and RT-PCR analysis was carried for adiponectin, leptin. PARAR-γ and LPL genes. Densitometric analysis was carried for results from 5 different rats. *p<0.05 Vs control while # p<0.05 Vs diabetic group
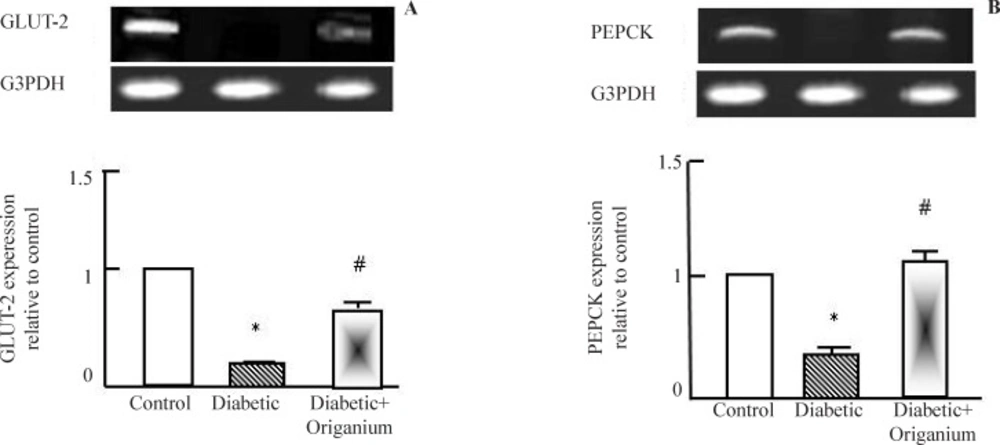
RT-PCR analysis of GLUT-2 and PEPCK expression after Origanum extract administration to type 2 diabetic Wistar rats for 2 weeks. RNA was extracted and reverse transcribed (2 μg) and RT-PCR analysis was carried for adiponectin, leptin. PARAR-γ and LPL genes. Densitometric analysis was carried for results from 5 different rats. *p<0.05 Vs control while # p<0.05 Vs diabetic group
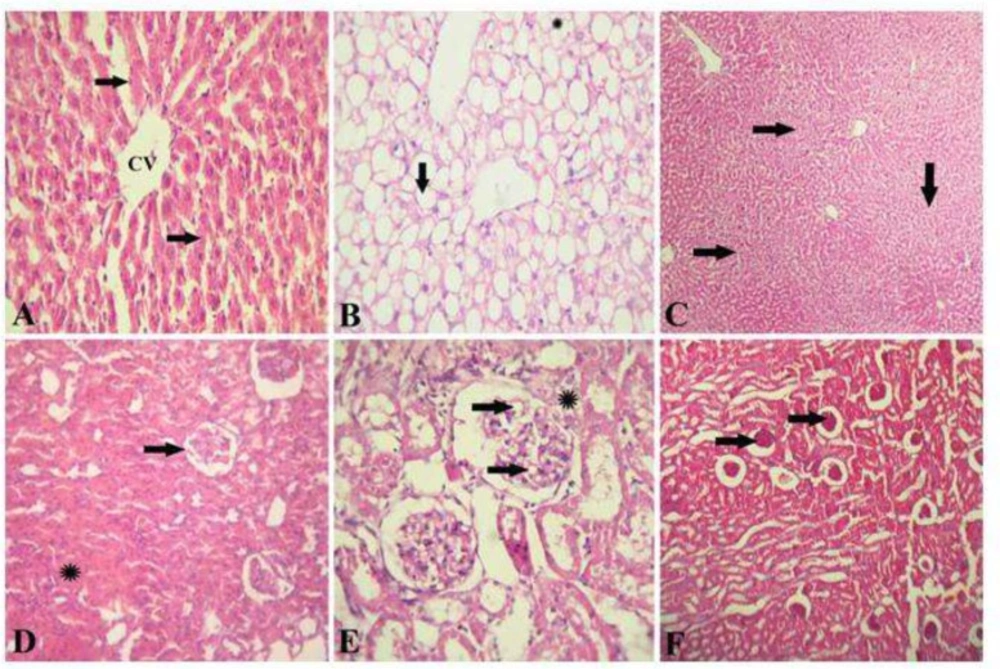
Hepatic and renal histopathology after Origanum extract administration. A, Photomicrograph of the liver of healthy control rat stained with H&E showing a normal hepatic architecture represented by hepatic lobule with a thin walled central vein (CV), hepatic cords (arrows) radiating towards the periphery alternating with hepatic sinusoids. (H&E x 300). B, photomicrograph of the liver of diabetic rats stained with H&E showed a signet-ring appearance of hepatocytes due to massive accumulation of fat extensively replacing the hepatic cytoplasm (arrow), or appearing as multiple small fat droplets (*). (H&E x 300). C, photomicrograph of the liver of diabetic rats treated with OM stained with H&E showing restoration of normal hepatic architecture with disappearance of fat droplets from hepatocytes cytoplasm and regeneration of hepatic parenchyma (H&E x 150). D, photomicrograph of the kidney of healthy control rat stained with H&E showed a normal renal architecture represented by normal glomeruli (arrow) and tubules (*). (H&E x 300). E, photomicrograph of the kidney of diabetic rats showing foamy lipid-containing mesangial cells expanding the glomerulus (arrows), the Bowman's capsule is moderately thickened forming synechia (*). (H&E x 1500). F, photomicrograph of the kidney of diabetic rat treated with OM stained with H&E showing restoration of normal renal architecture with disappearance of fat droplets from the glomeruli (arrows) (H&E x 150
