Materials
Poly-ɛ-caprolactan (PCL, Mw = 80KDa), gelatin (from porcine skin), dimethyl formamide (DMF), chloroform, MTT(3[4,5-dimethylthiazol-2-yl]-2,5-diphenyltetrazolium bromide), tripolyphosphate (TPP), chitosan (medium molecular weight), acetic acid, and glutaraldehyde andphosphate buffered saline (PBS) were all obtained from Sigma-Aldrich. Bovine serum albumin (BSA) was purchased from Merck. Dexamethasone sodium phosphate (DEXP) was obtained from Iran Hormone company. Trypsin, fetal bovine serum (FBS), Dulbecco’s modified Eagle’s medium/nutrient mixture F12 (DMEM/F12), and penicillin–streptomycin solution were obtained from GIPCO Invitrogen.
Dexamethasone-loaded chitosan nanoparticles preparation
The ionic interactions between positive amine groups of chitosan and negative phosphate groups of TPP result in the formation of chitosan nanoparticles. The process of chitosan nanoparticle formation was based on our previous work with minor modification (
17). Chitosan was dissolved in acetic acid (1% v/v ) to obtain 1.7 mg/ml chitosan solution.
The pH of the chitosan solution was adjusted to 5.5. Dexamethasone sodium phosphate (DEXP) and BSA solution were mixed thoroughly with BSA/DEXP weight ratio of 4:5. Next, BSA-DEXP solution was added to chitosan solution with final BSA concentration of 0.2 mg/ml and final DEXP concentration of 0.25 mg/mL 12 mL of TPP solution was added to DEX-BSA-chitosan solution under 500 rpm stirring for 60 min. The nanoparticles were collected by 15000 rpm centrifuge at 4℃ for 60 min. Then, the nanoparticles were redispersed into DMF. Final solution was sonicated for 10 min to make a homogenous solution.
Electrospinning procedure
1.2 gr of PCL was dissolved in 6 ml chloroform and 3ml of DMF under mild stirring for 2 h. 1mL of 3% (w/v) nanoparticle in DMF was added to PCL solution. 200 µL of tween-80 was also added to solution to create efficient binding between hydrophobic PCL and hydrophilic chitosan. To analyze the effect of chitosan nanoparticles on the DEXP release, the same amount of DEXP present in DEXP-BSA loaded chitosan nanoparticles was added to PCL solution (56 mg/mL DEXP) and electrospinning process was carried out. To prepare gelatin solution for electrospinning, 2.5 gr of gelatin was dissolved in 40% (v/v) acetic acid to get 25% (w/v) gelatin solution.
To fabricate nanofiber scaffold,co-electrospinning technique was used with a Nano Model (Tehran, Iran) setup. 5mL syringe was filled with PCL or PCL solution containing DEXP-loaded chitosan nanoparticles and gelatin solutions. The flow rate of PCL and gelatin solutions was maintained at 0.5 mL/h. For gelatin solution, the applied voltage at the tip of syringe needle and the distance between needle and collector were 23 Kv and 15 cm, respectively. For PCL solution containing DEXP-loaded chitosan nanoparticles, the applied voltage at the tip of syringe needle and the distance between needle and collector were 16 kV and 17 cm, respectively. The speed of collector was fixed at 300 rpm.Air-dried composite nanofibers on the aluminum foil was placed in sealed desiccator including 10 mL aqueous glutaraldehyde solution with 25% (w/v) concentration for 24 h and crosslinking reaction took place in saturated glutaraldehyde vapor (
18).
Characterization
Particle size and size distribution of chitosan nanoparticles
The suspension of nanoparticles was diluted to appropriate concentration with water, and test was done by dynamic light scattering (DLS method using a Zetasizer Nano S (Red badge) (Malvern Instruments, UK) to determine the size and size distribution of chitosan nanoparticles prepared by ionic gelation method. Triplicate samples were analyzed and the arithmetic mean value of the three was adopted.
Drug loading and loading capacity analysis
After preparation of DEXP-BSA loaded chitosan nanoparticles, nanoparticles were collected by 15000 rpm centrifuge at 4℃ for 60 min. After centrifugation, nanoparticles were settled from chitosan nanoparticle suspension, and the supernatant was collected. Drug concentration in supernatant was estimated by utilizing standard curve of DEXP concentration versus UV-absorbance at 242 nm. The UV-absorbance of DEXP was measured at λMax = 242 nm by ultraviolet spectrophotometer. The drug encapsulation efficiency (LE) was calculated by equation 1. All measurements were done triplicate.
Where Mo represents the total amount of drug existing in the solution before particle formation, and Mf is the amount of drug remaining in solution after ultracentrifugation in the form of free drug. In addition, DEXP loading capacity of chitosan nanoparticle was measured according to equation 2.
Where Mo - Mf is the amount of DEXP loaded in chitosan nanoparticles (µg), and Mc shows the amount of chitosan consumed to produce the chitosan nanoparticles.
Scanning electron microscopy
The mean size of electrospun nanofibers was analyzed by using a scanning electron microscope (SEM) utilizing AIS2100model (SERONTECHNOLOGIES Co., South Korea) at 25 kV accelerated voltage. First, the samples were covered with gold for 90s by using SC7620model (QUORUMTECHNOLOGIES-EMITECH Co., UK).Nanofibers diameter was estimated from the SEM images with the aid of image J software.
Drug release behavior from nanofibrous scaffolds
Drug release from the scaffold was studied according to a common protocol described elsewhere (19). 100mg of dried scaffold with and without nanoparticles were immersed in 10ml phosphate buffer solution (PBS, pH = 7.4) in triplicate. The samples were transferred to sterile 6-well plates and put in a shaker incubator (80 rpm) at 37 ℃ for 3 weeks.At specified collection times, 4 mL PBS of each samples were taken from the dish and substituted with fresh PBS. The UV-absorbance of DEXP was measured at λMax = 242 nm to estimate the DEXP concentration. The triplicate samples were analyzed. The total mass of released drug at time i was calculated from the following equation (equation 3):
Where Mi and Ci are total amount of released drug and released drug concentration in the solution at time i, respectively. Vs is the sample volume, and V is the total volume of release solution. Nanofiber scaffold without nanoparticles were considered as control sample.
In-vitro degradation
Electrospun samples were washed thoroughly with sterile distilled water and dried by vacuum drier. Each sample was cut into square shape and was precisely weighed. After weighing, the samples were put into sealed plates containing sufficient amount of PBS (pH = 7.4). The samples were settled in a shaker incubator at 37 ℃ (10). After 1, 2, and 3 weeks of incubation, electrospun scaffolds were taken out, washed with distilled water, and then put in a vacuum oven to be completely dried. The dried samples were weighed and degradation rate was calculated according to equation 4.
Where Wo is the initial weight of scaffold, and Wf is the weight of scaffold measured at every week interval of the scaffold degradation.
Contact angle measurement
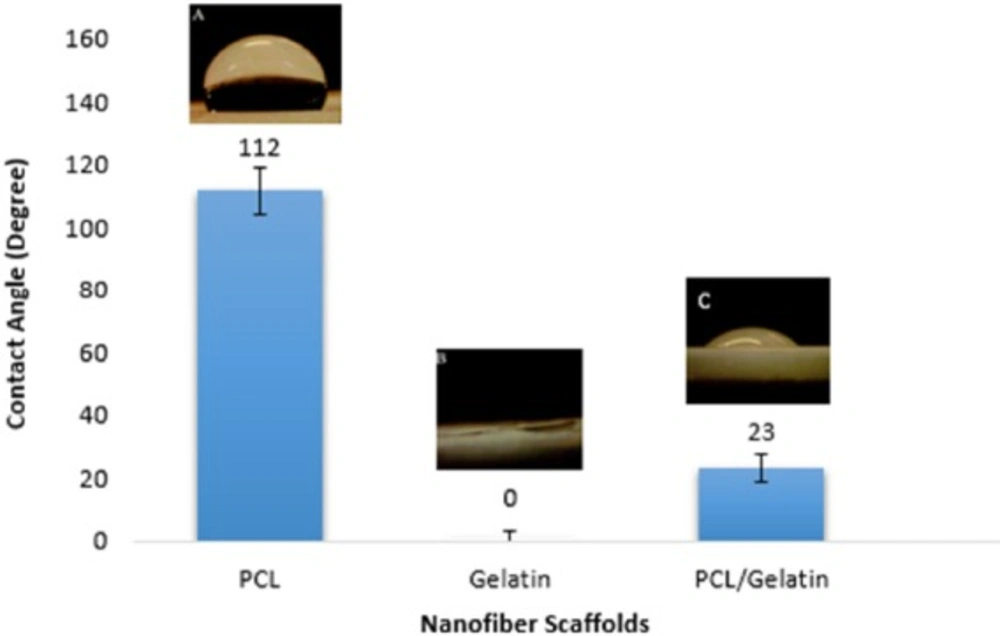
The hydrophilicity of the scaffolds was investigated using OCA15 contact angle meter. 4 µL drop of DI water was put on the surface of the dried scaffold and the contact angle was measured.
| Sample | DEXP Conc. (mg/mL) | BSA Conc.(mg/mL) | EE (%) | LC (μg/mg) | Average NPs diameter (nm) |
|---|
| DEXP-loaded NPs | 0.25 | 0 | 33.4 ± 3.7 | 48.53 ± 11 | 78.8 |
| DEXP-BSA-loaded NPs | 0.25 | 0.2 | 77.2 ± 6.3 | 113.23 ± 14.5 | 149 |
| P-Value | - | - | < 0.001 | < 0.001 | |
| Sample | Elongation at break (mm/mm) | Young's Modulus (MPa) | Tensile strength (MPa) |
|---|
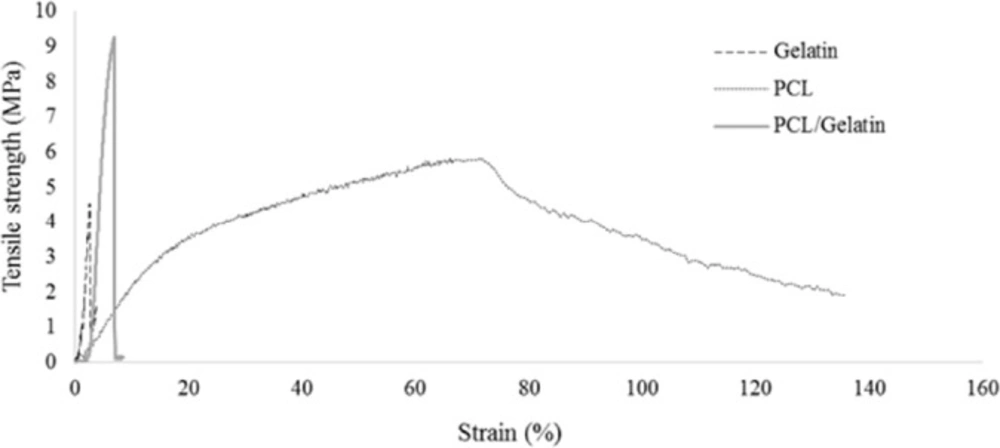
| Gelatin | 2.44±0.3 | 281±34 | 4.2±0.4 |
| PCL | 73.37±9 | 24.4±5 | 5.64±0.7 |
| PCL/Gelatin | 6.37±0.6 | 268.87±32 | 8.86±0.6 |
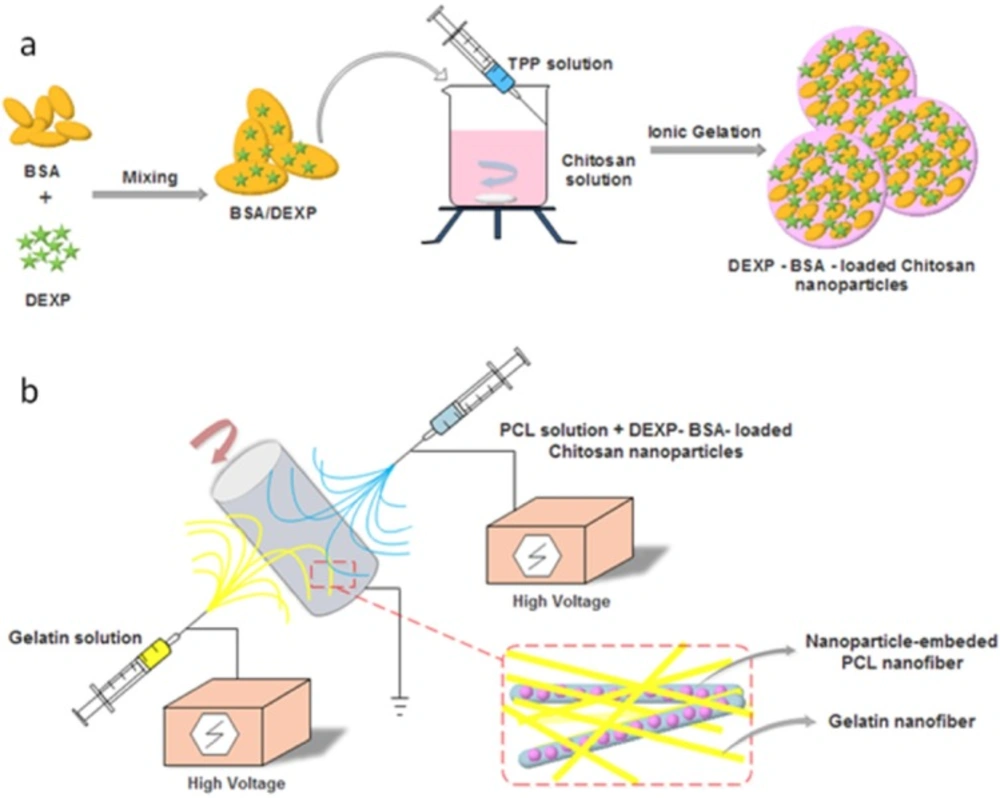
Schematic illustration of DEXP-BSA-loaded chitosan nanoparticles (NPs) (a) and electrospinning procedure for the fabricationof chitosan NPs-embedded PCL and gelatin nanofiber
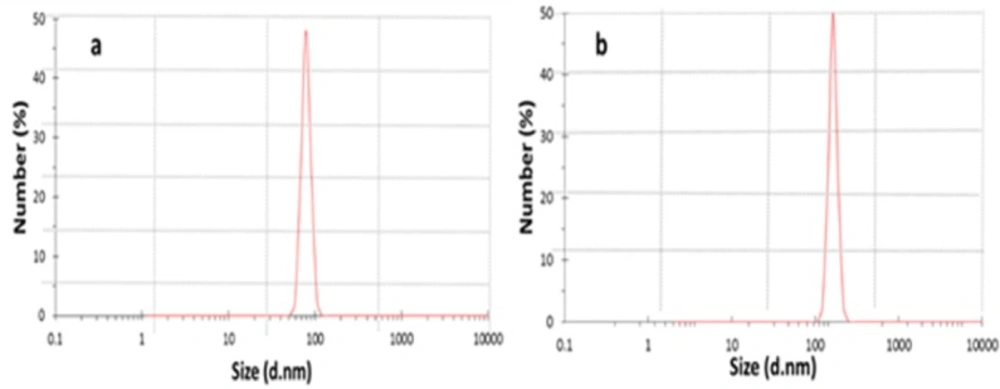
DLS analysis of chitosan nanoparticles (a) and DEXP-BSA-loaded nanoparticles (b)
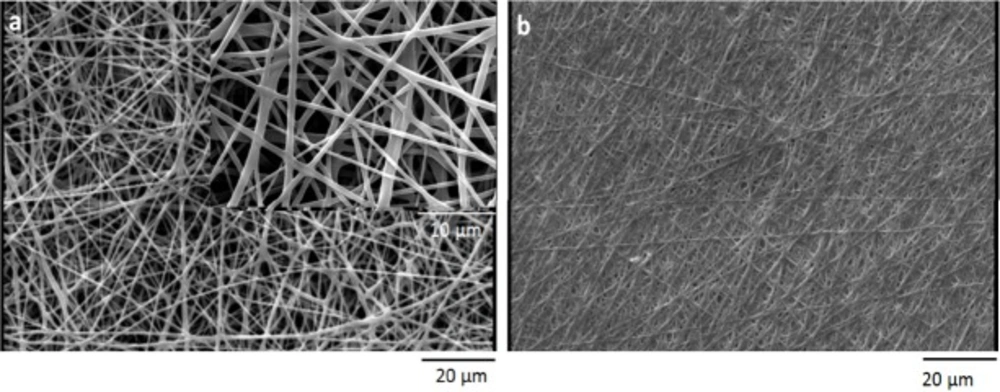
Scanning electron microscopy micrograph of PCL/gelatin a) before crosslinking b) after crosslinking
Mechanical properties of electrospun scaffolds after crosslinking process
Contact angle measurement of nanofiber scaffolds
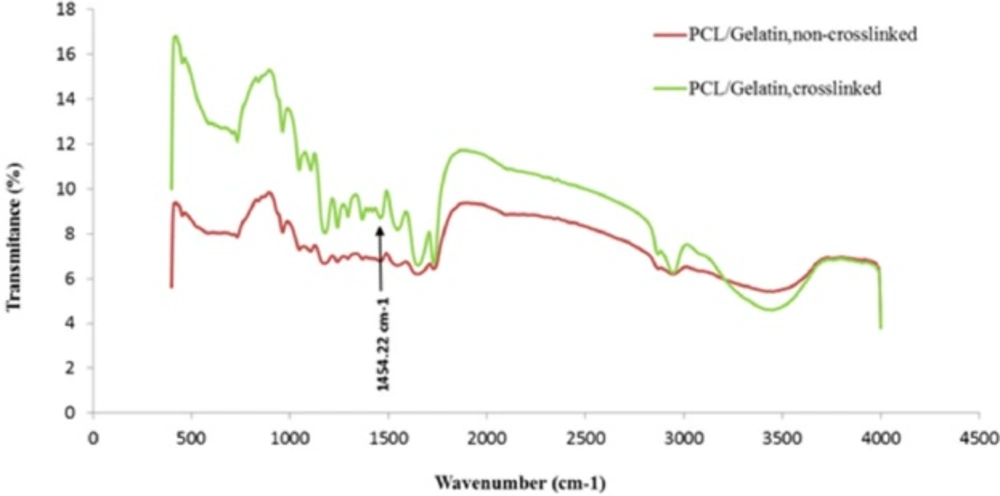
FTIR spectra of the scaffolds
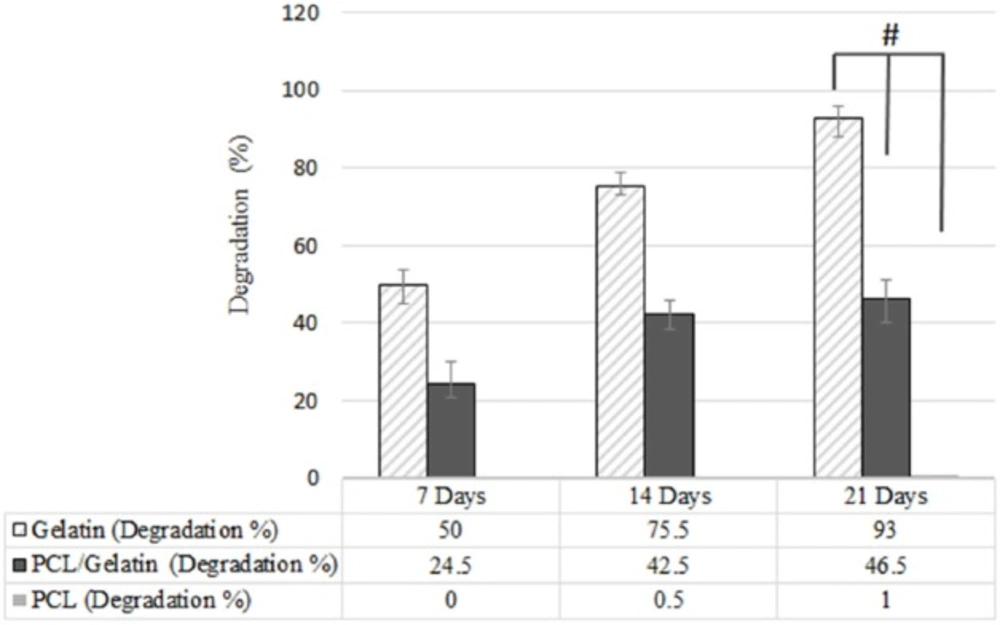
Biodegradation of PCL, PCL/gelatin and gelatin scaffolds, (*p ≤ 0.05)
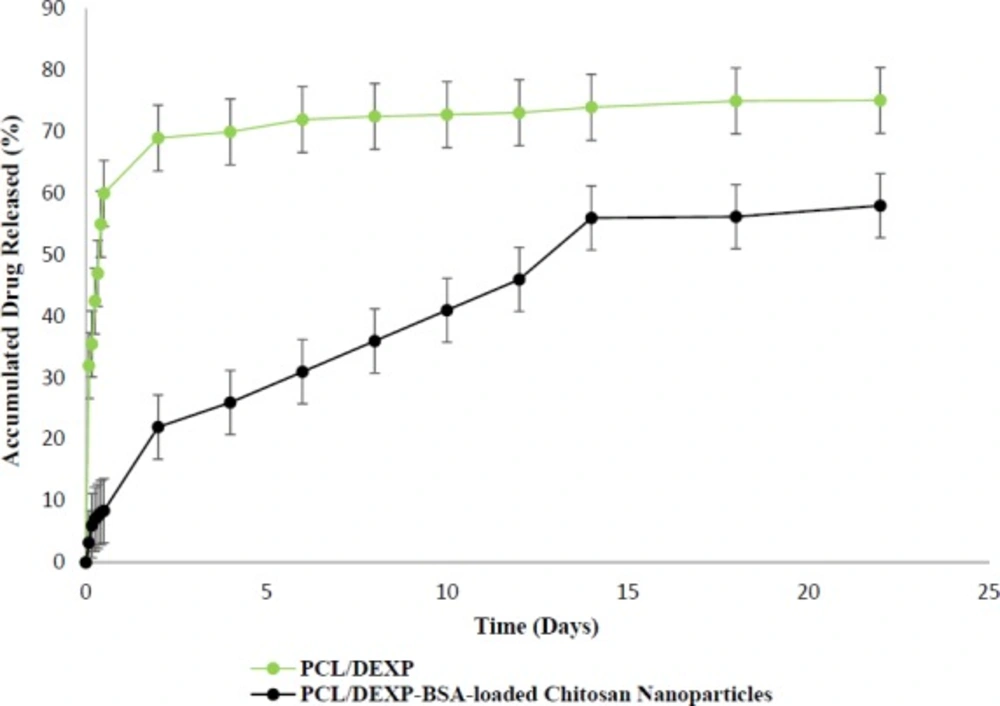
Release profile of DEXP from nanofiber scaffold with and without chitosan nanoparticles
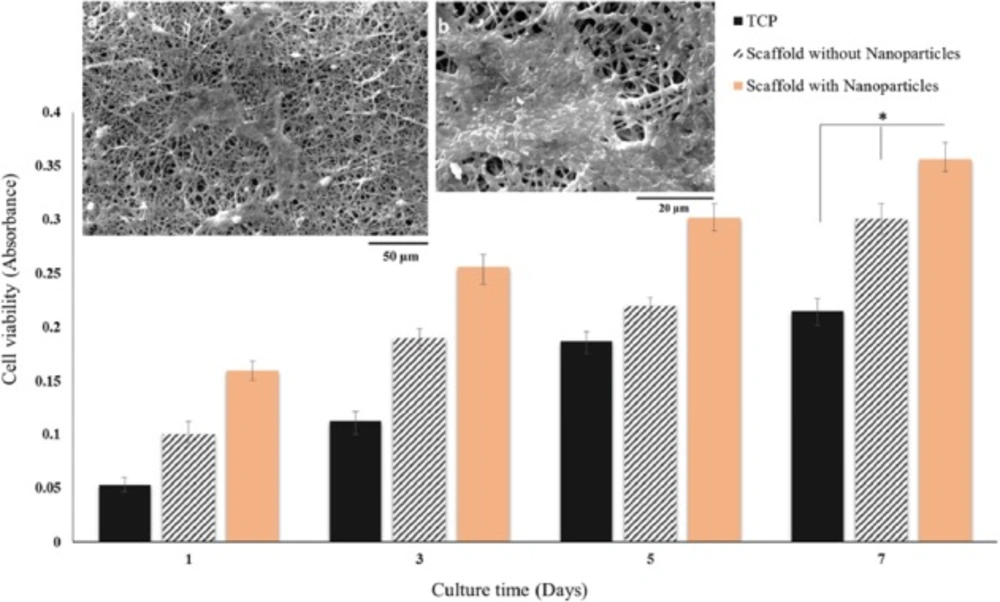
SEM images of BMSCs on PCL/gelatin nanofiber scaffolds containing DEXP-BSA-loaded chitosan nanoparticles at day 7 at different magnifications (a, b) and MTT viability assay of BMSCs cultured on PCL/gelatin nanofiber scaffolds with and without DEXP- BSA-loaded chitosan nanoparticles and TCP (control) at day 1, 3, 5 and 7 (c), (*p ≤ 0.05)
FTIR analysis
PCL/gelatin nanofibers were chemically analyzed before and after the crosslinking process. Functional groups of each sample and the chemical changes occurred during crosslinking reaction in gelatin structure were detected by Fourier transform infrared spectroscopy (FTIR) spectrophotometer using a spectrum RXI system in the range of 4000-400 cm-1 at room temperature. Dried scaffolds were combined with KBr disk, and the uncrosslinked scaffold was considered as the control.
Mechanical property assay
Nanofiber scaffolds were cut into rectangle (10×30 mm2). To characterize the mechanical behavior of the composite scaffold, a universal testing machine (Instron, model STM250, Iran) was applied at uniaxial stretching rate of 50 mm/min.
In-vitro culture of mesenchymal stem cells
Rat bone marrow-derived mesenchymal stem cells (BMSCs) were obtained from female rats (200-250 g: Shahid Beheshti medical school, Tehran, Iran). The procedure was approved by the Ethical Committee of Shahid Beheshti University Medical School (Tehran, Iran). The bone marrow was removed from the femurs and the tibias of sacrificed rats. Basically, BMSCs were isolated according to their ability to adhere to tissue culture plate. Briefly, the whole bone marrow were cultured on tissue culture flask in DMEM/F12 containing penicillin, streptomycin, L–glutamine, and 10% FBS at 5% CO
2, 95% air humidity and 37 ℃ . The medium was changed on day 1, and the non-adherent cells were discarded. After day 1, the medium was replaced daily until they reached 70% cell confluency. The BMSCs at passage four were used for MTT assay (
20).
Analysis of cell morphology, viability and proliferation
To analysis the scaffold biocompatibility, MTT assay was employed. Rat BMSCs (5000 cells/cm2) were cultured on 96- well tissue culture plate (as control) as well as nanofiber PCL/gelatin scaffold with and without DEX-loaded chitosan nanoparticles. The viability of BMSCs seeded on nanofiber scaffold was indicated by MTT assay after 1, 3, 5, and 7 days. After each interval, the cells were washed by sterile PBS. 100 µL of fresh DMEM/F12 medium and 10 µL of 5 mg/mL MTT were added to each well. The plate was incubated for 2-4 h at 37 ℃ . After the appearance of purple precipitate, medium was discarded, followed by adding 100 µL of DMSO, as a detergent reagent. The plate was covered and left in the dark at ambient temperature for 2 h. The content of each well was transferred to new 96-multiwell plate, and its absorbance was measured at 570 nm utilizing Biotek ELISA reader. The morphology of MSCs seeded on the nanofiber scaffold was monitored by SEM (AIS2100 model (Seron Technologies Co., South Korea)). Briefly, BMSCs cultured on the scaffold were fixed by 2.5% glutaraldehyde for 2-4 h followed by dehydration using gradient ethanol concentration (60, 70, 80, 90, 100%) for 75 min. Eventually, the prepared scaffolds were covered with thin gold layer and observed by SEM.
Statistical analysis
All the experiments and analysis were conducted in triplicate, and the results were reported as arithmetic mean ± standard deviation (SD). Statistical analysis was performed using SPSS.18 statistical software. p < 0.05 were considered statistically significant.