1. Background
In recent years, nanoscience has experienced significant advancements due to the rapid expansion of nanotechnology and its broad applications (1). Nanotechnology is an emerging scientific field focused on synthesizing and developing materials within the nano-size range of 1 to 100 nm. Nanoparticles (NPs) have various applications in cosmetics, industry, agriculture, and medicine (2, 3). Due to their small size and high reactive surface, NPs can cross physiological barriers, enter the bloodstream, and target organs, thereby posing potential health risks (4, 5).
Silica NPs (SiNPs) rank among the top 5 engineered nanomaterials widely used in consumer goods, as listed by the Woodrow Wilson International Center for Scholars (6). SiNPs have found extensive application in various technological fields (7-9). Human exposure to SiNPs can occur through ingestion, inhalation, dermal contact, or direct injection into the systemic circulation via intraperitoneal or intravenous injection (10). Moreover, SiNPs exhibit high retention in the environment and food chain, which raises concerns regarding human exposure risks associated with their extensive usage (11).
In this context, both in vivo and in vitro studies have demonstrated the adverse effects of SiNPs on cellular components and cell morphology, leading to protein-DNA damage-induced apoptosis (12). Numerous studies have indicated that reactive oxygen species (ROS) play a role in SiNPs-induced hepatotoxicity (13), neurotoxicity (14), and cardiotoxicity (15).
Oxidative stress is recognized as a crucial molecular mechanism leading to fibrosis in various organs, including the liver and kidneys (16). Multiple mechanisms have been implicated in the pathogenesis of fibrosis (17).
Kidney fibrosis is the principal pathological process resulting from chronic renal damage, characterized by the accumulation and deposition of extracellular matrix (ECM). Matrix metalloproteinases (MMPs), a family of zinc-dependent endopeptidases, play a significant role in degrading ECM components and other non-ECM proteins such as cytokines and growth factors (18), while tissue inhibitors of metalloproteinases (TIMPs) inhibit collagen degradation. Alterations in the expression of MMPs and TIMPs can lead to the progression of fibrosis in pathological conditions (19).
Furthermore, inflammation, which is triggered by oxidative stress, is also believed to lead to the progression of fibrosis. Various factors, including increased production of ROS, can promote the production of a variety of cytokines and growth factors (20). Transforming growth factor-β1 (TGF-β1) is known to lead to the activation and proliferation of myofibroblasts in immune and vascular cells, leading to collagen accumulation. Elevated TGF-β expression in different tissues is associated with significant fibrotic changes. Hence, inflammation plays a crucial role in fibrosis induction. Currently, it remains unclear whether SiNPs lead to the progression of chronic kidney disease after intraperitoneal injection, and the underlying mechanisms are still unknown.
2. Objectives
Given the increasing biomedical applications of SiNPs, it is crucial to elucidate the nephrotoxicity associated with intraperitoneal exposure to SiNPs. While studies have shown the involvement of TGF-β signaling in SiNPs-induced fibrosis, it is evident that other mechanisms are also involved. Therefore, our objective was to investigate the potential kidney toxicity of SiNPs by examining oxidative stress, inflammation, fibrosis, and the underlying mechanisms involved.
3. Methods
3.1. Chemicals
We obtained commercially produced amorphous SiNPs (Silicon dioxide) with a primary size of 15 nm from Sigma-Aldrich Company (Deisenhofer, Germany). All reagents used in the study were purchased from Sigma-Aldrich (Deisenhofer, Germany), and they were of analytical grade.
3.2. Characterizations and Preparation of Silica Nanoparticle Suspension
SiNPs were characterized as described in our previous study (14). The spherical SiNPs had an average size of 11 ± 3 nm (14). To prepare the SiNPs for administration, they were resuspended in deionized water at 37°C and administered at concentrations of 25 and 100 mg SiNPs/kg/day (21). The SiNPs were dissolved and subjected to sonication using an ultrasonic device (Sonorex RK 52 H, Bandelin, Germany) for 15 minutes at 35% amplification. Fresh NP solutions were prepared daily immediately before treatment.
3.3. Animals and Treatments
This study used adult male Wistar rats, aged 8 - 9 weeks, with an average body weight ranging between 200 and 300 g. The rats were obtained from the Central Pharmacy (SIPHAT, Tunisia). The experimental procedures involving the animals were approved by the Ethical Committee of the Faculty of Sciences of Sfax-Tunisia, under protocol number 10.0768/20. The study was conducted in accordance with the general guidelines on the use of living animals in scientific investigations (Council of European Communities 1986) (22). All animals underwent a 1-week acclimatization period and were housed under the same laboratory conditions, with a temperature of 22 ± 2°C and a 12-h light/12-h dark cycle. They were provided with ad libitum access to food and water (23).
The rats were randomly divided into 3 groups (n = 10). The control group received only sterile water. The 2 experimental groups received a daily intraperitoneal injection of SiNPs at doses of 25 and 100 mg/kg for 28 consecutive days. The doses used in this study represent 1/200 and 1/50 of the median lethal dose (LD50) of SiNPs, respectively (21).
3.4. Collection and Preparation of Sample
At the end of the treatment period, all rats were sacrificed by cervical decapitation to minimize stress conditions. Blood samples were collected and centrifuged at 3000 rpm for 15 min at 4°C. Kidney samples were isolated, washed, and weighed. The kidney specimens were excised, placed in 10% formalin, and processed for histological assessment. Kidney sections were immersed in a phosphate buffer solution of 0.1 M (pH 7.4). Using a Teflon-glass homogenizer, the sections were homogenized on ice. The resulting homogenate was then centrifuged at 12000 rpm at 4°C for 15 min. The resulting supernatants were collected and used for further assays.
3.5. Assay of Oxidative Stress Markers and Antioxidants in the Kidney
The assessment of ROS in the homogenate samples was performed using 2′,7′-dichlorodihydrofluorescein diacetate (DCHF-DA), according to the method described by (24). The supernatant obtained from the homogenate was used to measure the levels of malondialdehyde (MDA) (25), protein carbonyl (PCO) contents (26), nitric oxide (NO) (27), hydrogen peroxide (H2O2) (28), catalase (CAT) activity (29), superoxide dismutase (SOD) activity (30), glutathione peroxidase (GPx) activity (31), reduced glutathione (GSH) concentration (32), and protein content (33).
3.6. Total RNA Isolation and Real-Time Reverse Transcriptase-Polymerase Chain Reaction Analysis
Total RNA was extracted according to the TRIzol manufacturer's protocol. The concentration and purity of each RNA sample were assessed by evaluating the DO260 and DO260/DO280 ratios using the NanoPhotometer™ (Implen, GmBH). The extracted RNA was then reverse transcribed into cDNA using the PrimerScript reverse transcriptase (TaKaRa). To evaluate the relative gene expression, a real-time polymerase chain reaction (PCR) was performed on a CFX96TM real-time PCR thermocycler (Biorad, France) using the SYBR® Green PCR Master Mix (TaKaRa). The 2-ΔΔCt method was used to calculate the relative expression, with the β-actin gene serving as the reference standard. The primers used are listed in Table 1.
Table 1.
List of Primers Used in Quantitative Real-time Polymerase Chain Reaction Experiments
| Gene Name | Primer Sequence | |
|---|---|---|
| Forward Primer | Reverse Primer | |
| β-actin | 5′-GAGATTACTGCCCT GGCTCCTA-3′ | 5′-GACTCATCGTACTCCTGCTTGCTG-3′ |
| TIMP-2 | 5′-AATTCGACTTGAAGTCTCAGAAGG-3′ | 5′-AAGTATTTGTCATGGCAGAAATAGG-3′ |
| TGF-β | 5′-GGGCTTTCGCTTCAGTGCT-3′ | 5′-TCGGTTCATGTCATGGATGGT-3′ |
| MMP-2 | 5′-CGTGGTGAGATCTTCTTCTTCAAGGA-3′ | 5′-CCTCATACACAGCGTCAATCTTTTC-3′ |
| MMP-9 | 5′-AATTCGACTTGAAGTCTCAGAAGG-3′ | 5′-AAGTATTTGTCATGGCAGAAATAGG-3′ |
Abbreviations: TIMP-2, tissue inhibitor of metalloproteinase 2; TGF-β, transforming growth factor-beta; MMP-2/9, matrix metalloproteinase 2/9.
3.7. Histopathology
Kidney tissues from both the normal and experimental rats were fixed in 10% buffered formalin and underwent standard processing for paraffin embedding. Sections with a thickness of 5 μm were deparaffinized, rehydrated, and stained using hematoxylin and eosin (H&E) solutions as well as Masson’s trichrome staining. The stained slides were observed under a Leica® microscope equipped with a Sony® digital camera to capture images for histological analysis. The sections were assessed for immune positivity and graded as follows: No (−), mild (+), moderate (++), and severe (+++).
3.8. Statistical Analysis
All data are presented as mean ± SEM for each group. Statistical significance between groups was determined using a one-way analysis of variance (ANOVA), followed by Tukey's post-hoc test for multiple comparisons. The level of significance was set at *P < 0.05, **P < 0.01, and ***P < 0.001 between the treated groups and controls.
4. Results
4.1. SiNPs Provoke Excessive Production of ROS and NO in the Kidneys of Rats
The levels of ROS were assessed using an H2DCF-DA fluorescent probe. Our results demonstrated a dose-dependent increase in ROS levels in the kidneys of rats administered with 25 and 100 mg/kg SiNPs for 28 days (Figure 1A). The administration of the lowest dose of SiNPs resulted in a significant increase in NO levels in the kidney (P < 0.01; Figure 1B) compared to the control group. Rats receiving 100 mg/kg SiNPs exhibited a significantly greater increase in NO levels (P < 0.001).
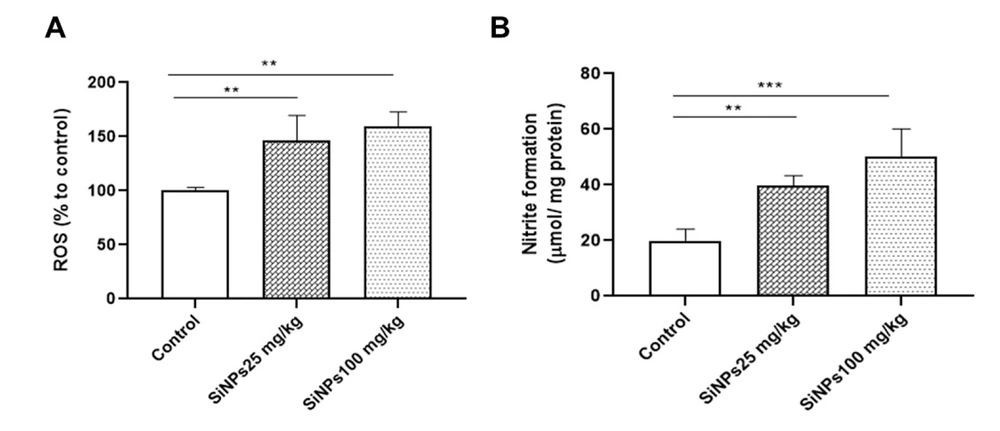
Figure 1.
Silica nanoparticles (SiNPs) induced oxidative stress in the kidneys of rats at doses of 25 and 100 mg/kg of body weight for 28 days on the levels of A, reactive oxygen species and B, nitric oxide. Each value is expressed as the mean ± SEM of 10 rats per group. **P < 0.01 and ***P < 0.001: SiNPs groups compared to the control group. Abbreviations: ROS, reactive oxygen species; SiNPs, silica nanoparticles.
4.2. Silica Nanoparticles Provoke Oxidative Stress in the Kidney of Rats
Oxidative stress has been reported to be associated with kidney fibrosis (34). In this study, our hypothesis was that SiNPs induce oxidative stress in the kidney, leading to renal fibrosis. To validate this hypothesis, we examined the effects of SiNPs on 3 key indicators of oxidative stress: MDA, PCO, and H2O2. As shown in Table 2, rats receiving 25 mg/kg SiNPs exhibited non-significant changes (P > 0.05) in MDA levels compared to the control group, while significant increases (P < 0.05) were observed in PCO and H2O2 levels in renal tissue. On the other hand, exposure to 100 mg/kg SiNPs resulted in statistically significant elevations in MDA (P < 0.001), PCO (P < 0.01), and H2O2 (P < 0.01) levels, indicating tissue damage and the presence of oxidative stress. These results confirm the kidney toxicity and the induction of oxidative stress by SiNPs in rat kidneys following a 28-day exposure period.
Table 2.
The Effect of Intraperitoneal Administration of Silica Nanoparticles at Doses of 25 and 100 mg/kg of Body Weight for 28 Days on Oxidative Stress Markers in the Kidney of Rats a
| Parameters | Groups | ||
|---|---|---|---|
| Control | 25 mg SiNPs/kg | 100 mg SiNPs/kg | |
| MDA (nmol/mg protein) | 1.375 ± 0.281 | 1.818 ± 0.123 | 2.801 ± 0.449 *** |
| PCO (nmol/mg protein) | 21.898 ± 4.305 | 36.065 ± 9.322 * | 48.647 ± 6.152 ** |
| H2O2 (nmol/mg protein) | 9.036 ± 3.145 | 25.804 ± 6.104 * | 66.869 ± 11.056 ** |
Abbreviations: MDA, malondialdehyde; PCO, protein carbonyl; H2O2, hydrogen peroxide.
a Each value is expressed as the mean ± SEM. N = 10 rats per group. * P < 0.05, ** P < 0.01, *** P < 0.001: Silica nanoparticle groups compared to the control group.
4.3. Silica Nanoparticles Suppress Antioxidant Defenses in the Kidneys of Rats
To comprehensively investigate the impact of SiNPs on antioxidant defense, we assessed the GSH content and activities of the antioxidant enzymes SOD, CAT, and GPx in the kidney homogenate of rats exposed to SiNPs (Figure 2). SOD, CAT, and GPx are crucial antioxidant enzymes that play a vital role in combating oxidative stress and maintaining redox balance (35). Following intraperitoneal injection of SiNPs in rats, we observed reduced activities of SOD, CAT, and GPx at different doses compared to the control group (Figure 2A - C). However, when compared to the control group, rats exposed to different doses of 25 and 100 mg/kg SiNPs did not show a significant change in GSH content in the kidney (Figure 2D).
![The effect of administration of silica nanoparticles (SiNPs) at different doses (25 and 100 mg/kg of body weight) for 28 days on renal enzymatic and non-enzymatic antioxidant levels. A, catalase activity (μmol/min/mg of proteins), B, superoxide dismutase (SOD) activity (USOD/mg of proteins), C, glutathione peroxidase (GPx) activity (μmol glutathione [GSH] consumed/min/mg of proteins), and D, GSH activity (µg/mg of protein). Each value is expressed as the mean ± SEM of 10 rats per group. *** P < 0.001, ** P < 0.01: SiNPs groups compared to the control group. Abbreviations: CAT, catalase; SOD, superoxide dismutase; GPx, glutathione peroxidase; GSH, glutathione.](https://brieflands.com/journals/ijpr/articles/143703/figures/ijpr-143703-i002-F2-preview.webp "The effect of administration of silica nanoparticles (SiNPs) at different doses (25 and 100 mg/kg of body weight) for 28 days on renal enzymatic and non-enzymatic antioxidant levels. A, catalase activity (μmol/min/mg of proteins), B, superoxide dismutase (SOD) activity (USOD/mg of proteins), C, glutathione peroxidase (GPx) activity (μmol glutathione [GSH] consumed/min/mg of proteins), and D, GSH activity (µg/mg of protein). Each value is expressed as the mean ± SEM of 10 rats per group. *** P < 0.001, ** P < 0.01: SiNPs groups compared to the control group. Abbreviations: CAT, catalase; SOD, superoxide dismutase; GPx, glutathione peroxidase; GSH, glutathione.")
Figure 2.
The effect of administration of silica nanoparticles (SiNPs) at different doses (25 and 100 mg/kg of body weight) for 28 days on renal enzymatic and non-enzymatic antioxidant levels. A, catalase activity (μmol/min/mg of proteins), B, superoxide dismutase (SOD) activity (USOD/mg of proteins), C, glutathione peroxidase (GPx) activity (μmol glutathione [GSH] consumed/min/mg of proteins), and D, GSH activity (µg/mg of protein). Each value is expressed as the mean ± SEM of 10 rats per group. *** P < 0.001, ** P < 0.01: SiNPs groups compared to the control group. Abbreviations: CAT, catalase; SOD, superoxide dismutase; GPx, glutathione peroxidase; GSH, glutathione.
4.4. Messenger RNA Expression of Fibrosis Factors in Kidney Tissue
Renal fibrosis is a common pathological feature and a final manifestation of chronic kidney diseases. To investigate whether SiNPs induce renal fibrosis, we determined the expression levels of MMP-9, MMP-2, TIMP-2, and TGF-β1 in kidney tissue using RT-qPCR. The results revealed a dose-dependent upregulation of MMP-9, MMP-2, and TGF-β1 expression following treatment with SiNPs, with significant differences observed in the 100-mg/kg SiNPs group compared to the control group (P < 0.05; Figure 3A - C). Furthermore, the mRNA expression levels of TIMP-2 showed significant dose-dependent downregulation in the 25- and 100-mg/kg SiNPs groups (P < 0.05 and P < 0.001, respectively; Figure 3D).
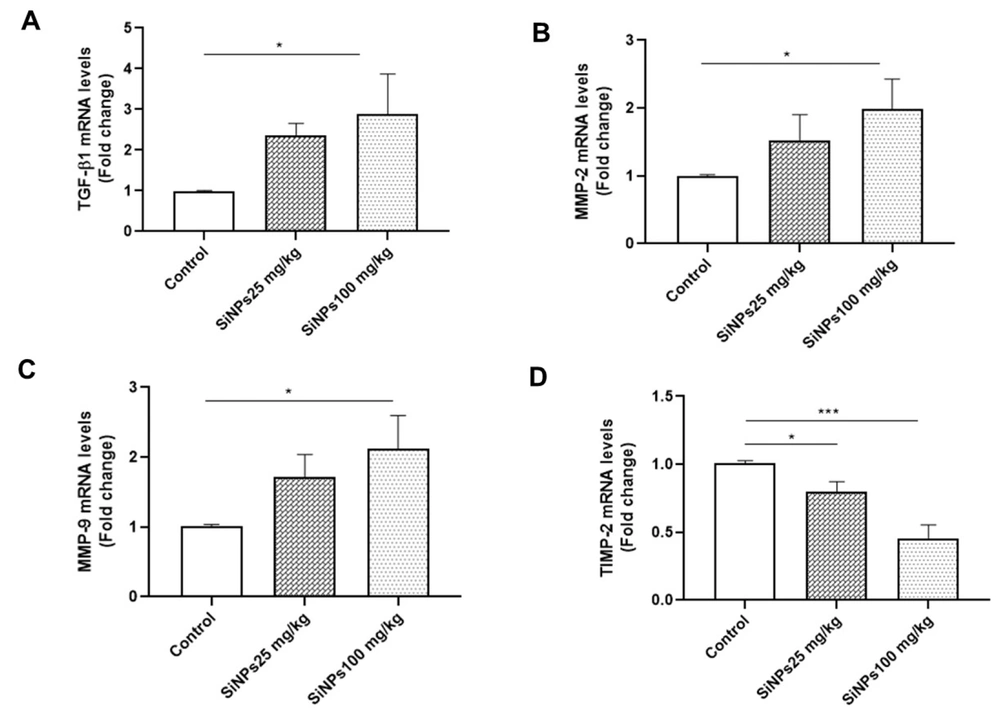
Figure 3.
The effect of administration of silica nanoparticles (SiNPs) at doses of 25 and 100 mg/kg of body weight for 28 days on renal A, transforming growth factor-beta 1, B, matrix metalloproteinase 2 (MMP-2), C, MMP-9, and D, tissue inhibitor of metalloproteinase 2 expression levels. Each value is expressed as the mean ± SEM of 6 rats per group. *P < 0.05, ***P < 0.001: SiNPs groups compared to the control group. Abbreviations: TGF-β1, transforming growth factor-beta 1; MMP-2, matrix metalloproteinase 2; TIMP-2, tissue inhibitor of metalloproteinase 2.
4.5. Silica Nanoparticles Induce Kidney Fibrosis in Rats
Table 3 and Figures 4 and 5 display the histopathological features of rat kidneys after 28 days of intraperitoneal exposure to different doses of SiNPs.
Table 3.
Severity of Various Histopathological Alterations in Male Rats Exposed and Unexposed to Silica Nanoparticles a
| Variables | Control | SiNPs (mg/kg) | |
|---|---|---|---|
| 25 | 100 | ||
| Glomerulonephritis | - | ++ | +++ |
| Glomerular atrophy | - | - | + |
| Tubular degeneration | - | ++ | +++ |
| Interstitial inflammatory cell aggregates | - | ++ | +++ |
| Leukocyte infiltration | - | - | ++ |
Abbreviation: SiNPs, silica nanoparticles.
a (−) No change, (+) mild change, (++) moderate change, and (+++) severe change.
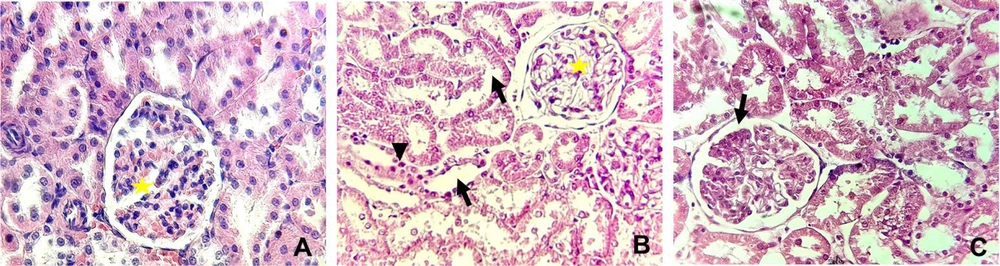
Figure 4.
Histopathological alterations in the kidney in different groups examined by hematoxylin and eosin staining (X400). (A) The control group showing normal glomeruli (yellow star), (B) rats received 25 mg/kg of silica nanoparticles (SiNPs) showing marked interstitial fibrosis with mononuclear inflammatory cell aggregation (arrowhead), tubular degeneration (arrow), and glomerulonephritis (yellow star). In addition to these manifestations, (C) rats received 100 mg/kg of SiNPs showing glomerular atrophy (arrow).
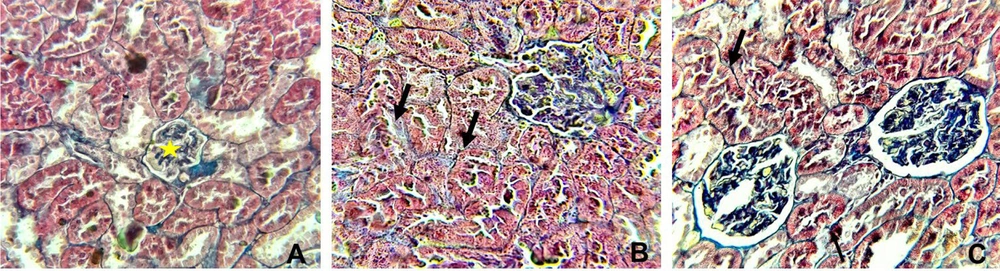
Figure 5.
Histopathological alterations in the kidney in different groups examined by Masson’s trichrome (X400). A, the control group showing normal glomerular (yellow star), interstitial, and perivascular collagen, B, rats received 25 mg/kg of silica nanoparticles (SiNPs) showing mild interstitial fibrosis (arrow), and C, rats received 100 mg/kg of SiNPs showing marked interstitial fibrosis (arrow).
Microscopic examination of the control rat kidney stain was normal (Figures 4A and 5A). However, rats who received the lower dose of SiNPs (25 mg/kg of body weight) showed interstitial fibrosis with mononuclear inflammatory cell aggregation, tubular degeneration, and glomerulonephritis (Figures 4B and 5B). In addition to these manifestations, glomerular atrophy was observed in rats exposed to 100 mg/kg of SiNPs (Figures 4C and 5C).
5. Discussion
In this study, the administration of SiNPs at doses of 25 and 100 mg/kg of body weight to rats for 28 consecutive days resulted in nephrotoxicity characterized by severe oxidative stress, as indicated by a significant increase in MDA levels (a marker of lipid peroxidation), along with a significant decrease in GSH content and activities of antioxidant enzymes CAT, SOD, and GPx in the kidneys. Histopathological analysis of SiNPs-treated animals compared to the control group revealed interstitial fibrosis, mononuclear inflammatory cell aggregation, tubular degeneration, glomerulonephritis, and glomerular atrophy.
It is worth noting that NPs can reach various organs, including the kidney, liver, and spleen, through the circulatory system, irrespective of the route of exposure (36). The kidney, being the primary site for excretion, is particularly susceptible to the adverse effects of NP toxicity, which can impact renal function (37).
Our findings suggest that SiNPs may induce oxidative stress through a ROS-mediated process. The unsaturated surface bonds and hydroxyl groups on the silica surface contribute to oxidative damage and the generation of ROS (38).
The interaction of NPs, including SiNPs, with cells disrupts the balance between prooxidants and antioxidants, leading to mitochondrial dysfunction, inhibition of enzyme activity, and cell death due to DNA damage (39, 40).
Consistent with our previous study, SiNPs-induced liver and brain damage was demonstrated to be attributed to oxidative stress induction, followed by lipid peroxidation, inflammation, and apoptosis, which impair their functions (13, 14).
Oxidative stress, which is pathologically evident in certain diseases, plays a crucial role in the development of fibrogenesis under pathological conditions (41). To explore potential mechanisms of renal fibrosis, we measured the content of key renal fibrotic markers (TGF-β, TIMP, and MMP-2/9) using real-time PCR. Our results indicated an upregulation of MMP-2/9 and TGF-β1, coupled with a downregulation of TIMP-2 in the SiNPs-exposed groups. Reactive oxygen species can modulate TGF-β signaling by enhancing its expression and activation. TGF-β is a potent and widespread profibrogenic cytokine that plays a significant role in the development of fibrosis and leads to extensive deposition of ECM in various organs, such as the heart, lungs, kidneys, and liver (42). TGF-β1 is a critical profibrotic cytokine and is considered a central mediator in the pathogenesis of renal fibrosis. According to Tang et al. (43), TGF-β expression is upregulated in animal models of renal fibrosis, as well as in human counterparts.
Similarly, MMP-9) plays a profibrotic role in renal fibrosis (44). It promotes the epithelial-mesenchymal transition of epithelial tubular cells, which is associated with renal fibrosis in both proximal tubular and glomerular epithelial cells (45).
Wan et al. (46) reported that certain NPs can disrupt the balance between (MMPs and their tissue inhibitors, leading to MMP overexpression. Based on this, we hypothesize that the upregulation of MMP-2 and MMP-9 induced by SiNPs results in the downregulation of TIMPs, thereby inhibiting the action of MMPs. The activation of MMPs is tightly regulated by their endogenous inhibitors, TIMPs. Our findings show that SiNP exposure downregulates the expression of TIMP-2, suggesting that ROS production, as observed in previous studies, also plays a role in the regulation of TIMP-2.
Reactive oxygen species have been shown to activate latent MMPs in conditioned media (47). Analysis of the promoters of MMPs and TIMPs has revealed the presence of other elements, including activator protein-1 (AP-1) elements and multiple Ets elements (48).
In summary, the data from this study lead us to conclude that exposure to SiNPs has toxic effects on the kidneys of male rats (Figure 6).
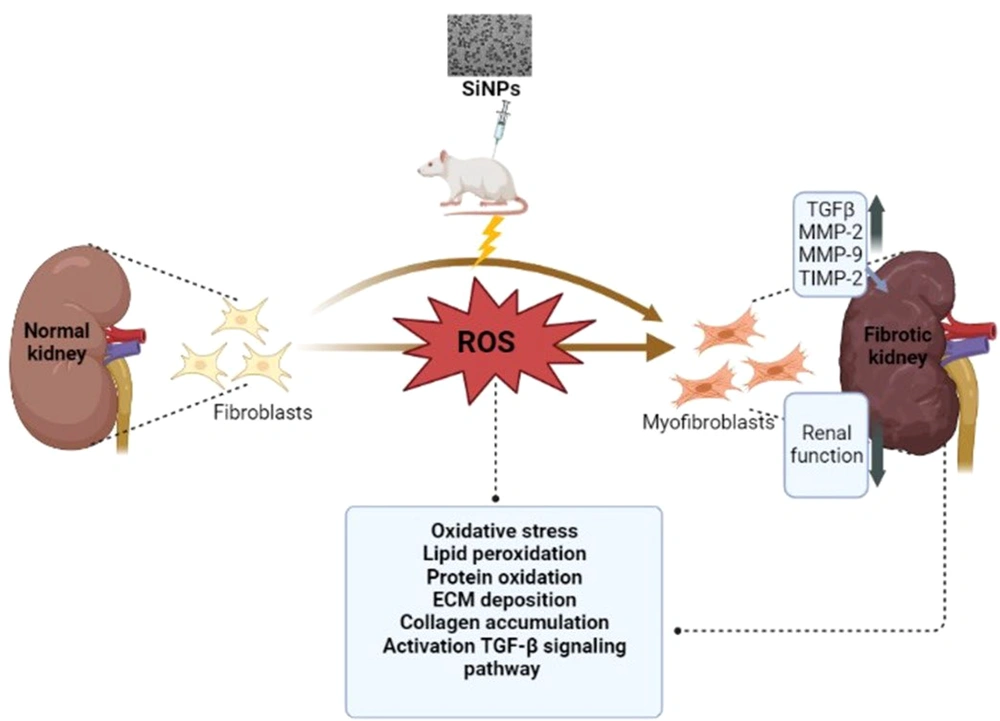
Figure 6.
A proposed schematic diagram illustrating silica nanoparticles-induced renal toxicity and fibrosis.
5.1. Conclusions
This study provides insights into the altered signaling pathways in the kidney resulting from intraperitoneal exposure to SiNPs. This includes the upregulation of numerous marker genes involved in the fibrosis process and an imbalance between antioxidant defenses and the production of ROS. While this study offers an overview of the significant biochemical, molecular, and histopathological changes induced by SiNPs in the kidney, it is important to note that other endpoints and signaling pathways may also play a crucial role, requiring further research. Collectively, the results of the present study provide an understanding of the mechanistic pathways activated by SiNPs to enhance the nephrotoxic effect.