It has come to our attention that Figures 3 and 5 in the above-mentioned article were published incorrectly due to an error from the previous publisher (SBMU) and an oversight by the authors, who did not thoroughly review their article when receiving the Galley Proof (1).
We deeply regret this error and any confusion it may have caused. The correct versions of Figures 3 and 5 are now provided below.
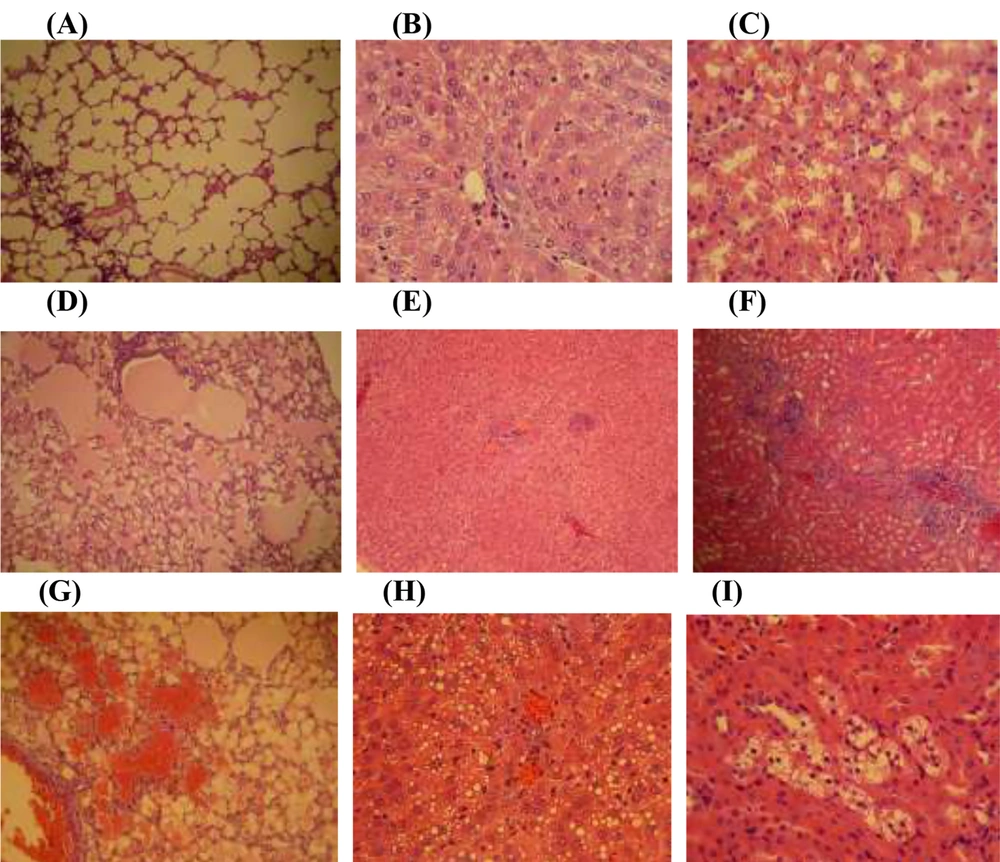
Figure 3.
Photomicrograph of rat's lung, liver and kidney sections; (A, B and C; 400 x) representing the lung, liver and kidney from control group; no histological changes are observed, (D and G; 100 and 400 x respectively) lungs of PQ-exposed rats at medium and high doses respectively; a severe alveolar edema and hemorrhages is seen, (E and H; 100 and 400X respectively) liver of PQ-exposed rats at medium and high doses respectively; representing a severe congestion along with swelling of hepatocytes and the fatty degeneration in periportal zone of classical lobules and (F and I; 100 and 400X respectively) show the kidney from animals that exposed to medium and high doses of PQ respectively; multifocal interstitial nephritis, and the presence of protein casts in renal tubules are manifested. E&H staining and scale bar is 0.1 mm
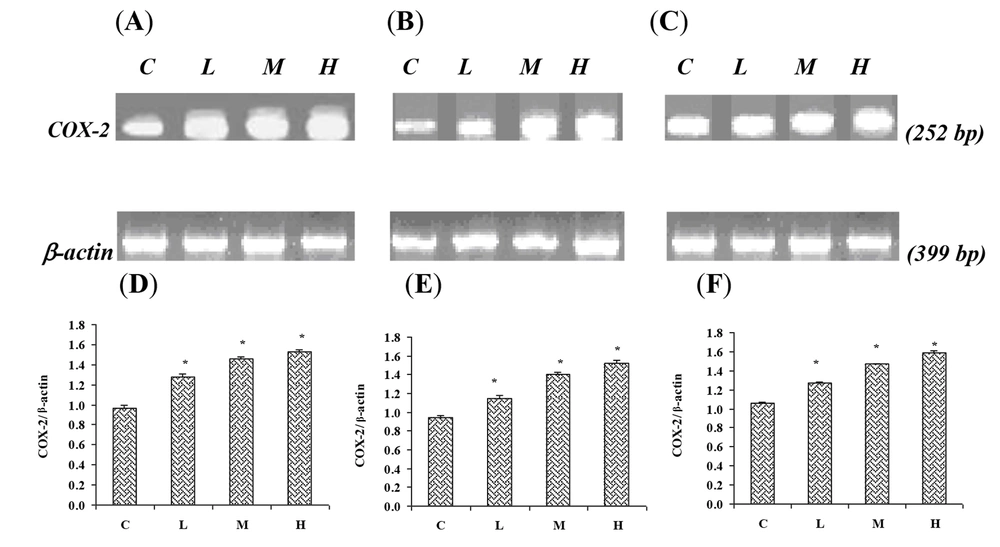
Figure 5.
Effect of Paraquat on COX-2 mRNA level in: (A) the lungs, (B) the liver, and (C) the kidneys; the expression of β- actin as control gene from the corresponding animals are depicted in lower panels. The levels of COX-2 mRNA were evaluated by semi-quantitative RT-PCR. Lower panels represent the COX-2 mRNA levels in: (D) the lungs, (E) the liver and (F) the kidneys; that were measured by densitometry and normalized to β-actin mRNA expression level. Results were expressed as integrated density values (IDV) of COX-2 mRNA level. C= control (received vehicle); L = low dose (3.5 mg/kg), M = medium dose (7 mg/kg) and H = high dose (10 mg/kg).
We apologize for any inconvenience this may have caused to the readers and the scientific community. We appreciate your understanding and thank you for your continued support.
Please note, the new publisher started with this journal from January 1, 2022 (https://brieflands.com/posts/new_publisher_ijpr), while the old publisher was responsible for publications until December 2021. This article was originally published in October 2013. As Brieflands was not the publisher of this article, the original version has not been edited.
Sincerely,
The Head of Ethics Committee
Ethics Committee of Brieflands Publishing, On Behalf of EIC
![Expression of Concern for Paraquat Exposure Up-regulates Cyclooxygenase-2 in the Lungs, Liver, and Kidneys in Rats [Iran J Pharm Res. 2013; 12(4): e125760]](https://brieflands.com/journals/ijpr/articles/151659/figures/thumbnail.webp)
![Erratum: Allicin Alleviates Aortic Dissection Progression via p38/MAPK/NF-κB Signaling Pathways [Jundishapur J Nat Pharm Prod. 2025; 20 (4): e165405]](https://brieflands.com/journals/jjnpp/articles/168126/figures/thumbnail.webp)
![Corrigendum to: Hepatitis B Virus Genotyping Among Patients With Cirrhosis [ Published in Jundishapur J Microbiol. 2015 March; 8(3): e14571.]](https://brieflands.com/journals/jjm/articles/59893/figures/thumbnail.webp)
![Erratum for “Evaluation of the Neuroprotective Effect of Chalcone on P53 and Caspase III Expression and D2-Like Dopaminergic Receptor Up-Regulation in vitro Parkinson's Model [J Cell Mol Anesth. 2022; 8 (1): e151424]”](https://brieflands.com/journals/jcma/articles/165378/figures/thumbnail.webp)


