


1. Background
Present data show a global increase in the rate of cardiovascular disease. According to the World Health Organization (WHO), an estimated 17.3 million people died from cardiovascular disease in 2008, representing 30% of all global deaths (1). Coronary artery disease is the most common type of heart disease in the United States. In 2008, 405309 people died from coronary artery disease in the United States (2). Thus, a considerable number of individuals with suspected cardiovascular disease require clinical evaluation (3).
Angiography is an imaging modality that opacifies body vessels. Cardiac angiography is a procedure used to visualize the heart vessels via contrast media when exposed by X-rays (4). Invasive cardiac coronary angiography is known as the gold standard for detecting coronary obstructive defects (5). However, it is associated with a less than 2% risk of complications. This risk may increase significantly depending on the patient’s condition (6). Therefore, due to the associated risks and large number of patients undergoing this imaging technique, a simple, rapid and noninvasive modality for coronary angiography was developed. Cardiac CT angiography was established as a non-invasive cardiac angiography imaging modality following the introduction of multi-slice CT (MSCT) (7).
Advances in technology have resulted in an increase in gantry rotational speed. Accordingly, the temporal and spatial resolutions of newer MSCT scanners have increased considerably (8). The thyroid is a radiosensitive organ that is located in the front of the neck inferior to the cricoid cartilage. Its anatomical position is such that this gland is exposed directly or indirectly when adjacent body parts are imaged, particularly during cardiac CT angiography when patients are placed in the supine position and the neck is extended. The radiation dose to the thyroid during different radiological examinations has been evaluated (9, 10) and the risk of cancer in the thyroid gland due to the received radiation dose has been assessed by groups of researchers (11). The gonad as another radiosensitive organ must be protected from ionizing radiation due to the risk of hereditary effects of ionizing radiation in young patients (12).
Retrospective electrocardiographic gating is the main choice of data acquisition in cardiac coronary artery imaging with multiple-row detector. In this mode the subjects’ electrocardiography (ECG) signals are monitored continuously and CT scan is acquired continuously in helical mode. Both the scan projection data and the ECG signals are recorded. The information about the subject’s heart cycle is then used during image reconstruction. This method of data collection causes further improvement in temporal resolution. However, the disadvantage of the retrospective gating mode of acquisition is the increased radiation dose because the data are acquired throughout the heart cycle. In contrast, during the prospective ECG- triggered scan mode, the patient’s ECG is continuously monitored, but the X-ray tube is turned on at predetermined R-R intervals to acquire sufficient scan data for image reconstruction (8). Therefore, the patient’s radiation dose is minimized compared with retrospective gating, but this mode of scan is associated with some limitations (13). Accordingly, most of the imaging centers that use 64-multislice CT prefer to use the advantages of retrospective gating cardiac CT angiography.
Care Dose 4D is a technique that reduces dose in CT. Care Dose 4D is another name for automatic exposure system (different manufacturers have assigned different names to this method e.g. Smartm A, DoseRight). Automatic exposure control, which is also called phototimer in general radiology, has been used instead of manual exposure time setting in radiography. Phototimers operate by measuring the actual amount of radiation incident on the image receptor (e.g. detectors) and terminating X-ray production when the proper amount is obtained. In other words, In other words, this causes an X-ray tube current that is adapted to the anatomy of the patient. For example, in an adult patient, 140 mAs (milliamper-second) might be needed in the shoulder region; whereas, 55 mAs would be enough in the thorax (14).
2. Objectives
The aim of this study was to evaluate the radiation dose to the thyroid and pelvis regions in patients undergoing cardiac CT angiography using retrospective ECG gating and Care Dose 4D method.
3. Patients and Methods
3.1. Patient Enrollment
Following study approval by the University’s Medical Ethics Committee, 81 patients, (41 males and 40 females) diagnosed with suspected coronary artery disease referred to Golestan Hospital, Imaging Department were recruited. Inclusion criteria were based on the protocol for multi-slice CT coronary angiography. For instance, the number of heart beats (70 beats/minutes), renal system function (normal range of blood urea nitrogen and serum creatinine), no allergy to contrast media, ability to lay flat, respiratory system function (ability to hold a 20-second breath) were assessed in each patient. Exclusion criteria were rapid changes of heart beat before starting or during the test, or any critical condition while injecting contrast media.
3.2. TLD Placement
Before performing measurements, the aim of the study was explained and patient consent was obtained to attach thermoluminescent chips (TLDs) to the skin at the level of the thyroid and pelvis regions. For male subjects, TLDs were mounted on the patient’s cover, exactly where the testes are located in supine position Figure 1 for female subjects, TLDs were placed at the approximate anatomical position of the ovaries in the pelvis (hypogasteric region between the anterior iliac spine and mid sagittal line) to measure the received dose Figure 2. To measure entrance skin dose (ESD) at the level of the thyroid, five TLD chips were used. A theoretical square was used and a TLD chip was placed at each corner and one in the middle of the square Figure 3. The average of the TLD doses was calculated and recorded.
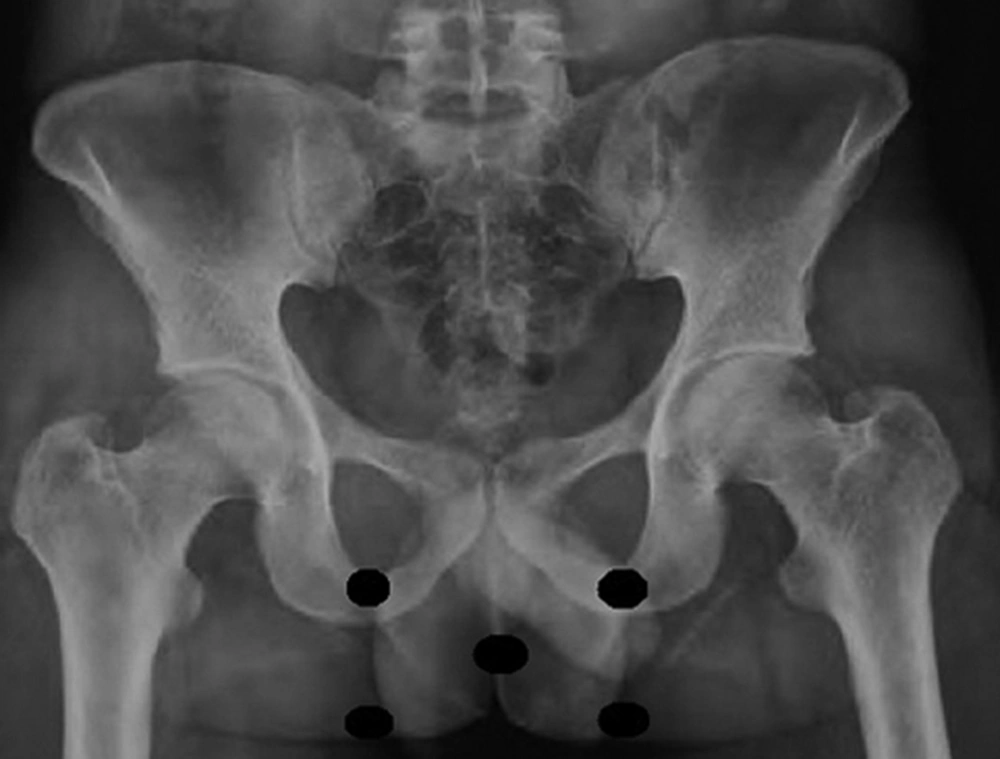
Figure 1.
Placement of thermo luminescent chips on the male pelvis
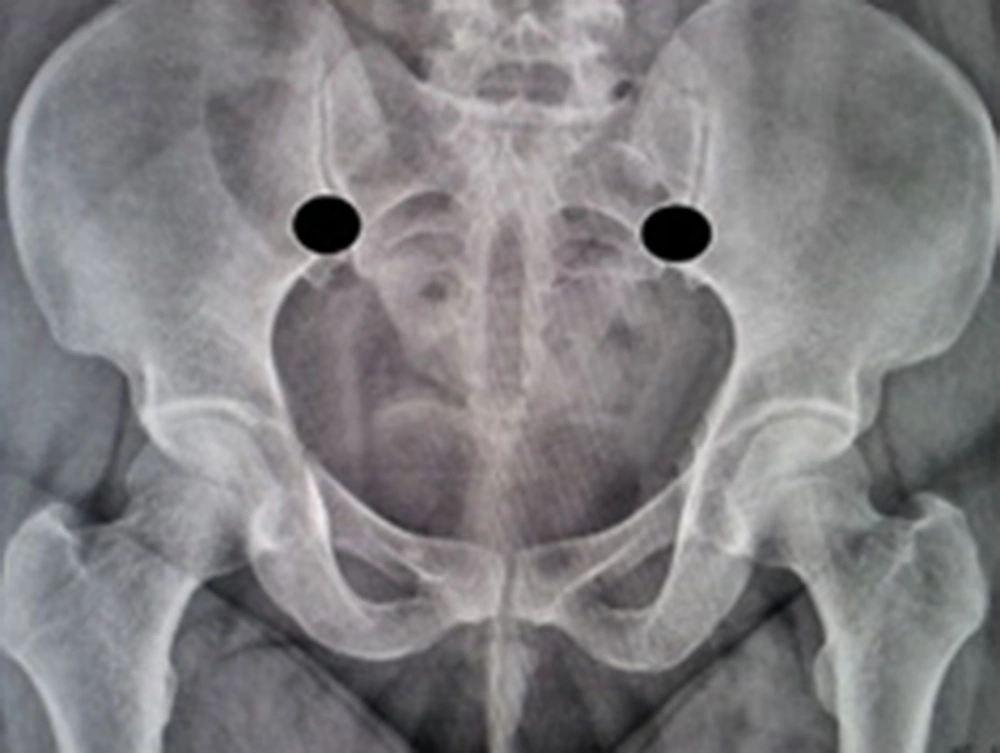
Figure 2.
Placement of thermo luminescent chips on the female pelvis
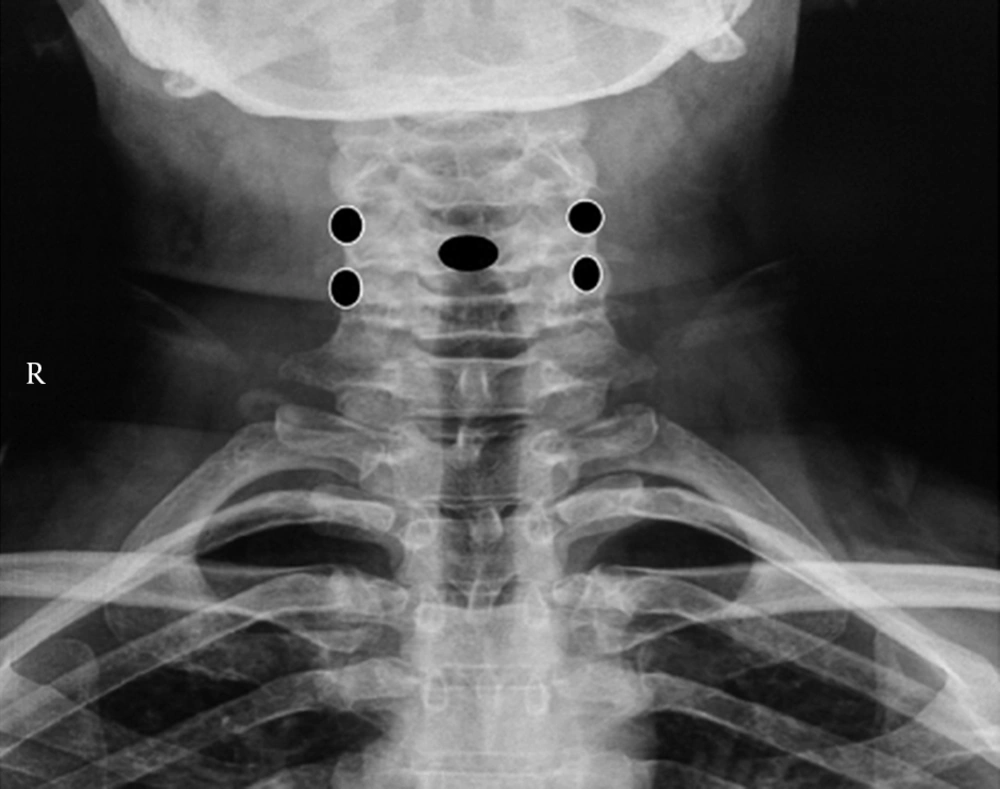
Figure 3.
Placement of thermo luminescent chips on the thyroid region
3.3. Imaging Protocol
Patients were scanned using a Sensation 64 (Siemens, Forchheim- Germany). The Care Dose 4D method was selected to scan the patients. Retrospective electrocardiographic gating was used to collect the data. A topogram (topogram or scout view is a lateral or frontal image of the patient reconstructed in rectangular grid), Ca score (Ca score is a number reflecting the degree of calcium depositions in the walls of the coronary arteries), test bolus (test bolus is an exposure that reveals the measure of contrast media of a particular vessel) and coronary CT (coronary CT is computed tomography angiography test) were carried out for each patient. The KeV was set at 120. Slice thickness was 0.6 mm, pitch was 0.3, and the rotation time was 0.33 second. Scanning was started from carina to 2 cm below the diaphragm. The total dose length product (DLP) and total mAs were obtained from the patients’ files and recorded.
3.4. TLD Preparation and Calibration and Radiation Dose Assessment
The TLD (GR-200, Li, Mg, Cu, P) chips were 3.2 × 3.2 × 8.9 mm in size. TLDs were annealed at 245˚C for 10 minutes based on the operating condition recommendations before irradiation. They were then left to cool at room temperature. The TLD calibration procedure was performed on the basis of the Harshaw 3500 operation manual. Each chip was placed inside a thin plastic bag to prevent physical and chemical damage. The TLDs were read by a Harshaw 3500 that was controlled by Winrem software. The mean dose of the TLDs was recorded as the measured skin entrance dose. Entrance skin doses for the gonads in male subjects were converted to effective dose using appropriate weighting factor (0.20). For thyroid and female gonad dose assessment, guidelines introduced by Bushberg et al. (2002) for organ dose estimation were adapted. Then the obtained values were multiplied by appropriate tissue correction factor (0.04 for thyroid).
3.5. Statistical Analysis
The data obtained were transferred to SPSS ver. 15 (SPSS Inc., Chicago, IL) for analysis. Differences between parameters for the two patient groups were tested by unpaired t-tests at 95% confidence interval (two-tailed). A P value less than 0.05 was considered statistically significant.
4. Results
The radiation dose to the thyroid and gonads in the patients undergoing cardiac CT angiography was measured using retrospective ECG gating and Care Dose 4D method. Mean scan length was 13.1 cm and 13.5 cm, respectively for female and male subjects. The characteristics of the male and female subjects are shown in Tables 1 and 2. Comparing the characteristics shown in Tables 1 and 2, the average age for cardiovascular disease development in male and female subjects was 48.4 and 50.6 years, respectively.
Table 3 shows that there were no significant differences between the mean total DLP and total mAs in male and female subjects. Table 4 shows that there was a significant difference in the thyroid dose between male and female subjects. A significant difference in gonad dose was also observed between male and female subjects.
Table 1. Male Characteristics
| Variables | Values |
|---|---|
| No. of Patients | 41 |
| Mean Age, y | 48.4 ± 10.24 |
| Mean Weight, kg | 78.6 ± 10.93 |
| Mean Height, cm | 174 ± 5.49 |
| Mean Body Mass Index, kg/m2 | 26.5 ± 5.06 |
Table 2. Female Characteristics
| Variables | Values |
|---|---|
| No. of Patients | 40 |
| Mean Age, y | 50.6 ± 15.27 |
| Mean Weight, kg | 74.9 ± 11.54 |
| Mean Height, cm | 161.9 ±5.62 |
| Mean Body Mass Index, kg/m2 | 27.21 ± 4.78 |
Pearson correlation test was used to assess potential correlation between variables. For both male and female subjects, a correlation was observed between total DLP and total mAs (for males, r = 0.895, P = 0.001; for females, r = 0.902, P = 0.001), between body mass index (BMI) and total DLP (for males, r = 0.582, P = 0.001; for females, r = 0.580, P = 0.006), between BMI and total mAs (for males, r = 0.470, P = 0.008; for females, r = 0.690, P = 0.0.0001). For male subjects, a correlation was observed between thyroid dose and DLP (r = 0.575, P = 0.001). A correlation was also observed between total mAs and thyroid dose for male subjects (r = 0.598, P= 0.001).
whereas, a correlation was not observed between thyroid dose and BMI (for males, r = 0.085, P = 0.650; for females, r = 0.262, P = 0.251), between gonad dose and BMI (for males, r = 0.230, P = 0.214; for females, r = -0.117, P = 0.612), between thyroid dose and total DLP (for females, r = 0.223, P = 0.332) , between thyroid dose and total mAs for female subjects (r = 0.308, P = 0.174), and finally between gonad dose and total mAs (for males, r = 0.058, P = 0.758; for females, r = 0.112, P = 0.630).
5. Discussion
The radiation dose to the thyroid and pelvis regions in patients (male and female) undergoing cardiac CT angiography was measured. The results of this study showed that the average age of male and female subjects diagnosed with suspected coronary artery disease requiring clinical evaluation was 48.4 ± 10.24 and 50.6 ± 15.27 years, respectively.
The DLP that indicated total exposure following a series of scans was not significantly different between male and female subjects (P = 0.221). This was similar to total mAs that indicated total radiation exposure.
It was assumed that breast tissue in female subjects acted as a radiation scattering factor and increased the skin dose to the thyroid region. Therefore, significant difference in the mean radiation dose to the thyroid was observed between male and female subjects.
The mean of the thyroid dose in male and female subjects was 0.32 mSv and 0.41 mSv, respectively (total mean 0.36). With regard to national commission radiation protection (NCRP 2003c) recommendations, which stated that cumulative effective dose to an individual member of the public from such x-ray systems used in security screening of human should not exceed a control level of 0.25 mSv per year, the value obtained in this study for one organ (e.g. the thyroid) is high.
Due to a limited number of studies, an exact comparison cannot be made between the results of this study and other studies. However, these values were in the range (below 20 mGy) reported by Sabarudin et al. (15) and Mclaughlin and Mooney (16), although some differences in the methodologies used in these studies were observed. The values obtained in this study for the thyroid dose was similar to the values (0.37, 0.92 and 2.24 mGy) reported by Nikolic et al. using 320-multi detector CT and three different tube voltages (100, 120, KVp) as well as two different heart rates (60,75 beats per minute) (17). It has been demonstrated that the measured radiation dose is inversely proportional to the number of detector rows (14). Therefore, the values obtained in this study for thyroid dose are comparable with the values reported by Nikolic et al. who used 320-multi detector CT to measure the thyroid radiation dose.
A significant difference was observed in gonad dose between male and female subjects (81 μSv versus 112 μSv, total mean 96.5 μSv) (P = 0.026). The mean gonad dose in female subjects was greater than that in male subjects. This could be attributed to differences in male and female body height (174 ± 5.49 cm versus 161.9 ± 5.62 cm) causing scattering of radiation in female subjects that may have reached the pelvis region. The positioning of TLDs may also have resulted in the difference in mean gonad dose between male and female subjects. The magnitude of the gonad dose in this study was similar to the values reported by Sabarudin et al. (15) and Hohl et al. (18) for shielded testes.
In conclusion, it can be said that the total mean of radiation dose to the thyroid and gonads were 0.36 mSv, and 96.5 μSv, respectively. These values were high for one organ in a single study. Gender can affect the radiation dose to the thyroid and gonads. This can be attributed to the anatomical characteristic differences between the male and female subjects.


