


1. Background
2. Objectives
3. Patients and Methods
3.1. Patient and Healthy Volunteer Enrollment
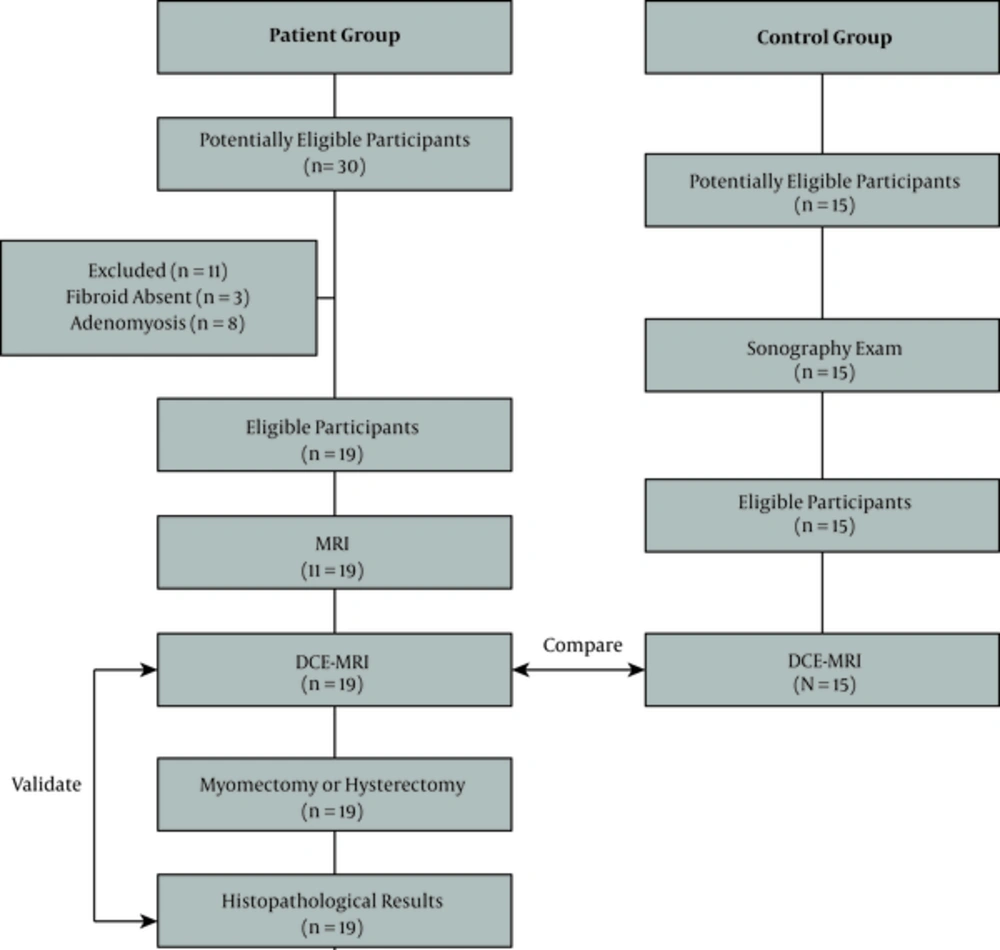
Flow of participants through the study
3.2. MRI Scanner and Imaging Protocol
3.3. Post-Acquisition Image Analysis
| Parameters | Descriptions |
|---|---|
| Ktrans, min-1 | Volume transfer constant for the transfer of contrast agent from the blood vessel into the extracellular extravascular space (EES). It reflects contrast delivery (perfusion) and transport across the vascular endothelium (permeability). |
| Kep, min-1 | Flux rate constant for transfer of contrast agent back from the EES into the blood vessel |
| Ve | Proportion of EES in the tissue |
| IAUGC | Initial area under the gadolinium concentration-time curve |
| TTP, s | Time-to-peak, which is the time taken for the contrast agent to reach its maximum concentration in the time-intensity curve |
Abbreviations: DCE-MRI, dynamic contrast-enhanced magnetic resonance imaging
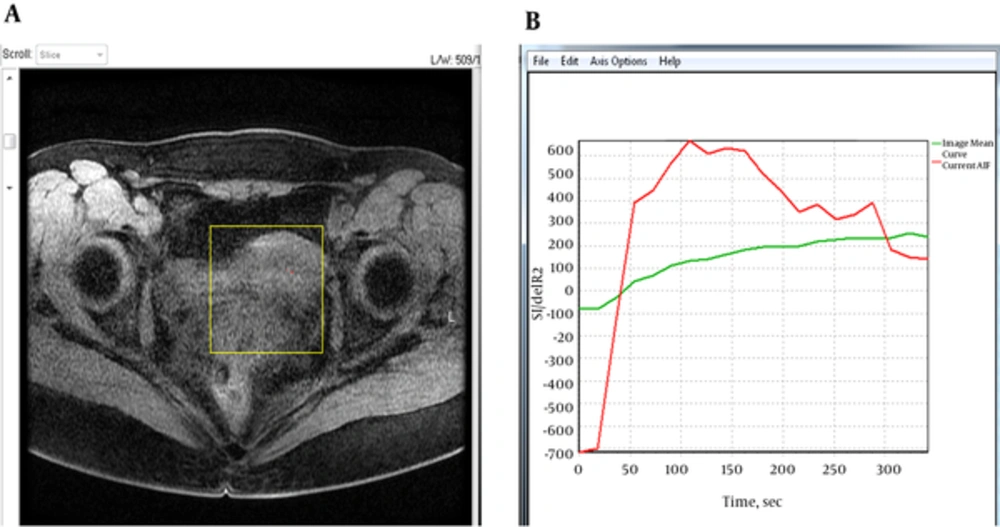
A, Example of an axial T1-weighted image of the pelvis with region of interest (yellow box) drawn over the uterus for quantitative dynamic contrast-enhanced magnetic resonance imaging (DCE-MRI) analysis. B, Mean signal intensity curve (green) and arterial input function (AIF) (red) for the selected tissues.
3.4. Statistical Analysis
4. Results
4.1. Patient Characteristics
4.2. Healthy Volunteers
4.3. Image Analysis and General Observations
4.4. DCE Characteristics of the Normal Uterus
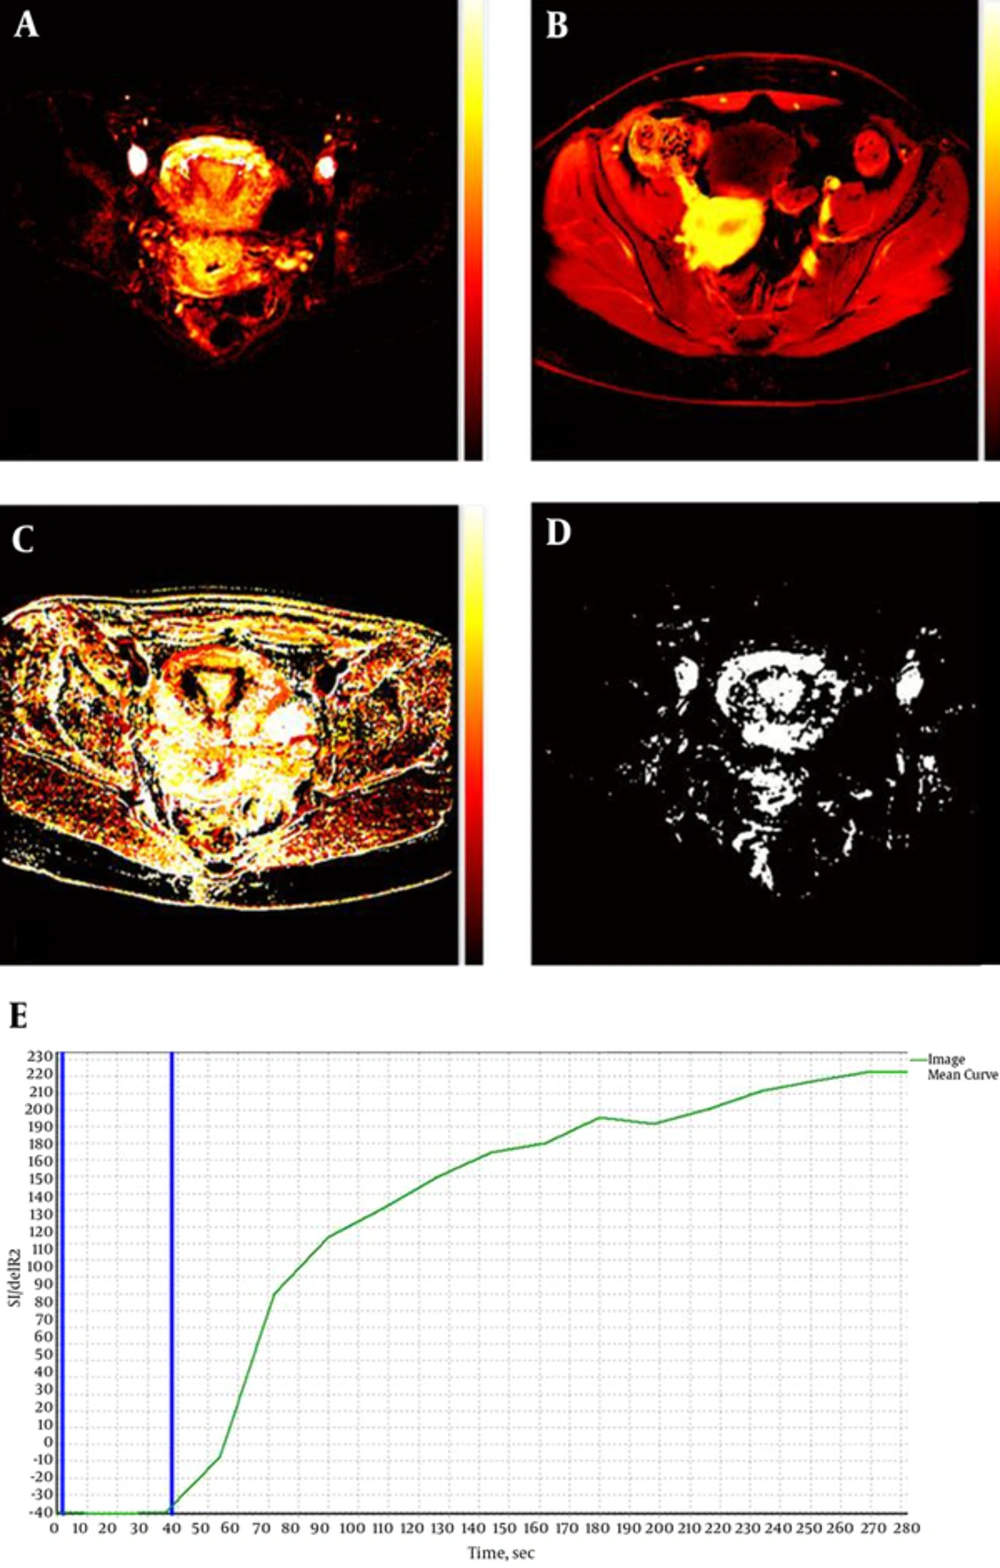
A-D, Semi-quantitative maps of a normal uterus acquired using the dynamic contrast enhanced magnetic resonance imaging (DCE-MRI) software. A, Ktrans; B, initial area under the gadolinium concentration time curve (IAUGC); C, time-to-peak (TTP); D, Ve. ; E, Time-intensity curve of the normal uterus. The two blue lines indicate bolus arrival time (~37 seconds).
| DCE-MRI Parameters | Normal Myometrium (n = 15) | Endometrium (n = 15) | Cervix (n = 15) | Fibroids (n = 19) | P Values (Normal Myometrium Versus Uterine Fibroids) |
|---|---|---|---|---|---|
| Ktrans, min-1 | 0.26 ± 0.13 | 0.20 ± 0.15 | 0.30 ± 0.13 | 0.50 ± 0.25 | 0.014a |
| Kep, min-1 | 0.30 ± 0.20 | 0.30 ± 0.18 | 0.30 ± 0.07 | 0.42 ± 0.22 | 0.215 |
| Ve | 0.50 ± 0.24 | 0.40 ± 0.27 | 0.50 ± 0.32 | 0.72 ± 0.33 | 0.032a |
| IAUGC | 1.70 ± 1.10 | 1.81 ± 0.82 | 1.70 ± 1.00 | 15.33 ± 0.58 | 0.057 |
| TTP, s | 159.50 ± 35.27 | 138.50 ± 17.71 | 143.25 ± 5.38 | 137.0 ± 47.7 | 0.825 |
Abbreviations: DCE-MRI, dynamic contrast-enhanced magnetic resonance imaging; IAUGC, initial area under the gadolinium concentration-time curve; TTP, time to peak; SD, standard deviation
aP < 0.05 shows a statistically significant difference.
bValues are expressed as mean ± SD
4.5. DCE Characteristics of the Fibroids
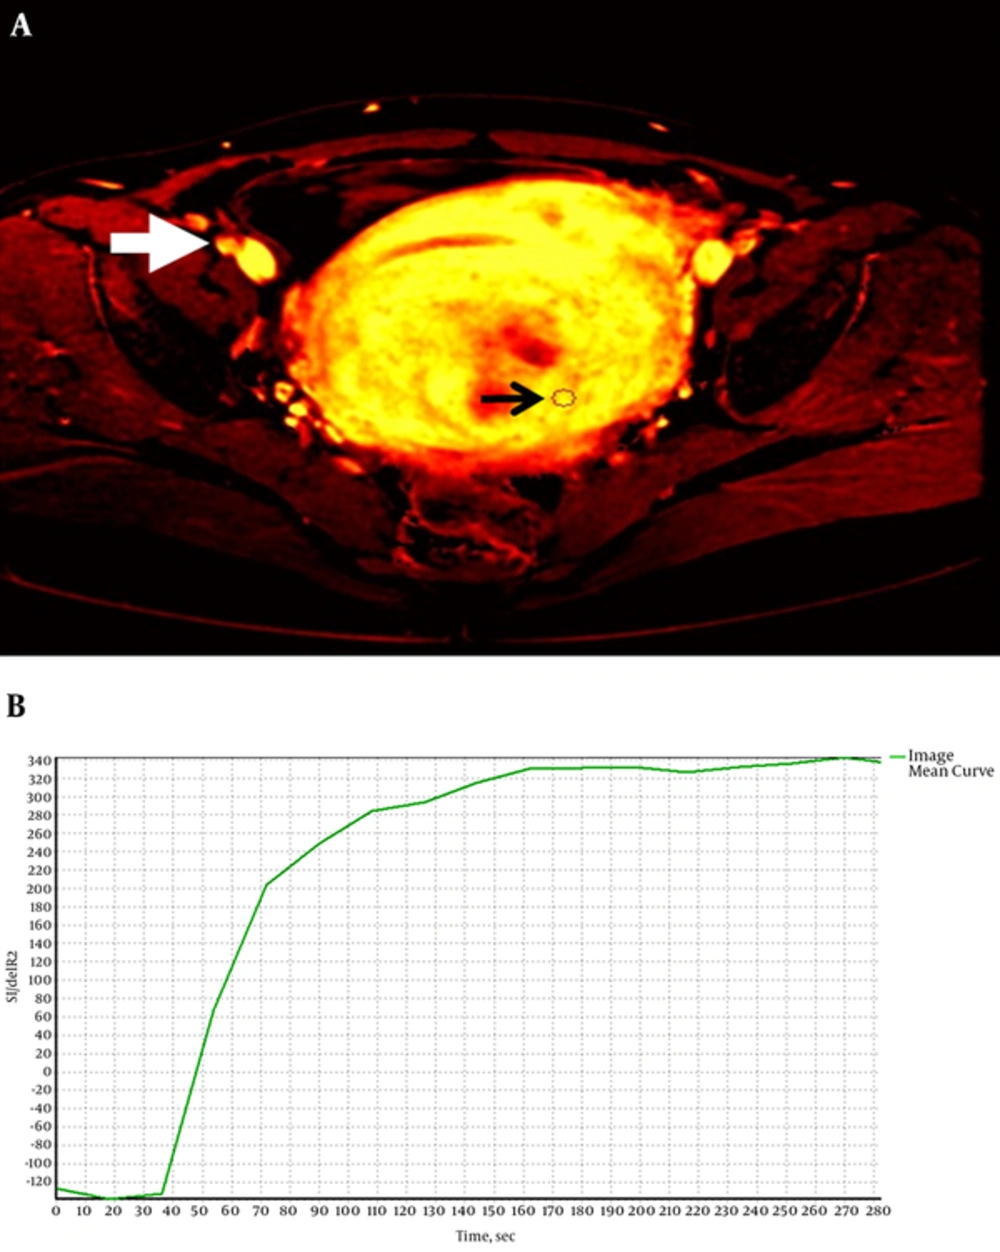
A and B, Time-intensity curve of an intramural uterine fibroid. The thick arrow points to the artery where arterial input function (AIF) was obtained and the thin arrow shows the region of interest (ROI) of the fibroid. Ktrans map of a patient with hyperintense (white) fibroid.
4.6. Comparison of DCE-MRI Parameters Between the Normal Uterus and Fibroids
| Positive If Ktrans ≥ | Sensitivity (%) | Specificity (%) | Positive if Ve ≥ | Sensitivity (%) | Specificity (%) |
|---|---|---|---|---|---|
| 0.00 | 100.0 | 0 | -0.90 | 100.0 | 0 |
| 0.08 | 100.0 | 7.7 | 0.15 | 94.1 | 0 |
| 0.15 | 94.1 | 23.1 | 0.25 | 82.4 | 21.4 |
| 0.23 | 70.6 | 46.2 | 0.32 | 76.5 | 35.7 |
| 0.28 | 70.6 | 53.8 | 0.37 | 76.5 | 42.9 |
| 0.31 | 64.7 | 61.5 | 0.45 | 76.5 | 50.0 |
| 0.36 | 64.7 | 76.9 | 0.52 | 70.6 | 71.4 |
| 0.42 | 64.7 | 84.6 | 0.62 | 70.6 | 78.6 |
| 0.47 | 64.7 | 92.3 | 0.75 | 64.7 | 78.6 |
| 0.60 | 41.2 | 100.0 | 0.85 | 58.8 | 85.7 |
| 0.75 | 23.5 | 100.0 | 0.95 | 29.4 | 0 |
| 0.85 | 5.90 | 100.0 | 2.00 | 0 | 0 |
| 1.00 | 0.0 | 100.0 |
a95% confidence interval is used.
