


1. Background
2. Methods
2.1. Reagents and Cell Lines
2.2. Cellular Viability Assay
2.3. P-Glycoprotein Activity Assays
2.3.1. Flow Cytometric Efflux Assay
2.3.2. Cell Swelling Assay
2.4. Apoptotic Assays
2.4.1. Annexin V/FITC
2.4.2. PARP Cleavage Assay
2.5. Gene Expression Studies
2.5.1. RNA Extraction, DNase I Treatment and cDNA Synthesis
2.5.2. PCR
| Gene | Primer | Size |
|---|---|---|
| Survivin-wt (wild type) (Real-time PCR) | 103 bp | |
| Forward | 5'- CGACCCCATAGAGGAACATA-3' | |
| Reverse | 5'-CCAGTTTCAAAAATTCACCAAG-3' | |
| Survivin (Semi-quantitative PCR) | 266 bp (survivin-wt) 148 bp (∆Ex3) | |
| Forward | 5'-CTTCATCCACTGCCCCAC-3' | |
| Reverse | 5'-CTTTCTCCGCAGTTTCCTC-3' | |
| Bax | 187 bp | |
| Forward | 5'- GCAAACTGGTGCTCAAGG -3' | |
| Reverse | 5'- ACTCCCGCCACAAAGA -3' | |
| Bcl-2 | 189 bp | |
| Forward | 5'-CGCATCAGGAAGGCTAGAGT-3' | |
| Reverse | 5'-AGCTTCCAGACATTCGGAGA-3' | |
| β2m | ||
| Forward | 5'- CTACTCTCTCTTTCTGGCCTG-3' | |
| Reverse | 5'- GACAAGTCTGAATGCTCCAC-3' | 191 bp |
| GAPDH | 493 bp | |
| Forward | 5'-AAGGTCATCCATGACAACTTTG-3' | |
| Reverse | 5'- GTCCACCACCCTGTTGCTGTAG-3' |
2.6. Statistical Analysis
3. Results
3.1. Effect of DNC on the Viability of MCF-7 and T47D Cells
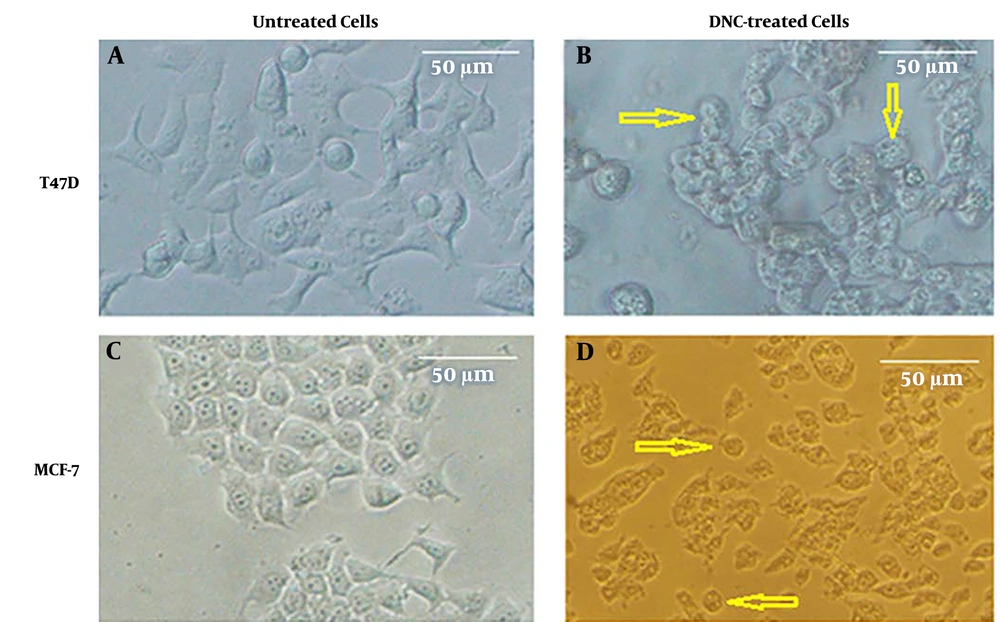
Cytotoxic effect of DNC on MCF-7 and T47D cell lines; A and B show T47D cells before and after treatment with DNC, respectively. Similar data were taken for MCF-7 cells (C and D). Apoptotic cells are marked with arrows.
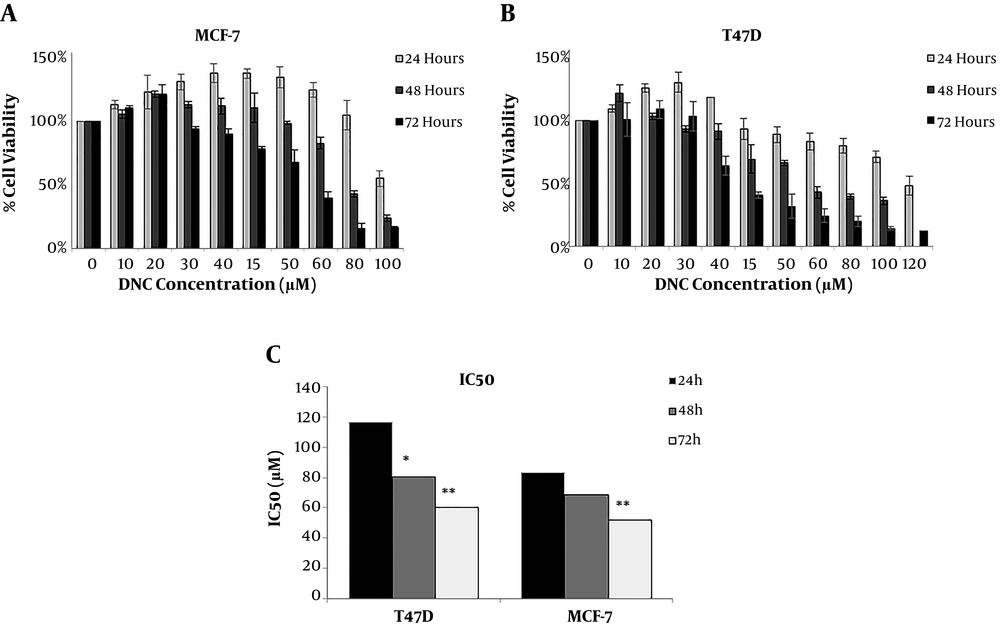
Cell viability of A: T47D and B: MCF-7 cell lines; C: The half-maximal inhibitory concentrations (IC50) of DNC at three different time intervals. Data are reported as Mean ± SD of three independent experiments. *: P < 0.05, **: P < 0.01.
3.2. DNC Impairs P-Glycoprotein Function
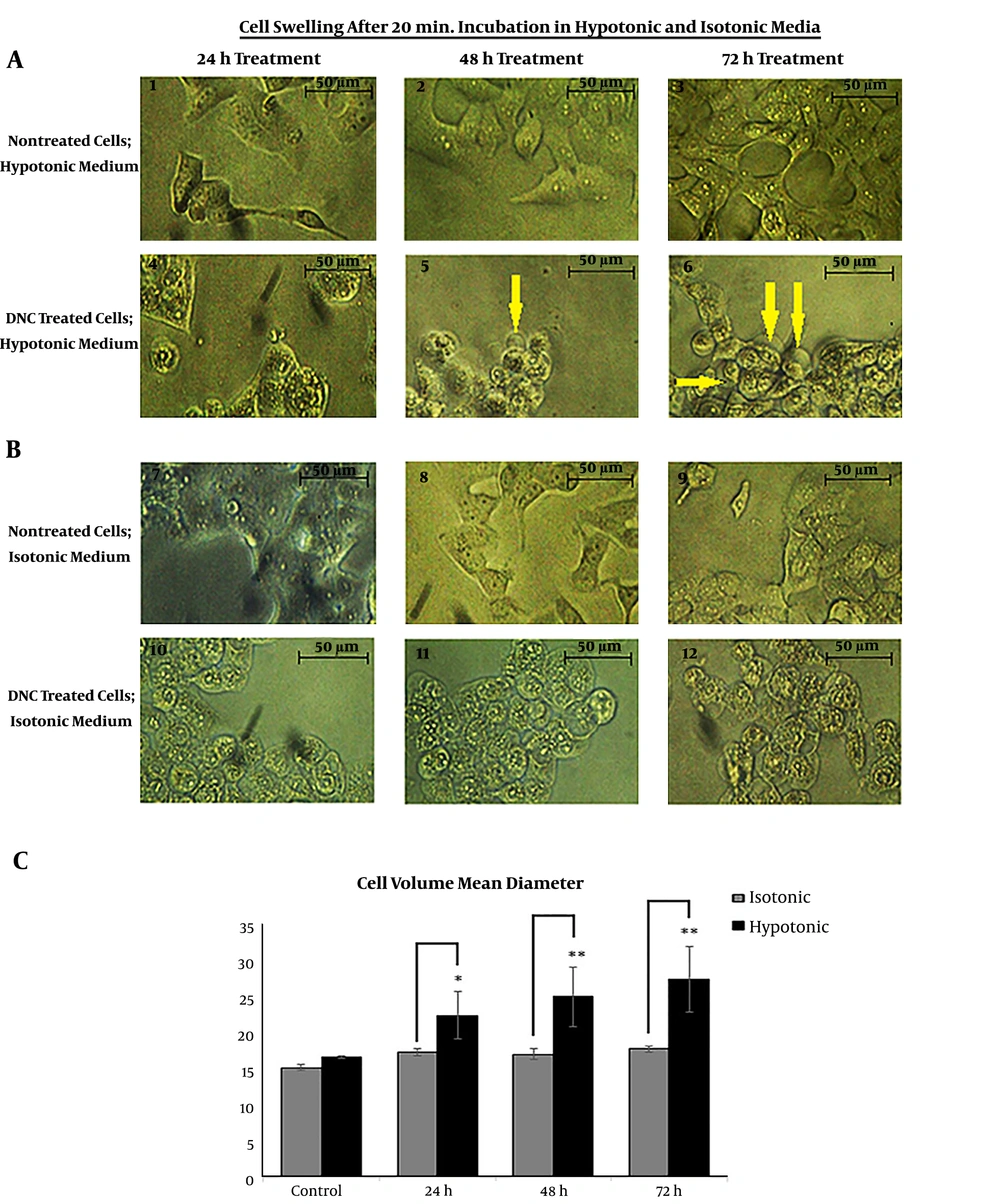
Cell swelling assay in hypotonic and isotonic media; A and B: Cell volume mean changes in T47D cells; Microscopic visualization confirmed changes in cellular volume as shown by arrows. C: The mean volume of DNC treated-T47D cells significantly increased under hypotonic condition (P Treatment time vs. cell diameter = 0.012 and P Cell diameter vs. medium condition = 0.001). The changes in cellular mean diameter in the isotonic condition is not significant (P = 0.15). Data are reported as mean ± SD of three independent experiments. *: P < 0.05, **: P < 0.01.
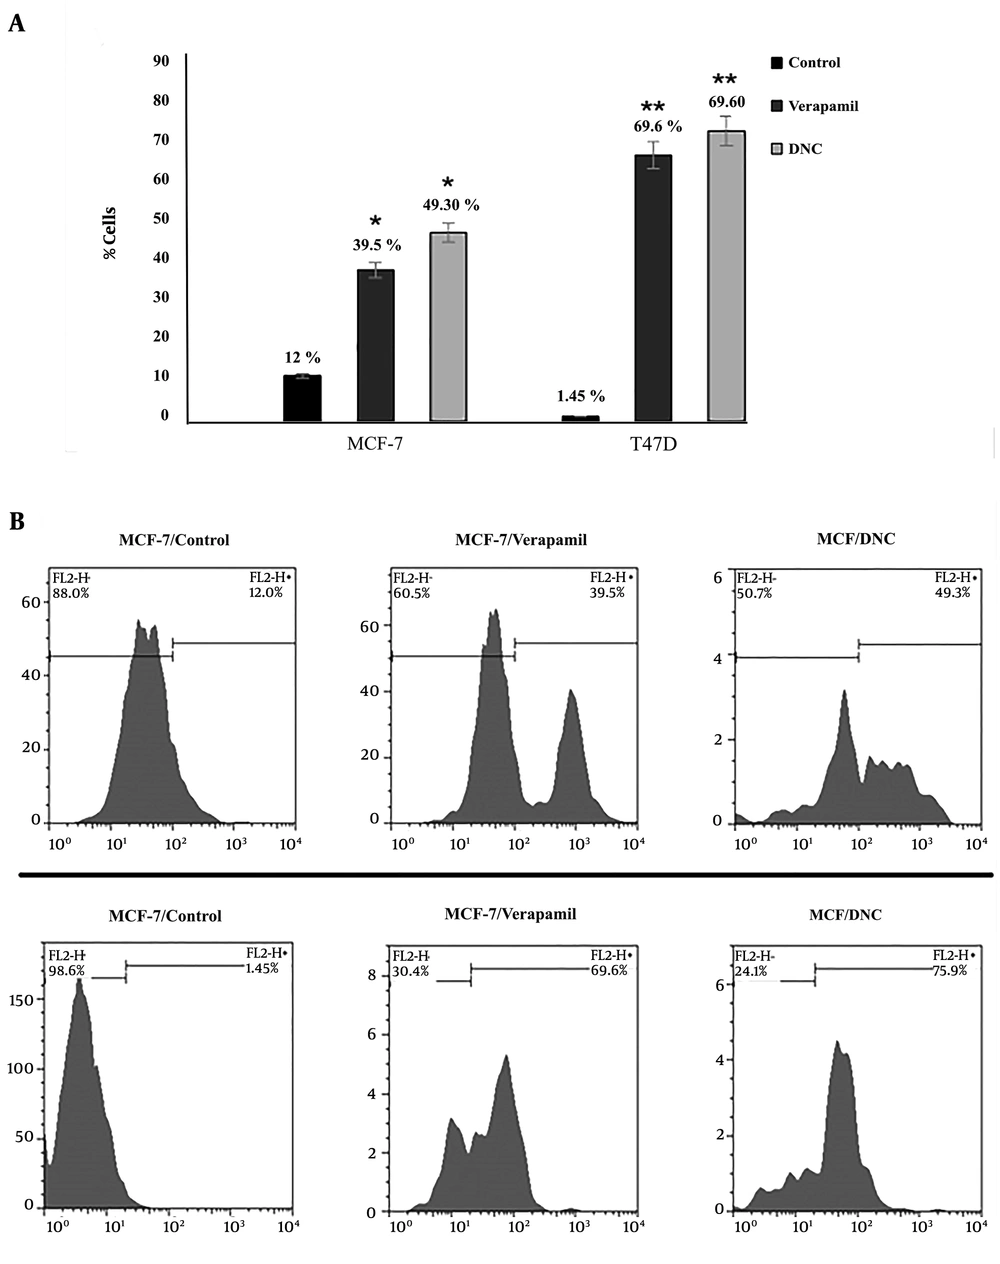
Efflux pump assay was used to evaluate the intensity of Rd 123 in DNC and verapamil treated cells. Flow cytometry detected a significant decrease in the efflux of Rh-123 in both DNC and Verapamil (as positive control) treated samples (P = 0.001). There were no significant differences between DNC and Verapamil function in deactivating P-gp. (P DNC vs. Verapamil > 0.05).
3.3. DNC Induces Apoptosis in Breast Cancer Cells
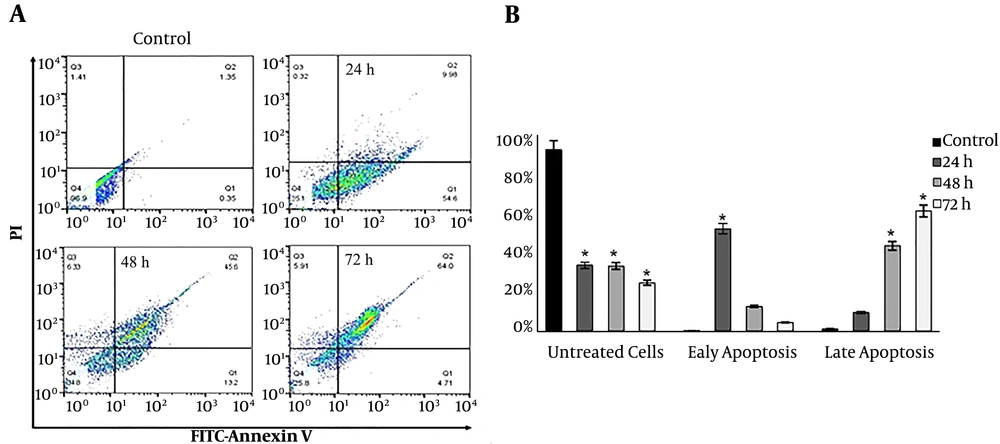
Study of apoptosis by Annexin V/FITC; A: Annexin-V-FLOUS/PI staining in T47D cells after 24, 48, and 72 h treatment with 60 µM DNC. B: The percentage of cells in early and late apoptosis (P ≤ 0.01). Data are reported as Mean ± SD of three independent experiments. *: P < 0.05, **: P < 0.01.
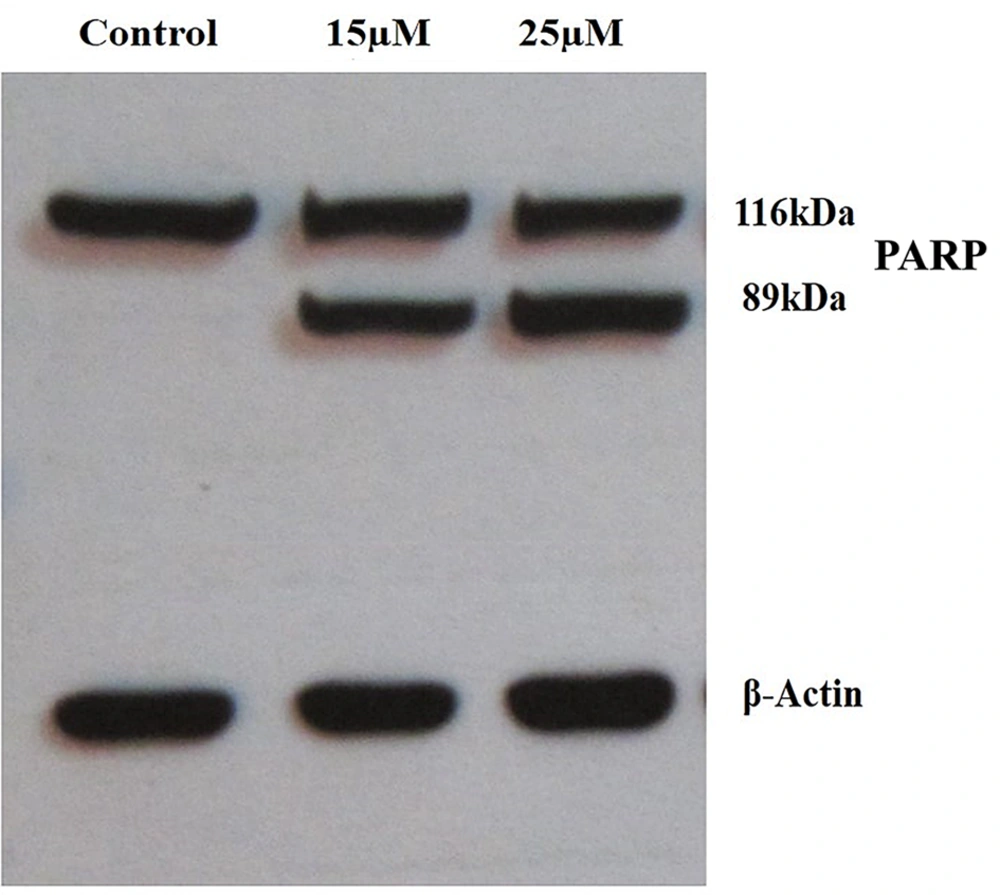
DNC induces apoptosis in MCF-7 cells treated with 15µM and 25µM for 48 h through caspase-dependent PARP cleavage. PARP protein is cleaved in DNC-treated cells.
3.4. Expression Profile of Pro- and Anti-Apoptotic Genes in DNC-Treated Cells
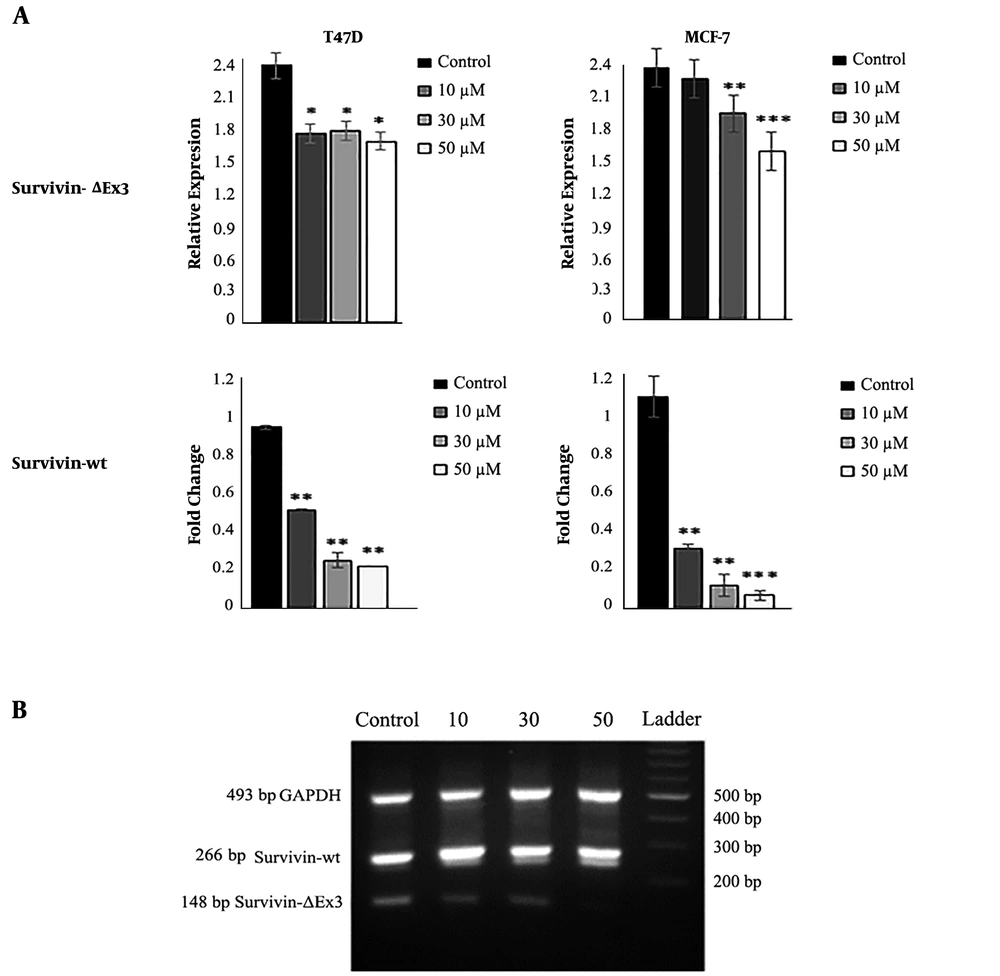
The expression of survivin (real-time PCR) and its splicing variant survivin-ΔEx (semi-quantitative PCR) in MCF-7 and T47D cells. B: Visualization of survivin-ΔEx expression on 1.5% agarose gel electrophoresis. The intensity of bands was evaluated by ImageJ in comparison with internal control. Data represent the mean ± standard deviation of three independent experiments. * P < 0.05, ** P < 0.01 and *** P < 0.001.
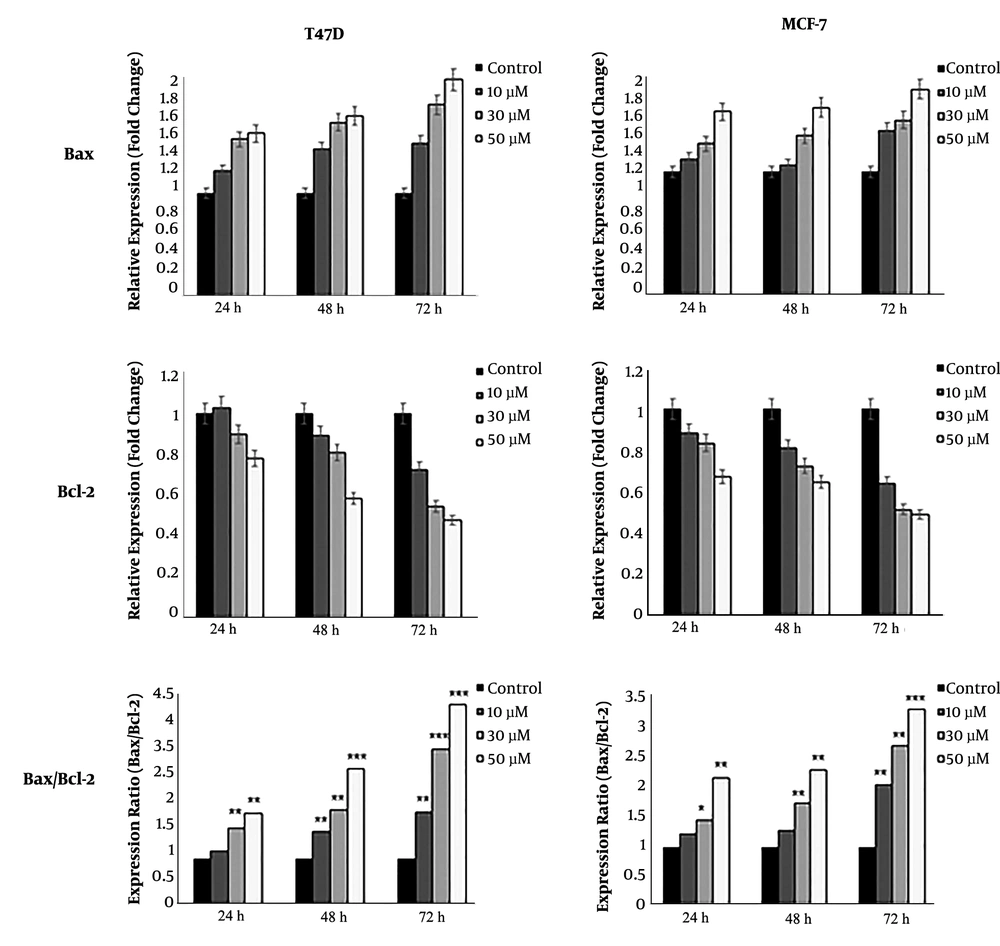
A: The expression ratio of Bax/Bcl-2 in MCF-7 and T47D cells treated with DNC after 72 hours. B: Detection of the expression of survivin and its spliced variants on gel electrophoresis in TD7D cells. The intensity of bands was analyzed by ImageJ software to semi-quantify data. Note that only three variants have been marked on gel. Data represent the mean ± standard deviation of three independent experiments. *P < 0.05, **P < 0.01 and *** P < 0.001.
