Materials and Methods
Cell Culture
MCF-7 cells and Fibroblast cells were cultured in high glucose DMEM medium (GIBCO, USA) supplemented with 10% FBS (GIBCO, USA) and 1% penicillin/streptomycin. The culture condition for all cell types were 37oC, 5% CO2 and 80% humidity. All cells were sub-cultured when reached 80% confluency.
Preparation of Compounds
A Total of four compounds were used in this research. Tamoxifen (Sigma-Aldrich, USA), nano-Curcumin (nanoCur) (Curcumin was purchased from Sigma-Aldrich, USA), nano-Tamoxifen (nanoTam) and nano-(Tamoxifen+Curcumin) (nanoTC).powder of Diblock polymer (OM200) was used for preparation of nano-carrier. The composition ratio of nano-compounds were: one part (
w/w) of the compound and five parts (
w/w) of the Diblock for nanoTam and nanoCur. NanoTC was developed from one part Tamoxifen, three parts (
w/w) Curcumin and twenty parts (
w/w) nano-polymer. The procedure was carried out as described before (
16-
17).
To simplify, hereafter, only the concentration of Tamoxifen will be mentioned for nanoTam and nanoTC and concentration of Curcumin will be mentioned for nanoCur. The ratio of compound to dendrosome was chosen based on obtaining maximum solubility and avoiding formation of sediments. For NanoTC, the ratio of 3:1 for curcumin:Dendrosome, was the maximum amount of curcumin to dendrosome that did not result in the formation of sedimentation.
Establishing Tamoxifen-Resistant MCF-7 cells
MCF-7 cells were continuously treated with Tamoxifen to establish Tamoxifen-resistant MCF-7 cells. Tamoxifen was added to the culture at the concentration of one unit below IC50. The concentration of Tamoxifen was increased gradually for the duration of four months. A total of 15 passages were carried out to obtain Tamoxifen resistant cells. At this point cells were resistant to two folds of the normal Tamoxifen IC50. The procedure was carried out as described before (
23)
Cell Viability Assay
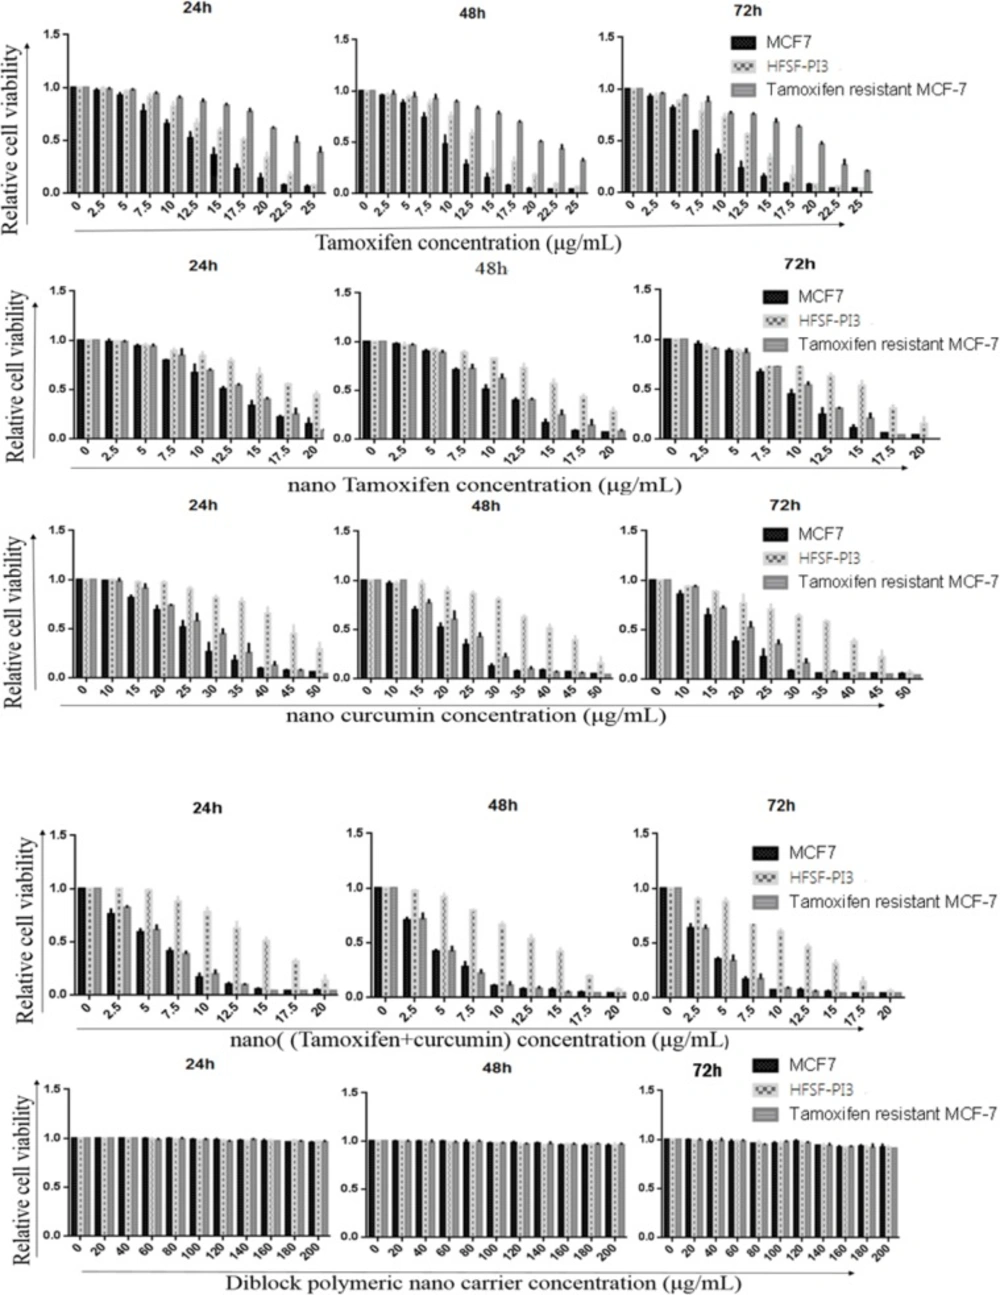
MethylthiaozolTetrazolium (MTT) assay was used to assess the cell viability after treatments of cells with each compound. Cells were collected by trypsinization at 70% confluency and seeded into wells of 96-well ELISA plate. For MCF-7, 8500, 6000, and 3500 cells per well were used for assays corresponding to 24, 48 and 72 h respectively, and for fibroblast cells, 6000, 5000 and 4000 cells per well were used for assays corresponding to 24, 48 and 72 h respectively (number of cells/well for each period of time was calculated based on the standard curves of each cell line). Before beginning the experiment, cells were cultured for 24 h. For analysis of the effects of each compound, in separate reactions, cells were treated with nanoTC, nanoTam, or Tamoxifen at concentrations ranging from 1 to 30 µg/mL or with nanoCur at concentrations ranging from 1 to 60 µg/mL. Diblock polymeric nano-carrier was used at concentrations ranging from 20 to 200 µg/mL as a control reaction to exclude false-positive results due to polymer toxicity. After incubation (24, 48 or 72 h), 20 µL of MTT solution (5 µg/mL) (Sigma-Aldrich, USA) was added to each well, and the plate was incubated for four hours. The supernatant was removed and 20 µL of dimethyl sulfoxide (DMSO) was added to the wells. The absorbance was read at 570 nm. All reactions were repeated three times.
Cell Cycle Analysis
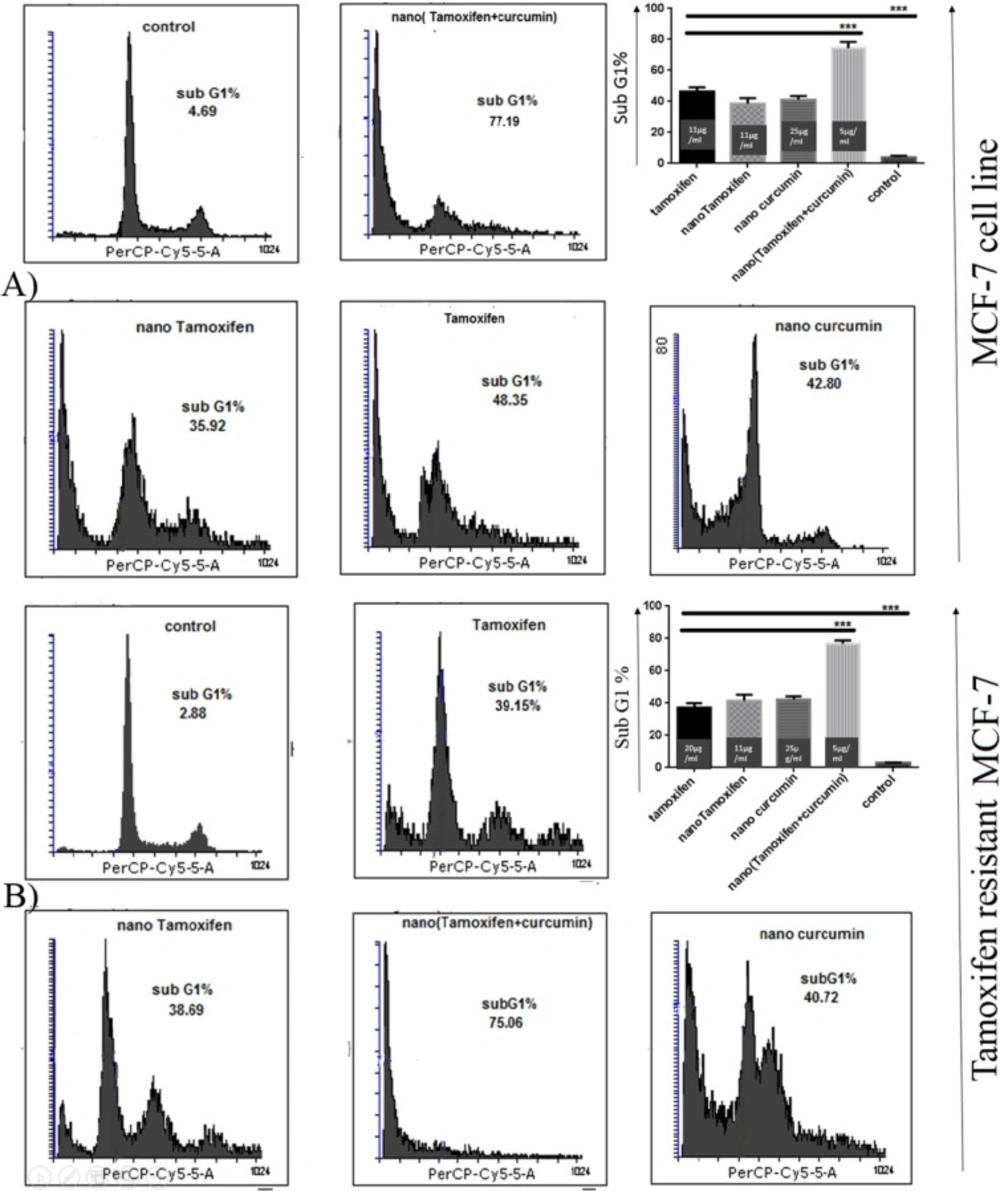
In separate reactions, cells were co-cultured with 1-3 µg/mL below the IC50 of Tamoxifen, nanoTam, nanoCur, and nanoTC. After incubation for 24 h cells were trypsinized and washed twice with PBS. Cells were fixed in 75% Ethanol for 24 h and washed twice with PBS. Cells were stained with 400 µL stain solution (2% of 1 µL/mLPropidium Iodide, 2% of 1 µg/mL RNASA and 0.1% Triton X-100). Cells were then analyzed via FACSCalibur™ flow cytometer (BD Biosciences, USA). DATA were analyzed by Flowing software.
Analysis of Apoptosis
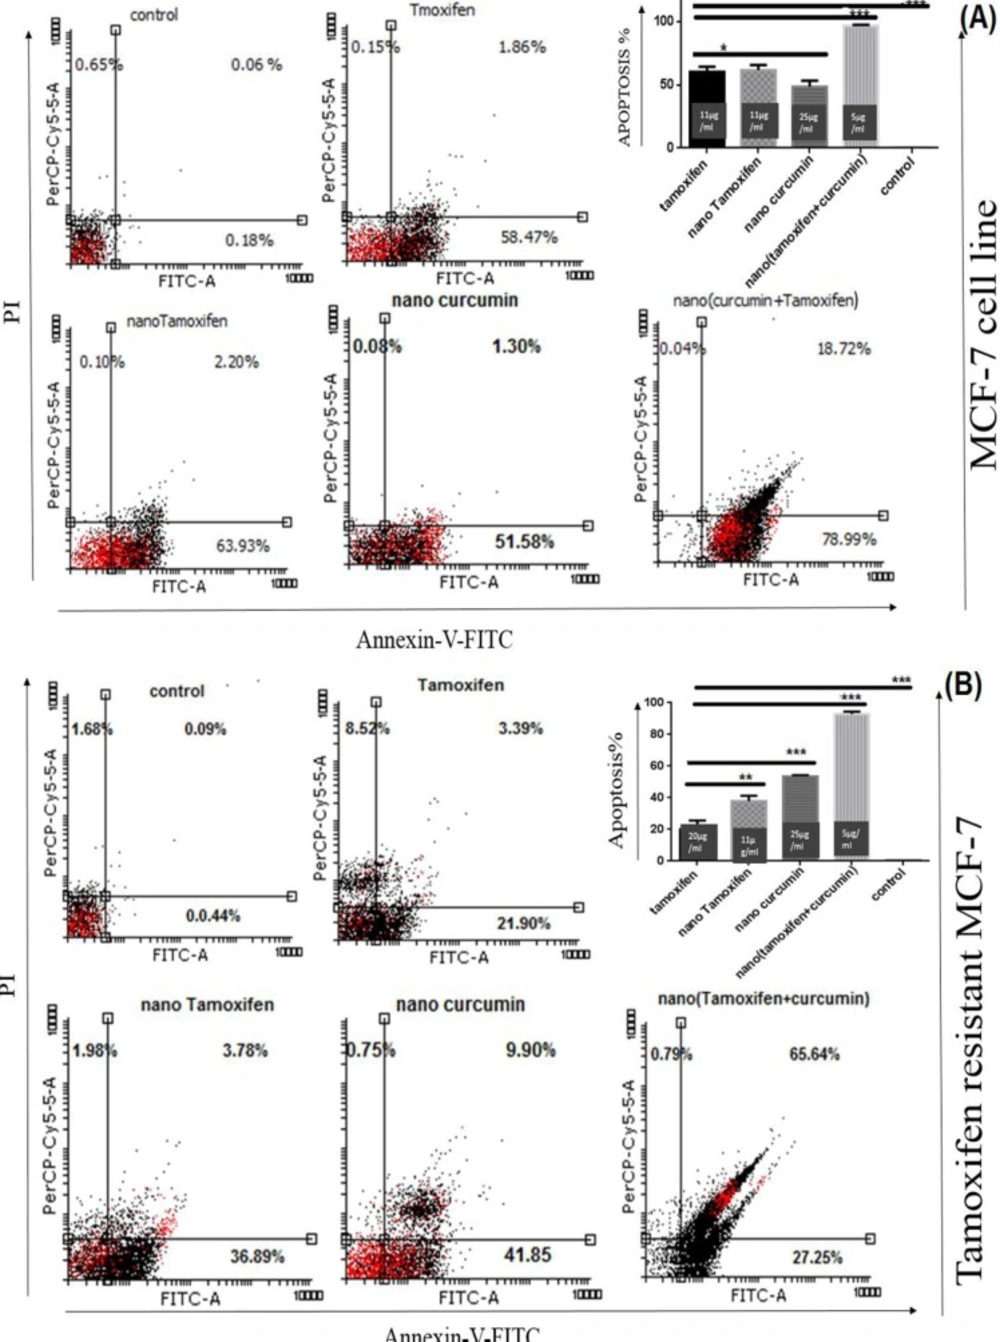
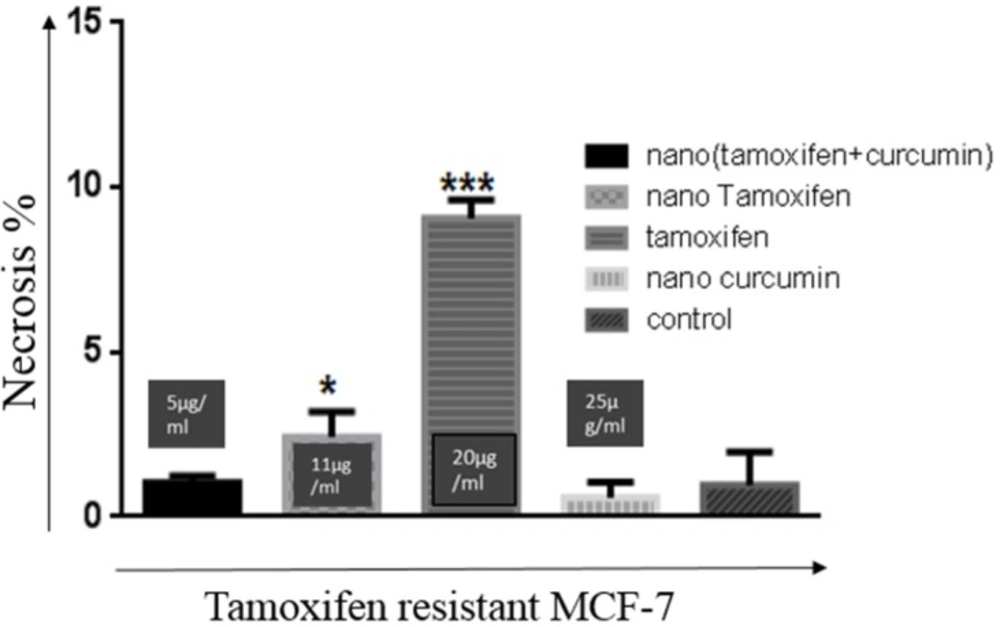
Apoptosis in cells treated with each of the four compounds was analyzed via Annexin-V-Fluos and PI staining kit (Roche, Germany) according to the manufacture’s instruction. FACSCalibur™ flow cytometer (BD Biosciences, USA) and Flowing software were used for analysis of data.
Real-Time PCR analysis
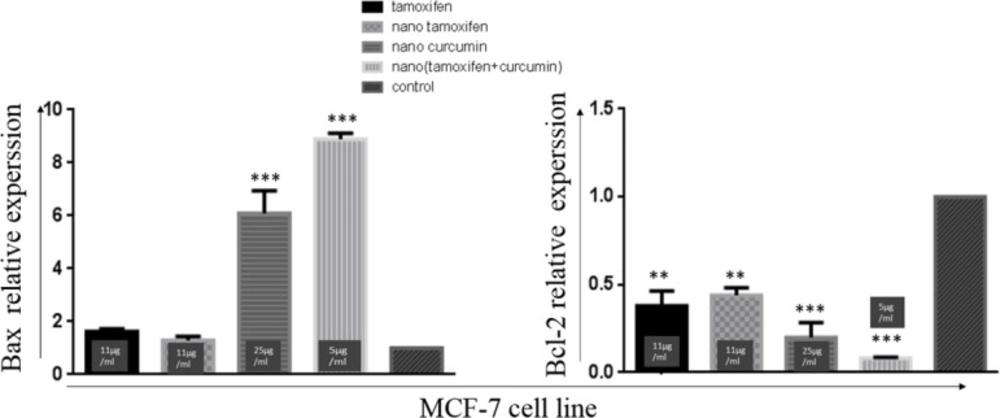
Total RNA was extracted via TRIzol reagent (Life Technologies) from cells treated with each of four compounds for 24 h treatment. Genomic DNA contamination was removed by DNase I (Thermo Fisher Scientific, USA) treatment. RNA was analyzed and quantified by electrophoresis and UV spectrophotometry. cDNA was synthesized using PrimeScript™ RT reagent kit (Takara Bio Inc, Japan). Real-Time PCR was carried out using SYBR Premix Taq™ (Takara, Japan). Results of Real-Time PCR were analyzed using 2-∆∆Ct method. Primers were designed using Oligo, Allel ID and Perl Primer software. Primers.
Statistical Analysis
All tests were repeated at least three times and mean was presented as the final result. Student’s t test was used to analyze the data. P value was used to determine the significance of the results. GraphPad Prism Software v5.0 was used for data analysis.