
1. Background
Coronavirus disease 2019 (COVID-19) is caused by severe acute respiratory syndrome coronavirus 2 (SARS‑CoV-2), a positive-sense single-stranded ribonucleic acid (RNA) virus belonging to the Betacoronavirus genus (1). The outbreak of COVID-19 occurred in Wuhan city of China, in December 2019; within 3 months, it was declared a pandemic that became a considerable public health burden on a global scale (2). As of November 2022, more than 628 million confirmed cases of COVID-19 and over 6.5 million deaths have been reported to the World Health Organization (WHO) (3). In Iran, around 7.5 million cases and 144 thousand deaths have been observed (4). Coronavirus disease 2019 causes a wide array of symptoms that might appear 2 to 14 days after exposure to SARS‑CoV‑2 (5), which span from mild to severe symptoms, including shortness of breath, fever, diarrhea, headache, dry cough, congestion or runny nose, sore throat, fatigue, loss of taste or smell, nausea and/or vomiting, and muscle or body aches (6, 7); however, about a third of infected individuals do not show specific symptoms (8).
Viruses of influenza H1N1, respiratory syncytial virus (RSV), adenoviruses, human coronavirus (HCoV)-229E, HCoV-HKU1, HCoV-OC43, HCoV-NL63, metapneumovirus, human bocavirus (HBoV) 1, 2, 3, parainfluenza 1, 2, 3, influenza B, and influenza A are examples of the RNA and deoxyribonucleic acid (DNA) viruses commonly circulating among vertebrates that cause symptoms similar to SARS-CoV-2 (9), although a few of them, such as HBoV, metapneumovirus, HCoV-NL63, and HCoV-HKU1, have only recently become prevalent (10-13). All the aforementioned viruses are important causes of cold, pneumonia, and shortness of breath in humans and are simultaneously prevalent in the cold seasons of the year. However, their presence has been generally overlooked during the COVID-19 pandemic. Currently, the diagnosis of infection with these viruses mostly relies on physical examination and clinical history, despite the fact that accurate molecular diagnosis is available (14).
2. Objectives
This study aimed to assess the presence of respiratory viruses in patients who exhibited clinical symptoms of COVID-19; however, they tested negative for SARS-CoV-2 in their initial examination. The results of this evaluation could be beneficial in developing effective control measures and more reliable testing and surveillance of such viruses and in making the diagnosis and treatment of COVID-19 less complicated.
3. Methods
3.1. Sample Collection
In this cross-sectional study, the oropharyngeal/nasopharyngeal swab specimens of 293 patients with clinical symptoms of COVID-19 who had been referred to Ghaem Hospital of Mashhad, Iran, within February to March 2022 were collected and evaluated for COVID-19 infection using the reverse transcription polymerase chain reaction (RT-PCR) test. Moreover, high-resolution computed tomography (HRCT) was also employed for this purpose. From this population, 123 patients that initially tested negative for COVID-19 using RT-PCR while showing some degree of lung involvement/damage in their HRCT results were selected. The patients with incomplete information and/or insufficient sample for secondary analysis were excluded from the study.
3.2. Nucleic Acid Extraction and Initial Detection of SARS-CoV-2
Total nucleic acid extraction was carried out by BehGene kits (Vista BehGene Biotechnology Co., Shiraz, Iran) from 200 µL oropharyngeal/nasopharyngeal swab specimens. Then, a portion of the specimens was used for the initial testing of SARS-CoV-2 nucleocapsid (N) and RdRp gene by Rotor-Gene Q instrument using the TaqMan real-time PCR method (Pishtaz Teb kits, Iran), both according to the instructions of the manufacturer. Afterward, the remaining samples were stored at -80°C for further analysis based on the results of initial testing.
3.3. Detection of Other Viral Respiratory Pathogens and Secondary Testing for SARS-CoV-2
After the initial testing for the presence of SARS-CoV-2, negative SARS-CoV-2 samples were further assessed to determine the presence of viral respiratory pathogens. The analysis for the detection of 17 viral respiratory pathogens was conducted by the multiplex TaqMan one-step real-time PCR method (Geneova HiTeq 17 Viro Respiratory Pathogen One-Step RT-PCR Kit, Iran) using the Rotor-Gene Q instrument, based on the conserved areas of influenza H1N1, influenza B, influenza A, SARS-CoV-2, HCoV-HKU1, HCoV-OC43, HCoV-NL63, HCoV-229E, metapneumovirus, RSV, HBoV1, 2, 3, parainfluenza 1, 2, 3, and adenovirus.
The results from each cycle of the instrument were systematically stored and presented as replication curves and cycle threshold (Ct) values for the viral samples and the internal controls separately. The Ct value represents the number of replication cycles required for the fluorescent signal to cross the threshold. The analysis of the data in this study was conducted in three stages; firstly, the results from the negative controls were assessed. The Texas Red, FAM, HEX, and CY5 channels should have presented no Ct values or values higher than 40. Secondly, the results presented by the positive controls were evaluated to ensure the primers and probes were working correctly, and the master mix had been stored properly. All the aforementioned channels should have demonstrated a sigmoid curve and Ct values below 35. Thirdly, the samples acquired from the subjects were assessed. The analysis was carried out in three separate tubes and four distinct channels in each tube.
In tube 1, the HEX channel was used as an internal control. Furthermore, the FAM channel, the Texas Red channel, and the CY5 channel were employed to assess the presence of SARS-CoV-2, influenza A, and influenza B, respectively. In tube 2, the presence of influenza H1N1 virus, HCoV-NL63/HCoV-229E viruses, metapneumovirus, and RSV was evaluated in the FAM, HEX, Texas Red, and the CY5 channel, respectively. In tube 3, the presence of HCoV-HKU1/HCoV-OC43 viruses, parainfluenza 1, 2, or 3, HBoV1, 2, or 3, and adenovirus was assessed in the FAM, HEX, Texas Red, and the CY5 channel, respectively.
3.4. Statistical Analysis
The student’s t-test and chi-square test were used for the analysis of the data. Additionally, SPSS software (version 20) was employed, and P < 0.05 was considered significant.
4. Results
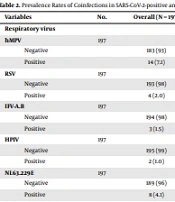
In this study, 123 patients referred to Ghaem Hospital of Mashhad were evaluated, comprising 63 males (51.2%) and 60 females (48.8%), with a mean, maximum, and minimum age of 58.4, 95, and 2 years, respectively. Among the subjects, 17 individuals consisting of 13 males (76.5%) and 4 females (23.5%) tested positive with regard to the presence of the 17 respiratory viruses assessed in this study; nevertheless, 106 individuals consisting of 50 males (47.2%) and 56 females (52.8%) tested negative (P = 0.02) (see Table 1). The mean age of those who had tested negative and positive was 59.42 ± 20.99 and 52.29 ± 26.62 years, respectively (P = 0.2). Among the patients who were included in this study, 99 (80.5%) and 24 (19.5%) cases were inpatients and outpatients, respectively. Moreover, 10 (58.8%) and 7 (41.2%) individuals in the former and latter groups were infected with 1 of the 17 respiratory viruses evaluated in the secondary analysis. Furthermore, the differential analysis revealed that out of 17 positive samples, 2 samples were infected with SARS-CoV-2, and 15 samples were infected with respiratory viruses other than SARS-CoV-2 (Figure 1 and Table 2).
Table 1.
Demographic Information and Hospitalization Unit of Patients Compared Between Positive and Negative Groups for 17 Respiratory Viruses a
| Variables | Frequency | Real-time PCR for 17 Respiratory Viruses | P-Value | |
|---|---|---|---|---|
| Positive | Negative | |||
| Age (y) | 119 | 0.2 | ||
| 17 | 52.29 ± 26.629 | |||
| 102 | 59.42 ± 20.994 | |||
| Gender (n =123) | 0.02 | |||
| Male | 63 (51.2) | 13 (76.5) | 50 (47.2) | |
| Female | 60 (48.8) | 4 (23.5) | 56 (52.8) | |
| Ward (n = 99) | 0.5 | |||
| Emergency | 44 (44.4) | 6 (60.00) | 38 (42.7) | |
| ICU | 36 (36.4) | 2 (20.0) | 34 (38.2) | |
| Surgery | 1 (1.00) | 0 (0) | 1 (1.1) | |
| Cardiac | 7 (7.1) | 1 (10.0) | 6 (6.7) | |
| Thoracic | 2 (2.0) | 0 (0.0) | 2 (2.2) | |
| Neurology | 6 (6.1) | 0 | 6 (6.7) | |
| CCU | 1 (1.00) | 0 (0.0) | 1 (1.1) | |
| Acute respiratory | 2 (2.00) | 1 (10.0) | 1 (1.1) | |
| Total | 99 | 10 | 89 | |
Abbreviations: PCR, polymerase chain reaction; ICU, intensive care unit; CCU, coronary care unit.
a Values are expressed as mean ± standard deviation or No. (%).
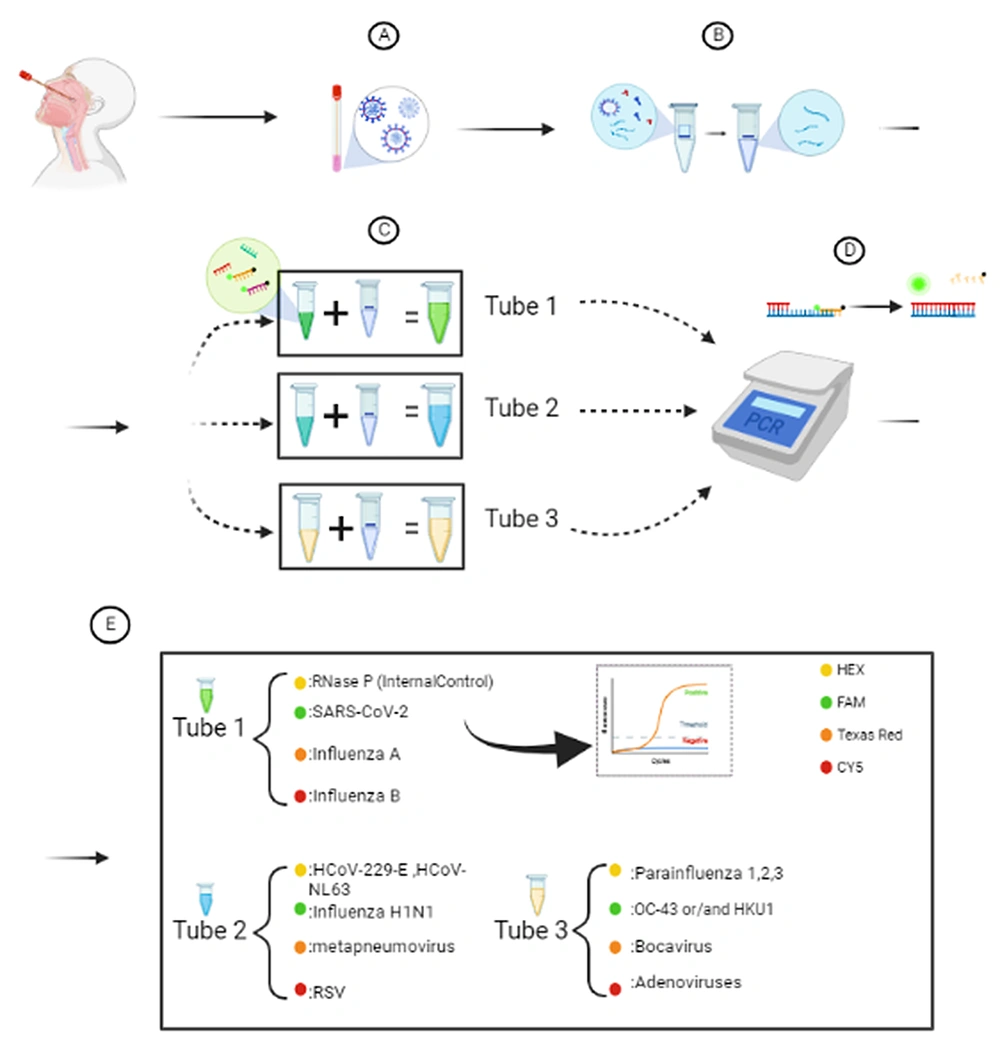
Figure 1.
Extraction and evaluation process and pathogens assessed in each tube; A, sample collection; B, genome extraction; C, adding HiTeq 17 Viro MastermiaxR 1,2,3 to each sample separately; D, reverse transcription polymerase chain reaction (RT-PCR) cycle process; E, analysis of results of RT-PCR. Created with Biorender.com.
Table 2.
Respiratory Viruses Detected Among the Samples Initially Tested Negative for Acute Respiratory Syndrome Coronavirus 2
| Virus | Sample No. | Pertaining |
|---|---|---|
| SARS-CoV-2 | 40, 93 | 2 |
| Influenza A | 2, 11, 12, 15, 16, 77, 107, 111 | |
| HCoV-NL63, HCoV-229-E | 3 | |
| RSV | 91, 96, 103, 122 | |
| HKU1, OC-43 | 113 | |
| Parainfluenza | 18 |
Abbreviations: SARS-CoV-2, acute respiratory syndrome coronavirus 2; HCoV, human coronavirus; RSV, respiratory syncytial virus.
The Ct values of the negative controls in this study were higher than 40, indicating the absence of any contamination. Moreover, the positive controls demonstrated sigmoid curves and Ct values less than 35, suggesting that the master mix, primers, and probes were fully functional. In tube 1, the HEX channel demonstrated sigmoid curves with Ct values of less than 40, meaning that nucleic acid extraction and complementary DNA (cDNA) synthesis were conducted correctly. The curve analysis of Figure 2 included several points; the FAM channel showed the positivity of two samples for SARS-CoV-2 (11.8%), samples number 40 and 93. In the Texas Red channel, the same results showed the presence of influenza A virus in 8 samples (47.1%), which were number 1, 11, 12, 15, 16, 77, 107, and 111. No sample in the CY5 channel indicated the presence of the influenza B virus.
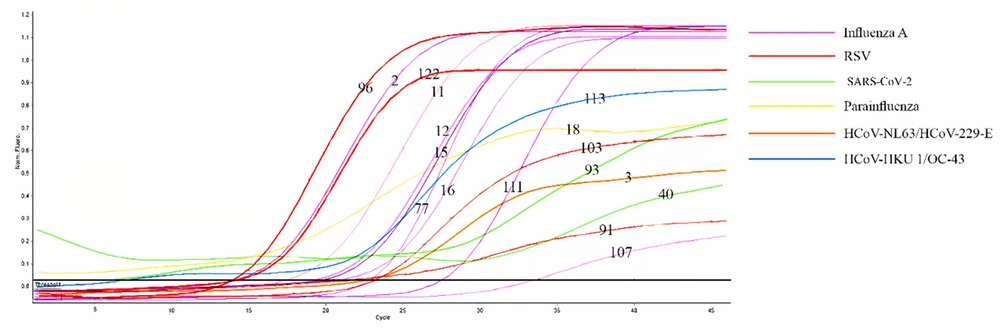
Figure 2.
Cycle threshold of patients positive for 1 of the 17 respiratory viruses
In tube 2, no influenza H1N1 virus was observed in the FAM channel, and no metapneumovirus was discovered in the Texas Red channel. However, 1 HCoV-NL63/HCoV-229E virus (5.9%) was detected according to the results of the HEX channel, in sample number 3, and 4 RSVs (23.5%) were observed based on the results of the CY5 channel, in samples 91, 96, 103, and 122. Furthermore, in tube 3, sigmoid curves and Ct values of less than 40 indicated the presence of 1 HCoV-HKU1/HCoV-OC43 virus (5.9%) in the FAM channel in sample number 113 and 1 parainfluenza 1, 2, or 3, individually or simultaneously, was observed based on the results obtained from the HEX channel, in sample number 18 (5.9%). No HBoV1, 2, or 3 in the Texas Red channel and no adenovirus in the CY5 channel were observed.
In Table 3, a comparative analysis between various laboratory indicators and the presence of respiratory viruses shows no statistically significant correlation, with the exception of the prothrombin time (PT) test (P = 0.01).
Table 3.
Comparative Analysis Between Various Laboratory Indicators and Presence of 17 Respiratory Viruses
| Variables | No. | Mean ± SD | Real-time PCR for 17 Viruses | P-Value | |||
|---|---|---|---|---|---|---|---|
| Positive | No. | Negative | No. | ||||
| WBC, 103/μL | 97 | 11.529 ± 6.5430 | 9.550 | 10 | 11.756 | 87 | 0.31 |
| RBC, 106/μL | 96 | 4.02 ± 0.86 | 3.8422 | 9 | 4.0447 | 87 | 0.5 |
| PLT, 103/μL | 96 | 208.67 ± 117.463 | 202.10 | 10 | 209.43 | 86 | 0.85 |
| PT, s | 90 | 19.170 ± 27.5835 | 39.94 | 10 | 16.57 | 80 | 0.01 |
| PTT, s | 89 | 33.00 ± 11.967 | 32.56 | 9 | 33.05 | 80 | 0.09 |
| INR | 89 | 1.32 ± 0.62 | 1.17 | 9 | 1.3 | 80 | 0.4 |
| ESR, mm/h | 79 | 47.49 ± 35.057 | 63.57 | 7 | 45.93 | 72 | 0.2 |
| BS, mg/dL | 64 | 147.92 ± 86.071 | 121 | 7 | 151.25 | 57 | 0.38 |
| Urea, mg/dL | 99 | 62.41 ± 50.298 | 66.1 | 10 | 62 | 89 | 0.8 |
| Creatinine, mg/dL | 99 | 1.49 ± 1.56 | 1.45 | 10 | 1.53 | 89 | 0.7 |
| ALT, U/L | 79 | 51.67 ± 117.738 | 32 | 9 | 54.20 | 70 | 0.59 |
| AST, U/L | 82 | 59.10 ± 115.462 | 24.8 | 10 | 63.86 | 72 | 0.31 |
| ALP, U/L | 78 | 343.81 ± 464.48 | 335.80 | 10 | 344.99 | 68 | 0.95 |
| Bili total, mg/dL | 76 | 1.152 ± 1.0957 | 0.73 | 9 | 1.2 | 67 | 0.22 |
| Bili direct | 76 | 0.593 ± 0.9418 | 0.27 | 9 | 0.63 | 67 | 0.28 |
| CRP, mg/L | 87 | 93.44 ± 74.69 | 101.07 | 9 | 92.5 | 78 | 0.74 |
| LDH, U/L | 55 | 882.65 ± 625.245 | 658.60 | 5 | 905.06 | 50 | 0.4 |
Abbreviations: PCR, polymerase chain reaction; SD, standard deviation; WBC, white blood cell; RBC, red blood cell; PLT, platelets; PT, prothrombin time; PTT, partial thromboplastin time; INR, international normalized ratio; ESR, erythrocyte sedimentation rate; BS, blood sugar, ALT, alanine transaminase; AST, aspartate aminotransferase; ALP, alkaline phosphatase; CRP, C-reactive protein; LDH, lactate dehydrogenase.
5. Discussion
Since the onset of the COVID-19 pandemic, regular testing for the presence of viral respiratory pathogens has mostly been conducted for the detection of SARS-CoV-2, resulting in the negligence of infections caused by other viral respiratory pathogens. As the timely diagnosis of such infections is of utmost necessity for the proper management of patient symptoms in this study, it was tried to determine the respiratory viruses causing symptoms similar to SARS-CoV-2 in patients suspected to have COVID-19. According to the current study’s results, out of 123 patients that had been suspected of having COVID-19 based on their clinical symptoms yet tested negative for COVID-19, 17 patients were infected with a viral respiratory pathogen. Among the infected subjects, 2 cases were infected with SARS-CoV-2, 8 cases with influenza A, 4 cases with RSV, 1 case with HCoV-NL63/HCoV-229-E, 1 case with HKU1/OC-43, and 1 case with parainfluenza.
In a study conducted in 2020, individuals who tested positive and negative for SARS-CoV-2 were evaluated by RPPCR2 or Flu/RSV. Only around 3% of those who were positive for SARS-CoV-2 had concurrent infections; however, among the patients that tested negative for SARS-CoV-2, around 13% were observed positive for at least one non‐SARS‐CoV‐2 respiratory virus (15). This finding could be related to the claim that some viruses can interfere with the ability of other viruses to cause an infection. This could be the reason behind the high prevalence of RSV and influenza A among the present study’s subjects, given that they had tested negative for SARS-CoV-2.
Another study compared respiratory viruses in addition to SARS-CoV-2 and atypical bacteria in patients testing positive and negative for COVID-19 (16). No infection with rhinovirus was observed in their COVID-19-positive patients; however, 12 cases of infection with rhinovirus were detected among COVID-19-negative subjects, indicating that an increase in the circulation of one respiratory virus could typically suppress the circulation of other respiratory viruses (17, 18). On the other hand, a study based in California, USA, that investigated coinfection rates between SARS-CoV-2 and other respiratory pathogens revealed that 20.7% and 26.7% of their SARS-CoV-2 positive and negative subjects, respectively, were also positive for one or more additional pathogens, with no statistical significance (19).
In a study that assessed the prevalence of 17 respiratory pathogens other than SARS-CoV-2 among 6235 Brazilians, 70 individuals tested positive for HCoV-NL63, 29 for HKU1, 12 for OC-43, and 14 for HCoV-229-E, most of whom were negative for SARS-CoV-2 (20). The aforementioned findings suggest that the immunity induced by such infections might have provided their patients with a protective, cross-reactive response against SARS-CoV-2. Accordingly, in the present study, 2 out of 17 patients positive for respiratory viruses were infected with HCoV-NL63/HCoV-229-E and HKU1/OC-43. Additionally, in a cohort assessing more than 800,000 individuals who had common cold symptoms in the year before the pandemic of COVID-19, there was a reduced chance of infection with SARS-CoV-2, possibly due to prior coronavirus infections (21).
Although all subjects of the current study demonstrated mild to severe levels of lung involvement/damage in their HRCT, 106 individuals tested negative for the presence of viral respiratory pathogens in both the initial and secondary testing. Given that all the samples were tested for respiratory viruses twice, the possibility of the presence of an infection in the samples negative for both stages of the assessment is considered insignificant. In the current study, all the samples tested negative for the presence of SARS-CoV-2 in the initial testing; nevertheless, 2 samples tested positive in this regard in the secondary examination. This could be related to false negative PCR results in the initial testing due to the degradation of purified RNA, the presence of RT-PCR inhibitors, or technical errors in conducting PCR.
The secondary testing for the detection of SARS-CoV-2 was implemented due to the higher specificity and sensitivity of the second kit. This is because the second kit uses RNA as an internal control; nonetheless, the first kit employs DNA. This is believed to be beneficial due to the fact that the inactivation of RNA in any steps of sampling, transportation of samples, or sample storage while using the first kit could provide false negative results. In addition, the secondary analysis for SARS-CoV-2 was considered to be a confirmation test, given that a different portion of the SARS-CoV-2 genome was applied as the target in comparison to the initial analysis.
5.1. Conclusions
According to the present study’s results, even during the COVID-19 pandemic, viral respiratory pathogens, in addition to SARS-CoV-2, are circulating in society with high prevalence. Therefore, surveillance of such pathogens is critical in the management of their spread and in the provision of timely care for patients with critical conditions. Moreover, epidemiological evaluations have revealed that the high prevalence of a certain respiratory virus could restrict the spread of other respiratory viral infections due to the induction of cross-reactive immunity. This could be the reason behind the lower prevalence of respiratory viruses in addition to SARS-CoV-2 in patients positive for COVID-19 and the higher prevalence of such pathogens in patients negative for COVID-19. In this study, the low number of clinical samples, the single-center nature of the study, and no assessment of the presence of bacterial respiratory pathogens were among the study limitations. Addressing such limitations could aid future studies in achieving more conclusive results.