
1. Background
Pseudomonas aeruginosa, characterized by its rod-shaped morphology and Gram-negative nature, exhibits exceptional adaptability to various environmental conditions, establishing it as a notable opportunistic pathogen in hospital environments (1). The global prevalence of multidrug-resistant (MDR) strains poses a formidable challenge to effective treatment strategies for P. aeruginosa (2). The formation of biofilms by P. aeruginosa is a major challenge in the progression of persistent infections, especially in cases of cystic fibrosis and burn injuries. Strains that produce biofilms show significant resistance to antimicrobial substances. A biofilm is defined as a complex assembly of microbial cells enveloped by extracellular substances, including proteins, exopolysaccharides (EPS), and extracellular DNA (eDNA), playing a critical role in these processes (3-5).
Various phenotypic and genotypic methods are available for analyzing longitudinal surveys of sources (6). Phenotypic subtyping methods generally exhibit low sensitivity and discrimination and are challenging to reproduce. In contrast, genotypic methods are recognized for their higher sensitivity and reliability (7). Several genotypic methods have been developed for bacterial typing, including repetitive element palindromic PCR (rep-PCR), restriction fragment length polymorphism (RFLP), ribosomal DNA (ribotyping), random amplification of polymorphic DNA (RAPD), multilocus sequence typing (MLST), and pulsed-field gel electrophoresis (PFGE). Each of these methods has its disadvantages (8). For instance, although PFGE, considered the gold standard typing method, exhibits high discrimination power, it is also known to be time-consuming, expensive, and challenging to interpret (9).
In recent years, multiple-locus variable-number tandem repeat analysis (MLVA) has emerged as a prominent method for typing P. aeruginosa strains. This molecular typing technique subtypes microbial isolates based on repeated DNA sequences at defined loci (VNTR). Notably, MLVA offers high discriminatory power and high-throughput screening, making it cost-effective, easily implementable, rapid, and reliable. Consequently, MLVA is well-suited for interlaboratory comparisons during epidemiological investigations of infections and is increasingly preferred for molecular typing of bacteria (10).
2. Objectives
The present study aimed to investigate the antimicrobial profiles and genetic diversity of biofilm-producing P. aeruginosa strains using the MLVA method.
3. Methods
3.1. Sampling and Identification
This cross-sectional study was conducted over one year (2020 - 2021) and involved collecting 79 non-repetitive clinical isolates from hospitalized patients at Rohani Hospital in Babol, northern Iran. Routine identification methods were used to confirm the identity of each isolate as P. aeruginosa. These methods included observing colony morphology and pigment production, performing Gram staining, oxidase test, triple sugar iron (TSI) agar, sulfur indole motility (SIM) test, Simmons citrate, and oxidative-fermentative (OF) test (Merck, Darmstadt, Germany), and assessing growth at 42°C. Isolates were preserved in brain-heart infusion broth (Becton Dickinson, Franklin Lakes, NJ) supplemented with 20% (v/v) glycerol (Merck Co., Germany) and stored at -80°C. P. aeruginosa ATCC 27853 was used as the control.
3.2. Antimicrobial Susceptibility Testing (AST)
Antibiotic resistance profiles were determined using the following antibiotics: Piperacillin (PRL, 100 µg), piperacillin-tazobactam (PTZ, 100/10 µg), ticarcillin (TC, 75 µg), ticarcillin-clavulanate (TCC, 75/10 µg), levofloxacin (LEV; 5 µg), ceftazidime (CAZ; 30 µg), ceftriaxone (CRO, 30 µg), imipenem (IPM; 10 µg), chloramphenicol (CHL, 30 µg), gentamicin (GM; 10 µg), ciprofloxacin (CIP; 5 µg), and tetracycline (TET; 30 µg) (MAST Diagnostics, Merseyside, UK). The disk agar diffusion (DAD) method was used on cation-adjusted Mueller-Hinton agar (Merck, Darmstadt, Germany) following Clinical and Laboratory Standards Institute (CLSI) guidelines (11).
3.3. Biofilm Production Assay
The microtiter plate assay was used to quantitatively assess biofilm production. Briefly, 200 µL of diluted bacterial culture from a 24-hour growth in brain-heart infusion (BHI) broth was inoculated into a 96-well plate. After incubation at 37°C for 24 hours, wells were washed twice with phosphate-buffered saline (PBS, pH 7.2) to remove unattached 'planktonic' bacteria. Plates were then vigorously shaken to eliminate all non-adherent bacteria and air-dried at 25°C to fix the biofilm. The biofilm was stained with 200 µL of 0.1% crystal violet (Sigma, St Louis, USA) for 5 minutes at 25°C, followed by washing and air-drying. Optical density (OD) was measured at 570 nm using an ELISA reader (BioTek, Bad Friedrichshall, Germany). All tests were performed in triplicate. Biofilm production was categorized based on the cut-off value (ODc) as non-biofilm (OD570 < 1), weak (1 < OD570 < 2), moderate (2 < OD570 < 3), and strong (OD570 > 3) (12).
3.4. DNA Extraction
Template DNA was extracted from fresh colonies utilizing the Bacteria Genome DNA Extraction Kit (TaKaRa, Dalian, China) and subsequently stored at –20°C. The purity of the extracted DNA was evaluated using a NanoDrop ND-1000 spectrophotometer (Thermo Fisher Scientific, USA), and both the quantity and quality were determined with a Qubit Fluorometer (Thermo Fisher Scientific).
3.5. Multiple-Locus Variable-Number Tandem Repeat Analysis Typing
As detailed in Table 1, MLVA typing employed eight loci: MS-213, MS-214, MS-207, MS-217, MS-222, MS-209, MS-77, and MS-172. PCR was performed in a total volume of 25 µL, including 2.0 µL of template DNA, 11.5 µL Maxima Hot Start PCR Master Mix (2 ×) (Fermentas GmbH, St. Leon-Rot, Germany), 0.75 µL of each primer, and 10.0 µL of ddH2O. The cycling conditions in a Techne TC-512 thermocycler (Eppendorf, Hamburg, Germany) were as follows: An initial denaturation at 94°C for 3 minutes, followed by 35 cycles of 94°C for 30 seconds, 67°C for 25 seconds, 72°C for 25 seconds, and a final extension at 72°C for 4 minutes. PCR products were visualized under UV light after electrophoresis at 100 V for 50 minutes on a 2.0% agarose gel stained with DNA safe stain (SinaClon, Tehran, Iran). Amplicon sizes were calculated using GeneTools software from SynGene version 8.3 (10).
Table 1.
Eight Variable-Number Tandem Repeat Loci Used in the Study for Pseudomonas aeruginosa Typing
| Locus Name | Primer Sequences (5ʹ → 3ʹ) | Product Size (bp) | References |
|---|---|---|---|
| MS-213 | 103 | (13) | |
| Forward | 5ʹ -TGGCGTACTCCGAGCTGATG-3ʹ | ||
| Reverse | 5ʹ -CTGGGCAAGTGTTGGTGGARC-3ʹ | ||
| MS-214 | 115 | ||
| Forward | 5ʹ -CCATCATCCTCCTACTGGGTT-3ʹ | ||
| Reverse | 5ʹ -AAACGCTGTTCGCCAACCTCTA-3ʹ | ||
| MS-222 | 101 | ||
| Forward | 5ʹ -TGCAGTTCTGCGAGGAAGGCG-3ʹ | ||
| Reverse | 5ʹ -AGAGGTGCTTAACGACGGAT-3ʹ | ||
| MS-209 | 148 | (10) | |
| Forward | 5ʹ -CAGCCAGGAACTGCGGAGT | ||
| Reverse | 5ʹ -CTTCTCGCAACTGAGCTGGT | ||
| MS-217 | 606 | ||
| Forward | 5ʹ - TTCTGGCTGTCGCGACTGAT -3ʹ | ||
| Reverse | 5ʹ - GAACAGCGTCTTTTCCTCGC -3ʹ | ||
| MS-207 | 146 | ||
| Forward | 5ʹ - ACGGCGAACAGCACCAGCA -3ʹ | ||
| Reverse | 5ʹ - CTCTTGAGCCTCGGTCACT -3ʹ | ||
| MS-77 | 442 | ||
| Forward | 5ʹ - GCGTCATGGTCTGCATGTC -3ʹ | ||
| Reverse | 5ʹ - TATACCCTCTTCGCCCAGTC -3ʹ | ||
| MS-172 | 789 | ||
| Forward | 5ʹ - GGATTCTCTCGCACGAGGT -3ʹ | ||
| Reverse | 5ʹ - TACGTGACCTGACGTTGGTG -3ʹ |
3.6. Data Analysis
To construct the evolutionary diagram, data were input into the genotyping software available at http://mlva.u-psudFr/mlvav4/. The dendrogram for the isolates was generated using the class coefficient and the UPGMA algorithm. Strains with 82% or greater similarity in the number of repetitions based on the difference in 2 VNTR loci (DLV) were grouped into one type, while others were categorized into different types. The size of the PCR product for each VNTR was determined using a gel documentation device during gel electrophoresis. These sizes were then analyzed using GeneTools software from SynGene version 8.3. The number of allelic profiles for each locus was calculated using a specific formula, and data were entered into Excel for further analysis. Subsequently, the data were processed using PHYLOViZ 2.0 software to draw the evolutionary diagram (5).
3.7. Statistical Analysis
The relationship between categorical variables, including biofilm characteristics and antimicrobial resistance, was analyzed using the chi-square test with SPSS 22.0 software (SPSS Inc., Chicago, IL, USA). A P-value of less than 0.05 was considered statistically significant.
4. Results
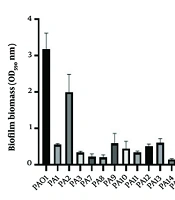
A total of 79 P. aeruginosa isolates were collected, with 51.9% (n = 41) from male and 48.1% (n = 38) from female patients. The distribution of samples according to origin is shown in Figure 1. Urine samples constituted the majority (35.4%, n = 28), while cerebrospinal fluid (CSF) samples were the least common (1.3%, n = 1). Other sources included respiratory tract [bronchoalveolar lavage (BAL), sputum, and endotracheal tubes (ETT)], wounds, blood, and skin lesions, in descending order of frequency. Distribution by hospital department was as follows: ICU (40.5%, n = 32), infectious disease (27.8%, n = 22), emergency (17.7%, n = 14), surgery (7.5%, n = 6), and hemodialysis (6.3%, n = 5). Figure 2 displays the highest resistance rates observed for CAZ at 77.2% (n = 61), CHL at 65.8% (n = 52), CRO at 53.2% (n = 42), tetracycline (TET) at 40.5% (n = 32), and LEV at 37.9% (n = 30). Resistance to other antimicrobials included CIP at 17.7% (n = 14), GM at 12.6% (n = 10), PRL at 8.8% (n = 7), TC at 2.5% (n = 2), and ticarcillin-clavulanate (TCC) at 1.3% (n = 1). No resistance to PTZ was observed. Resistance to imipenem (IMP) was found in 36.7% (n = 29) of isolates, categorizing them as Carbapenem-resistant P. aeruginosa (CRPA). Multidrug-resistant isolates constituted 43.6% (n = 51). Biofilm formation was noted in 92.4% (n = 73) of isolates, classified as weak in 22.7% (n = 18), moderate in 28.7% (n = 21), and strong in 46.5% (n = 34). A minor portion, 7.5% (n = 6), did not exhibit biofilm production.
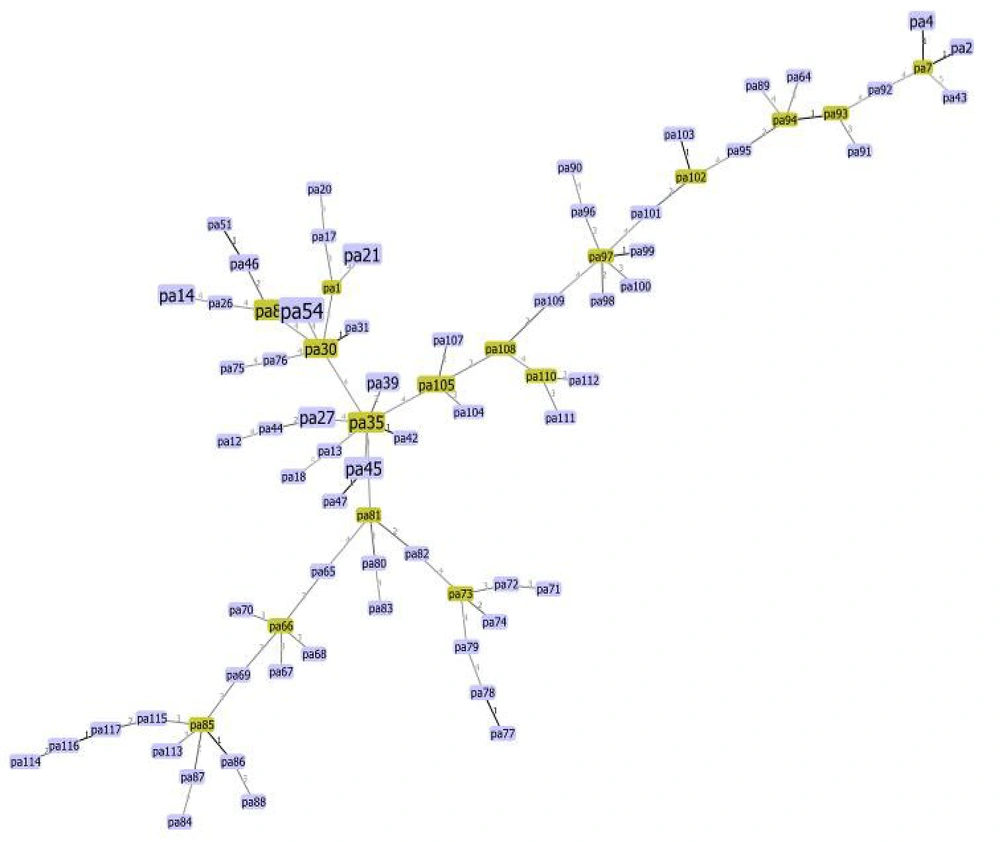
Figure 1.
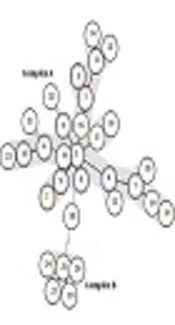
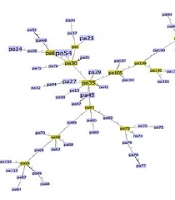
A minimum spanning tree algorithm based on multiple-locus variable-number tandem repeat analysis (MLVA) markers for Pseudomonas aeruginosa. Each circle represents a unique type, with its size indicating the number of strains with that specific type. Connections between the strains and the lengths of the branches linking them illustrate the relationships. Thick black lines connecting pairs of MLVA types indicate a difference in one variable-number tandem repeat (VNTR) locus. The number on each circle signifies 100% identity among them.
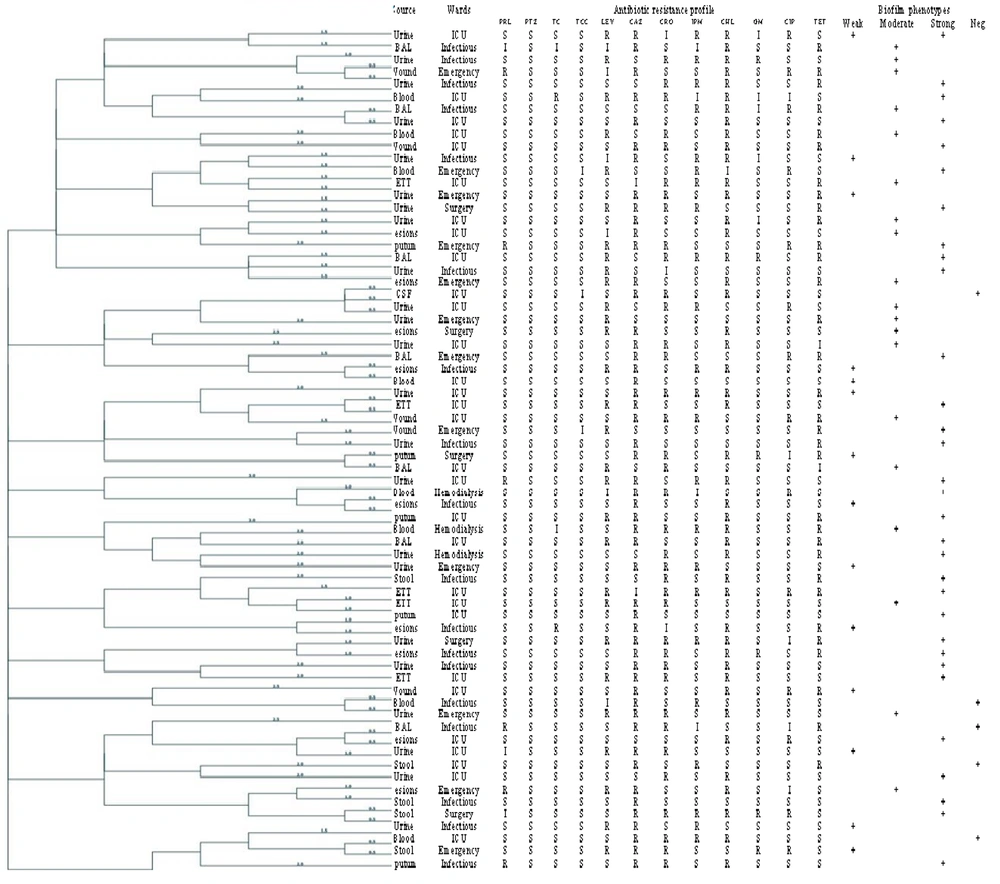
Figure 2.
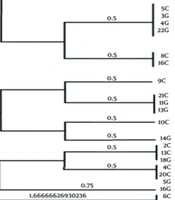
Phylogenetic tree based on the multiple-locus variable-number tandem repeat analysis (MLVA) markers in this study
Genetic diversity among strains was evaluated using the MLVA method targeting eight loci: MS-213, MS-214, MS-209, MS-217, MS-222, MS-207, MS-77, and MS-172. The phylogenetic tree illustrated variations among bacterial isolates, with allelic differences observed at one (12 isolates), two (14 isolates), and three (21 isolates) VNTR loci. Other isolates exhibited variations at more than four loci, indicating significant genetic diversity (Figure 1).
Notably, no isolates had VNTR sequences similar enough to be classified in the same clade, highlighting the extensive genetic diversity of the isolates. Particularly, two wound isolates, both forming strong biofilms, exhibited genetic relatedness across loci 1, 1, 3, 4, 2, 17, 10, and 5. Additionally, four isolates, including two strong and two moderate biofilm producers, were related across loci 13, 24, 1, 3, 2, 10, and 6. Of these, three were sourced from wound samples, and one from a skin lesion. Moreover, three strains isolated from bronchoalveolar lavage (BAL) samples, all showing strong biofilm formation, demonstrated genetic relatedness across loci 9, 16, 2, 3, 3, 8, 11, and 7 (Figure 2). Statistical estimations with a 95% confidence interval (CI) through resampling indicated that the Simpson’s index (0.906) and Shannon-Weiner diversity index (H: 3.466, J: 0.910, Hmax: 3.807, and Hmin: 1.242) identified the MS77 marker as the most informative for capturing the genetic diversity of our isolates.
5. Discussion
Pseudomonas aeruginosa is recognized as an opportunistic pathogen and a significant contributor to hospital-acquired infections. Numerous studies have highlighted the escalating antibiotic resistance in these strains, posing a global challenge and a fundamental concern worldwide (14, 15). Additionally, a significant association between antimicrobial resistance and biofilm production has been identified. This correlation is attributed to the extracellular polymeric substances (EPS) produced in biofilms, which impede the entry of antibiotics into the bacterial cells (16). Consistent with our findings, a four-year study in the United States from 2012 to 2015 by Sader et al. revealed that the only antimicrobial agents with a sensitivity rate exceeding 90% were associated with CAZ (17). The role of biofilms in antimicrobial resistance is complex, exerting a substantial influence on resistance dynamics. Bacteria residing within biofilms exhibit a noteworthy 10 to 1,000-fold increase in AMR compared to their planktonic counterparts (18).
Our study aligns with these observations, demonstrating higher antibiotic resistance in strains that exhibit strong biofilm production. This phenomenon suggests hindered drug penetration into bacterial cells, supporting findings similar to those reported by Pournajaf et al. (12). In contrast, Alkhulaifi and Mohammed reported a MDR pattern in 72.6% of their 81 clinical and 14 environmental P. aeruginosa isolates, which differs from our findings. This disparity may be attributed to variations in the sources of the samples (19). Additionally, Plukarz et al. documented that 28.8% of their isolates were biofilm producers, contrasting our observed 92.4%. Regional disparities and variations in sample types could potentially account for these difference (20).
The MLVA technique showcased a high level of accuracy in distinguishing differences among isolates. In a study by Vu-Thien et al. in France, the MLVA method successfully discriminated 163 P. aeruginosa isolates into 39 patterns (10). Similarly, in 2017, Lalancette et al. classified 41 isolates into 8 different genotypes using MLVA (21).
These findings underscore MLVA's ability to reveal gene mutations and genetic diversity arising from the transfer of mobile genetic elements, such as plasmids, pathogenicity islands, and transposons, within the bacterial genome. This diversity creates distinct genetic patterns, valuable in epidemiological research. In their study, Lashgarian et al. classified 70 P. aeruginosa strains collected from urine samples into 36 sequence types following electrophoresis and the determination of VNTR numbers (22). Their research demonstrates the utility of this technique for typing clinical strains of P. aeruginosa, highlighting its potential to distinguish isolates with high phenotypic similarity. Considering the origin of our samples and building upon their findings, the observed differences in sequence types in our study are justified. Similarly, according to Vu-Thien et al., two microsatellites, ms207 and ms209, exhibit high diversity indices, indicated by an HGDI value close to or greater than 0.8. However, the analysis of these microsatellites requires the use of a sequencer or other high-resolution equipment (10).
The global index of diversity for the 15 markers with 190 isolates stands at 0.97%. In our study, the Simpson index (0.906) and Shannon-Wiener diversity index (H: 3.466, J: 0.910, Hmax: 3.807, and Hmin: 1.242) indicated that MS77 was the most effective genetic diversity indicator. The stability of VNTRs in MLVA-types from patients is remarkably consistent over time, with occasional variations such as the insertion of an IS element or the addition/deletion of repeats in a single VNTR, typically a microsatellite. A study by Jarych et al., irrespective of geographical distance and sample origin (different clinical samples vs. CF patients), supports our findings, suggesting that MLVA is a robust genotyping method applicable for systematic surveys of P. aeruginosa isolates in patients. The study demonstrates the method's effectiveness in discriminating isolates (23).
5.1. Conclusions
In this study, a notable observation is the escalating trend in antibiotic resistance, emphasizing the need for regular monitoring. A direct correlation was identified between antibiotic resistance and biofilm production. Imperative measures include restricting the indiscriminate use of antibiotics and implementing stringent monitoring systems to ensure rational drug utilization. The results underscore the efficacy of MLVA as a rapid and cost-effective typing method, exhibiting high reproducibility and effectiveness in genotyping clinical isolates of P. aeruginosa. MLVA notably demonstrates its potential in distinguishing between isolates showing high phenotypic similarity.